

Non-technical summary
Apoptosis is a crucial mechanism for tissue maintenance and deregulation of apoptosis may lead to catastrophic consequences in humans (e.g. cancer). The present work is a first attempt to quantitatively characterize rearrangement of the monovalent ion fluxes in cells during apoptosis. An established model of apoptosis induced by staurosporine in lymphoid U937 cells is used to experimentally measure cellular Cl− content and fluxes, K+, Na+ and water content as well as ouabain-sensitive and -resistant Rb+ fluxes. A mathematical model is developed to account for the unidirectional ion fluxes and water balance in a cell as a whole. A decrease in the channel permeability of the plasma membrane for Na+ proved to be crucial for preventing cell swelling due to the decrease in Na+/K+ pump activity in cells undergoing apoptosis whereas opening of the K+ and Cl− channels is not required. Supplemental Table S1 is given for easy calculating flux balance under specified conditions.
Abstract
Abstract
Cells dying according to the apoptotic program, unlike cells dying via an unprogrammed mode, are able to avoid swelling and osmotic bursting with membrane disruption. There are indications that apoptosis is accompanied by suppression of the Na+/K+ pump and changes in the K+ and Cl− channels. It remains unclear how ion fluxes through individual ion pathways are integrated so as to induce loss of intracellular ions and concomitant apoptotic volume decrease. A decrease in activity of the sodium pump during apoptosis should cause cell swelling rather than shrinkage. We have made the first systemic analysis of the monovalent ion flux balance in apoptotic cells. Experimental data were obtained for human U937 cells treated with staurosporine for 4–5 h, which is known to induce apoptosis. The data include cellular Cl− content and fluxes, K+, Na+, water content and ouabain-sensitive and -resistant Rb+ fluxes. Unidirectional monovalent ion fluxes were calculated using these data and a cell model comprising the double Donnan system with the Na+/K+ pump, Cl−, K+, Na+ channels, the Na+–K+–2Cl− cotransporter (NKCC), the Na+–Cl− cotransporter (NC), and the equivalent Cl−/Cl− exchange. Apoptotic cell shrinkage was found to be caused, depending on conditions, either by an increase in the integral channel permeability of membrane for K+ or by suppression of the pump coupled with a decrease in the integral channel permeability of membrane for Na+. The decrease in the channel permeability of membrane for Na+ plays a crucial role in cell dehydration in apoptosis accompanied by suppression of the pump. Supplemental Table S1 is given for easy calculating flux balance under specified conditions.
Introduction
Cells dying according to the apoptotic program, unlike cells dying via an unprogrammed mode, are able to prevent swelling and osmotic bursting with membrane disruption. Intracellular macromolecular compounds can exit into the interstitial medium therefore only after enzymatic splitting or in ‘containers’ such as ‘apoptotic bodies’. Apoptosis has been defined historically as a ‘shrinkage necrosis’ (Kerr, 1971). There is abundant evidence that ion channels and transporters are involved in apoptosis (Burg et al. 2006; Lang et al. 2006, 2007, 2008; Okada et al. 2006; Bortner & Cidlowski, 2007). An important function of the ion transporting system is maintenance of the cell water balance (Hoffmann et al. 2009). A decrease in activity of the sodium pump, and an increase in opening of the K+ and Cl− channels, are believed to be responsible for the loss of intracellular ions and concomitant apoptotic cell shrinkage (Nobel et al. 2000; Bortner et al. 2001). The extent to which changes in ion fluxes through distinct ion pathways are integrated so as to give rise to cell shrinkage specific to apoptosis is not settled, however. In particular, the decrease in the sodium pump activity during apoptosis should lead to cell swelling, but in fact shrinkage occurs (Maeno et al. 2000, 2006; Okada & Maeno, 2001). Opening of the K+ channels should be associated with cell hyperpolarization, but depolarization has been reported (Franco et al. 2006). We have studied the total monovalent ion flux balance in apoptotic cells. A body of experimental data was obtained for an established model of apoptosis, namely human lymphoid cells U937 treated with staurosporine (STS). The data include the intracellular Cl− content and fluxes, K+, Na+ content, ouabain-sensitive and -resistant Rb+ fluxes and cell water content. These data are mathematically sufficient to calculate the total monovalent flux balance in a cell model with the Na+/K+ pump, Cl−, K+ and Na+ channels, and NKCC and NC cotransport, i.e. with all major players in maintenance of the monovalent ion and water balance in animal cells (Hoffmann et al. 2009).
Modelling of the total monovalent ion flux balance during apoptosis yielded some new and unexpected results. A decrease in the integral channel permeability of membrane for Na+ appeared to be crucial in preventing the cell swelling which should be caused by a decrease of pump activity in cells undergoing apoptosis. The model showed that apoptotic cell shrinkage can occur without an increase in opening of the K+ channels. Characterizing the specific role of monovalent ions in cell water regulation during apoptosis is a principal aim of this study. The work also provides a computational model for analysis of ion fluxes and water balance in cells.
Methods
Reagents
RPMI 1640 medium and fetal bovine serum (FBS, HyClone Standard) were purchased from Biolot (Russia). Staurosporine (STS), ouabain, bumetanide, 4,4-diisothiocyanatostilbene-2,2-disulfonic acid (DIDS), 5-nitro-2-(3-phenylpropylamino)benzoic acid (NPPB), N-methyl-d-glucamine (NMDG) and glutamic acid were purchased from Sigma-Aldrich (Germany). Percoll was from Pharmacia (Sweden). The isotope 36Cl− was from ‘Isotope’ (Russia). Salts were of analytical grade and were from Reachem (Russia).
Cell cultures
Three strains of U937 cells were studied: cells of strains 1 and 2 (Cells 1 and 2) were obtained from the Russian cell culture collection (Institute of Cytology, Russian Academy of Sciences, catalogue numbers U937-160B2 and U937-9957, respectively). Cells of strain 3 were obtained from the German Collection of Microorganisms and Cell Cultures (DSMZ). Cells 1a and 1b denote independent series of experiments. Cells were cultured in RPMI 1640 medium supplemented with 10% FBS at 37°C and 5% CO2. For induction of apoptosis, the cells, at a density of 1 × 10⁶ cells ml−1, were exposed to staurosporine for 4–5 h. All the incubations were done at 37°C.
Determination of intracellular ion content and Rb+ influx
Intracellular K+, Na+ and Rb+ content was measured by emission photometry in an air–propane flame using a Perkin-Elmer AA 306 spectrophotometer, as described previously (Yurinskaya et al. 2005a,b;). In summary, the cells were pelleted in RPMI medium, washed five times with MgCl2 solution (96 mm) and treated with 5% trichloroacetic acid (TCA). TCA extracts were analysed for ion content. To study Rb+ influx, a 50 mm stock solution of RbCl was added to 1 ml of cell suspension (∼1 × 10⁶ cells) so as to yield 2.5 mm final concentration of Rb+. Cells were incubated with Rb+ for 10 min at 37°C with or without 0.1 mm ouabain. It has been shown previously for U937 cells that Rb+ is a good substitute for K+, as in many other cells, and that ouabain-sensitive Rb+ influx should be measured for short time intervals (5–10 min), since treatment of cells with ouabain for more than 10 min was followed by a remarkable increase in cell Na+ content (Vereninov et al. 2007). To determine the intracellular Cl−, cells were cultured for 90 min or more at 37°C in RPMI medium containing 36Cl− (0.12 μCi ml−1, Isotope, Russia). The radioactivity of 36Cl− in TCA extracts was measured using a liquid scintillation counter (Beckman LS 6500).
The intracellular Cl− content was calculated taking into account the specific activity of 36Cl− (∼2 counts min−1μmol−1). The TCA precipitates were dissolved in 0.1 n NaOH and analysed for protein by the Lowry procedure, with serum bovine albumin as a standard. The cell ion content was calculated in micromoles per gram of protein.
Determination of cell water content
Cell water was determined by measurements of the buoyant density of the cells in a continuous Percoll gradient, as described previously (Yurinskaya et al. 2005a,b; Vereninov et al. 2008). In summary, the Percoll solution was prepared according to the manufacturer's instruction and a thick cell suspension (0.1–0.2 ml, ∼3 × 10⁶ cells) was placed on the solution surface and centrifuged for 10 min at 400 g (MPW-340 centrifuge, Poland). The buoyant density of the cells was estimated using density marker beads (Sigma-Aldrich, Germany). The water content per gram of protein, vprot, was calculated as vprot= (1 −ρ/ρdry)/(0.79(ρ− 1)), where ρ is the measured buoyant density of the cells and ρdry is the cell dry mass density, which was 1.35 g ml−1. The proportion of protein in dry mass was 79%. The relative changes in cell water are virtually independent of the values of ρdry and the protein proportion, whereas the absolute water content does exhibit dependence on these values.
Study of 36Cl− gain and release from cells; calculation of fluxes and rate constants
To study the time course of 36Cl− uptake, the cells were cultured in RPMI medium with 36Cl− (0.12 μCi ml−1) for 5 min, 10 min and 90 min at 37°C. The samples containing cells were then prepared as for the ion content assay (Yurinskaya et al. 2010). To determine the rate of 36Cl− release, the cells were preloaded with the tracer for 90 min at 37°C. Then cells were sedimented by centrifuging, washed with 96 mm MgCl2 solution and resuspended in 36Cl−-free RPMI medium for 5 or 10 min at 37°C so as to attain a final concentration of (1–2) × 106 cells ml−1. The cells and the incubation medium were then analysed for 36Cl− content. The ion tracer exchange between the cell and the medium was fitted by equations: y(t) =y∞(1 − exp(−kt)) for the ion gain and y(t) = y0 exp(−kt) for ion release where y(t) is the tracer content at time t and y∞ and y0 are the final and initial contents; here k is the rate constant of ion equilibration, the same in both equations. This rate constant k was calculated from these equations for the single time points (5 or 10 min), or was determined by fitting parameters to the experimental data. The Cl− fluxes were calculated as k Cli−.
Statistical analysis
The data are shown as means ± SEM. Student's t test was used to evaluate the statistical significance. The significance level was set at P < 0.05.
The authors have read and the experiments comply with the policies and regulations of The Journal of Physiology given by Drummond (2009).
Results
36Cl− movement and distribution
The rate constant of 36Cl− exchange in the cells under normal conditions was in the range 0.12–0.19 min−1 (Fig. 1, Table 1), a value similar to that of other proliferating cells (Aull et al. 1977; Hoffmann et al. 1979; Levinson, 1985; Ladoux et al. 1987). Incubation of cells in the medium with 36Cl− for 60–90 min is therefore sufficient to reach a balanced 36Cl− distribution. The rate constant of 36Cl− exchange in cells undergoing apoptosis induced by 1 μm STS increased by a factor of 1.3–1.5 for 4 h. The slower release of 36Cl− into the Na+-free and Cl−-free NMDG–glutamic medium in comparison with the release in standard RPMI medium is usually taken as an indication that some portion of the Cl− efflux relates to the Cl−/Cl− exchange or cotransport pathways (Hoffmann et al. 1979; Simchowitz & De Weer, 1986; Simchowitz et al. 1986). The intracellular Cl− content calculated on the basis of a steady-state 36Cl− distribution fell by a factor of 1.7–2.2 (depending on the cell strain) during apoptosis subsequent to exposure to 1 μm STS, and by a factor of 1.4 during apoptosis following exposure to 0.2 μm STS (Table 1).
Figure 1. Time course of 36Cl− uptake (A) and release (B) in U937 cells undergoing apoptosis caused by exposure to 1μm staurosporine for 4h (STS, triangles).

A, 36Cl− uptake (Cells 3). B, 36Cl− release (Cells 1) after loading with tracer for 1.5 h in RPMI medium without (Control) or with STS given in relative units (r.u.). Filled circles show Cl− release from control Cells 1 into NMDG–glutamic medium free of Na+ and Cl−. The data were approximated by equations with the parameters fitted as shown in the plots. Values are means ± SEM. of 3–4 experiments, with duplicate or triplicate determinations.
Table 1.
Ion and water balance in U937 cells under normal conditions (Control) and during apoptosis caused by exposure to 0.2 or 1 μm staurosporine for 4 h (STS)
| Cells 1a | Cells 1b | Cells 2 | Cells 3 | |||||
|---|---|---|---|---|---|---|---|---|
| Control | STS 1 | Control | STS 0.2 | Control | STS 0.2 | Control | STS 1 | |
 (μmol g−1) (μmol g−1) |
229 ± 10 (14) | 133 ± 10 (14) | 225 ± 7 (32) | 158 ± 5 (28) | 253 ± 10 (30) | 186 ± 5 (26) | 224 ± 5 (9) | 104 ± 6 (6) |
| k (min−1) | 0.14 ± 0.01 (18) | 0.21 ± 0.01 (18) | 0.19 ± 0.03 (5) | 0.17 ± 0.02 (8) | 0.12 ± 0.03 (5) | 0.13 ± 0.004 (5) | 0.16 ± 0.01 (12) | 0.20 ± 0.01 (12) |
 (μmol min−1 g−1) (μmol min−1 g−1) |
32.5 | 27.5 | 42.7 | 26.9 | 30.4 | 24.2 | 34.9 | 21.0 |
 (μmol g−1) (μmol g−1) |
697 ± 30 (16) | 528 ± 20 (16) | 586 ± 9 (34) | 510 ± 10 (28) | 646 ± 7 (31) | 429 ± 20 (26) | 617 ± 8 (9) | 484 ± 16 (9) |
 (μmol g−1) (μmol g−1) |
213 ± 9 (16) | 282 ± 2 (16) | 138 ± 3 (34) | 151 ± 7 (28) | 136 ± 4 (31) | 241 ± 20 (26) | 174 ± 8 (9) | 220 ± 14 (9) |
| Water (ml g−1) | 5.52 ± 0.13 (4) | 4.55 ± 0.06 (4) | 5.64 ± 0.1 (8) | 5.00 ± 0.07 (8) | 5.76 ± 0.2 (8) | 4.96 ± 0.11 (8) | 5.60 ± 0.04 (3) | 4.34 ± 0.19 (2) |
| Water decrease (%) | −17.6 | −11.3 | −13.9 | −22.5 | ||||
| Cell density (g ml−1) | 1.048 ÷ 1.055 | 1.055 ÷ 1.064 | 1.046 ÷ 1.055 | 1.052 ÷ 1.059 | 1.045 ÷ 1.054 | 1.053 ÷ 1.059 | 1.048 ÷ 1.052 | 1.059 ÷ 1.066 |
 (μmol min−1 g−1) (μmol min−1 g−1) |
1.88 ± 0.08 (23) | 1.04 ± 0.07 (23) | 1.71 ± 0.07 (31) | 1.87 ± 0.10 (28) | 1.94 ± 0.07 (27) | 1.43 ± 0.07 (24) | 2.19 ± 0.06 (53) | 0.93 ± 0.03 (52) |
 (μmol min−1 g−1) (μmol min−1 g−1) |
0.30 ± 0.02 (23) | 0.33 ± 0.01 (23) | 0.27 ± 0.01 (31) | 0.44 ± 0.03 (28) | 0.72 ± 0.04 (27) | 0.69 ± 0.05 (24) | 0.42 ± 0.01 (53) | 0.27 ± 0.01 (45) |
| All osmolytes (mosmol g−1) | 1.71 | 1.41 | 1.75 | 1.55 | 1.79 | 1.54 | 1.74 | 1.34 |
| Sum of ions (mmol g−1) | 1.14 | 0.96 | 0.95 | 0.82 | 0.94 | 0.86 | 1.01 | 0.81 |
| Share of ions | 0.67 | 0.68 | 0.55 | 0.53 | 0.52 | 0.56 | 0.57 | 0.60 |
k, rate constant of total Cl− exchange;  , measured total Cl− flux under balanced Cl− conditions;
  , total Rb+ influx in absence of ouabain;
  , Rb+ influx in presence of 0.1 mm ouabain. Share of ions, a portion of intracellular K+, Na+ and Cl− in the total intracellular osmolytes. Data were obtained in three U937 cell strains. Indexes a, b of Cells 1 indicate independent series of experiments. Values are means ± SEM; the number of determinations is given in parentheses.
The present data on the Cl− content and its changes in apoptosis induced by STS are in agreement with values obtained for U937 cells by X-ray microanalysis (Fernández-Segura et al. 1999; Arrebola et al. 2005a, 2005b, 2006). The steady-state influx and efflux of Cl− was in the range 21–43 μmol g−1 min−1 (Table 1). The difference between influx and efflux in STS-treated cells, i.e. the net Cl− flux, was estimated by an integration of the decrease of the intracellular Cl− content over apoptosis lasting 4 h. The resulting value of about 0.4–0.5 μmol g−1 min−1 was small in comparison with the ‘turnover’ flux. The state of the cells after incubation with STS for 4 h is therefore essentially balanced with regard to the Cl− distribution. A similar balance was found for the Na+ and K+ (Rb+) fluxes in U937 cells during STS-induced apoptosis (Vereninov et al. 2007). The flux balance equations were used to analyse the changes of the Cl−, Na+ and K+ transport in apoptosis.
Balance of osmolytes
Determination of cell water by measuring the cell buoyant density and the intracellular K+ and Na+ by flame emission, together with 36Cl− determination, allowed us to estimate the contribution of K+, Na+, Cl− and other intracellular osmolytes to apoptotic cell shrinkage. The total intracellular content of osmolytes can be calculated from the cell water content, since the total osmolarity of the intracellular medium in animal cells should be the same as that in the external solution. The percentage of cellular K+, Na+ and Cl− in the total amount of all osmolytes under control conditions at an external osmolarity of 310 mosmol l−1 varied from 67% in Cells 1b to 52% in Cells 2 (share of ions in Table 1). The other 40–50% is accounted for by the ‘residual’ intracellular osmolytes. The bulk decrease in intracellular osmolytes in apoptosis of the cells, determined from the drop in cell water content, was 0.3–0.4 mosmol (g protein)−1 in the cells treated with 1 μm STS, and was 0.2–0.25 mosmol (g protein)−1 following treatment with 0.2 μm STS. This decrease resulted from the loss of K+, Cl− and ‘residual’ intracellular osmolytes, and the opposing Na+ uptake (Fig. 2). Approximately 30–60% of the loss was due to K+, 20–30% to Cl− and 20–40% to residual intracellular osmolytes.
Figure 2. Loss of K+, Cl−, residual osmolytes (A) and gain of Na+ in U937 cells following induction of apoptosis by 1 or 0.2 μm staurosporine for 4 h (STS).

Residual intracellular osmolytes were calculated by subtracting the K+, Na+ and Cl− content from total intracellular osmolytes: A = 310 × Water – (K++ Na++ Cl−). See note to Table 1 for further details.
An increase in the cellular Na+ content is a characteristic feature of apoptosis. This reduces the shrinkage caused by the loss of K+, Cl− and other intracellular osmolytes. An increase in intracellular Na+ in apoptosis of U937 cells caused by etoposide is sufficient to balance in full the loss of K+, Cl− and other osmolytes, and to prevent cell shrinkage (Yurinskaya et al. 2005a).
Changes of channels and transporters in apoptotic cells based on the overall balance of the Cl−, K+ and Na+ fluxes
Modelling of the overall balance of the Cl−, K+ and Na+ fluxes
The values of the Cl−, K+ and Na+ concentrations and the Cl− and K+ fluxes given a balanced ion distribution allow us to compute all net fluxes of Cl−, K+ and Na+ via distinct pathways across the cell membrane provided that a set of pathways is specified (see Appendix). The minimal model should consist of the Na+/K+ pump, Cl−, K+ and Na+ channels, and electroneutral NKCC or NC cotransport pathways. The stoichiometry of NKCC cotransport is assumed to be 1:1:2 (Russell, 2000). Na+–Cl− (NC) cotransport with 1:1 stoichiometry may be performed by a single transport protein, like thiazide-sensitive Na+-Cl− cotransporter (Gamba, 2005), or by two functionally coupled exchangers, e.g. NHE and Cl−/HCO3− (Garcia-Soto & Grinstein, 1990; Hoffmann et al. 2009). Active transport of Cl− due to cotransport with Na+ or with Na+ and K+ is required because the balanced distribution of Cl− can deviate from electrochemical equilibrium.
When is the simultaneous balance of Cl−, K+ and Na+ fluxes possible?
Analysis of the flux balance equation shows that the flux balance for each species of monovalent ions, Cl−, Na+ and K+, can be accomplished in the model with NKCC cotransport at any value of the total measured Cl− flux,  . However, in the model with NC the flux balance may exist only if the sum of the unidirectional fluxes via cotransporter and channels,
  , does not exceed a certain limit. This limit depends on the balance of the Na+ fluxes because the Na+ flux available for NC cotransport becomes deficient under certain conditions. The limit of
  depends on the cell properties and can be calculated from the data in Table 1 (see Appendix).
An important point is that the measured total Cl− flux,  , in most of the studied cells exceeded significantly the limit of
  calculated for the model with NC (Fig. 3). The difference between the measured value
  and calculated value
  varies in studied cells over a rather wide range. In Cells 1b there was a small difference. The discrepancy between
  and
and  in other cases could be caused by two reasons. One is that the NC model is inadequate. The second is that some portion of the measured Cl− flux consists in a coupled Cl−/Cl− exchange with zero net flux. The existence of the similar exchange fluxes has been postulated rather long ago (see for references Hoffmann et al. 1979). The statement ‘the steady-state isotope fluxes could not be used to measure leak permeability or active transport, since a large portion of the flux can be exchange diffusion’ (Hofmann, 2001) does describe the difficulty but it does not address it. The effect of NMDG–glutamic medium on the rate of Cl− release from U937 cells indicates the Cl−/Cl− exchange could take place in studied cells irrespective of the assumed cotransport model. Therefore, further analysis was performed under various assumptions on the relationship between the Cl−/Cl− exchange component ICl/Cl and the fluxes via pathways capable of net ion transfer, i.e. channels and cotransporters.
Figure 3.

Total measured Cl− flux under the balanced state,  , and calculated limit of unidirectional flux via channels and NC cotransport,
  , in normal (Control) and apoptotic (STS 1, STS 0.2) cells
Figure 4 shows Cl− influx (I) and efflux (J) via distinct pathways in some of the cells calculated for the model with NKCC or NC as a function of ICl/Cl at several chosen values. If ICl/Cl accounts for a large part of the total Cl− flux then the residual fluxes via channels and cotransporters taken together are small, and vice versa. Cells 2 demonstrate that no less than 23 of 30 units of the measured Cl− flux should be accounted for by the coupled Cl−/Cl− exchange if the NC model is considered (see also Fig. 3). The imbalance of the Cl− influx and efflux through channels, as well as via cotransporters, depends on the type of cotransporter in the model and cell properties. When the imbalance is small, a significant part of the self-exchange Cl− flux should be attributed to the channels or cotransporters, but not to a coupled Cl−/Cl− exchange (Fig. 4A). In this case the Cl− distribution is close to the electrochemical equilibrium, the forward and backward fluxes through the channels are equal and cannot be distinguished from the coupled Cl−/Cl− exchange. Separation of the Cl−/Cl− equivalent exchange via the coupled Cl−/Cl− exchange and through the channels therefore appears to be a matter of convention. The imbalance of the channel influx and efflux is more pronounced when the model with NC is considered (Fig. 4C and D). It is true both for channel and cotransport fluxes. An example of small net flux due to NKCC cotransport is shown in Fig. 4A. In this case an integral electrochemical potential difference that moves Cl−, Na+ and K+ via the NKCC pathway, ΔμNKCC, was as small as 7.1 mV, whereas in the other cases (Fig. 4B) it could reach 33 mV (ΔμNKCC =RT/F ln{[Na]i[K]i[Cl]i[Cl]i/([Na]o[K]o[Cl]o[Cl]o)}).
Figure 4. Relationship between Cl− influx (I) and efflux (J) via different pathways in normal and apoptotic U937 cells as a function of the assumed ICl/Cl value for the models with NC or NKCC cotransport.

 , total Cl− flux measured under the balanced state (shown by dotted line); light grey columns, fluxes through channels (IG, JG); dark grey columns, fluxes related to cotransport through NC (
 ,
, ) or NKCC (
 ,
, ). Basic data for calculations are taken from Table 1. Fluxes are given in μmol min−1 (g protein)−1.
The NKCC cotransport fluxes are small in comparison with the measured total Cl− flux  . The flux
  in most of the cells we studied did not exceed 0.6 μmol g−1 min−1 except for Cells 2 (approximately 2 μmol g−1 min−1), whereas the measured total Cl− flux in the studied cells was in the range 21–43 μmol g−1 min−1 (Table 1). This indicates the importance of the approach developed here as it would be difficult to detect such small fractional flux experimentally. The flux
  is also small relative to the measured Cl− flux. The maximal values of
  were about 3–6 μmol g−1 min−1, so that they did not exceed 20% of the measured Cl− flux. The NC and NKCC fluxes are very important in maintaining the balance between total Cl− influx and efflux under the non-equilibrium Cl− distribution. At the same time the changes in these pathways are not critical for apoptotic cell shrinkage, as we supposed earlier (Vereninov et al. 2007). Apoptosis of Cells 1 and 3 with similar shrinkage was accompanied by changes of these fluxes in opposing directions. There were no changes in the cotransport Cl− fluxes in apoptosis induced by 0.2 μm STS in Cells 2, whereas apoptosis of Cells 1b was accompanied by a small increase in IClNKCC and INC (data not shown).
Effects of blockers
Several experiments were performed to determine the effects on Cl− fluxes of known channel blockers, such as NPPB (0.25 mm), DIDS (0.5 mm) and the NKCC cotransport inhibitor bumetanide (0.05 mm). Bumetanide had no obvious effect on the Cl− flux. This corresponds to the minor contribution of NKCC to the total Cl− flux. A small effect of bumetanide has been observed on Rb+ fluxes, the K/Na ratio and the cation content in U937 cells (Vereninov et al. 2008). NPPB and DIDS induced a decrease in the Cl− rate constant by factors of 2 and 1.5, respectively (Fig. 5). The effects of NPPB and DIDS were not additive and can be attributed mainly to their identical target, the Cl− channels. Accordingly, about half of the total unidirectional Cl− flux can be defined as the channel flux. The residual part, which is bumetanide+DIDS+NPPB resistant, has not yet been specified. The contribution of channels to the Cl− flux in U937 cells was greater than in other cells, e.g. in Ehrlich ascites tumour cells, where it approaches 5% of the total Cl− influx (Hoffmann et al. 1979, 2009; Hoffmann, 1982). The NPPB-inhibitable Cl− flux was not increased during apoptosis. This suggests that there was no activation of Cl− channels in the present experiments. Long-term incubation (1.5 or 4 h) of U937 cells with DIDS or NPPB was not followed by significant (>10%) changes in intracellular Cl−, K+ or Na+ content. The increase in the buoyant density of cells, i.e. cell shrinkage, caused by 1 μm STS, was less pronounced if cells were treated by STS with addition of NPPB.
Figure 5. Effects of blockers on the 36Cl− exchange rate constant in U937 cells.
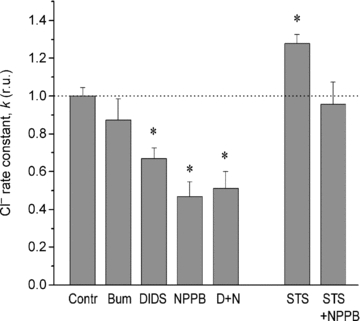
Bumetanide (Bum, 0.05 mm), DIDS (0.5 mm) and NPPB (0.25 mm) were added in RPMI medium, 20 min before 36Cl−. Simultaneous addition of DIDS and NPPB is marked D+N. Rate constants were calculated as k=–ln(1 –y0/y∞)/t, relative units (r.u.). The data were obtained in Cells 3. Means ± SEM for 3–4 experiments, with duplicate determinations. Significant differences from controls are shown by an asterisk (P < 0.05).
Integral channel permeability of the cell membrane for Cl−
Goldman's formalism was used for description of ‘electroconductive’ or ‘channel’ ion pathways as a whole (see Appendix). Figure 6 shows that the calculated values of permeability coefficient PCl depend linearly on the Cl− flux mediated by channels and cotransport  . The values of PCl obtained for the NKCC (large symbols) and for the NC (small symbols) models proved to be almost coincident at one and the same
  . We can conclude therefore that estimation of PCl does not depend practically on the assumed cotransport model (at least if a specific link between cotransport model and the value of the coupled Cl−/Cl− flux is not hypothesized). More difficult is to settle the question of how PCl is altered in apoptosis. It should be known what the subdivision of the total measured Cl− flux into the fluxes
  and ICl/Cl in apoptotic and normal cells is. Apoptotic volume decrease is currently explained often by the opening of the Cl− channels (D'Anglemont de Tassigny et al. 2004; Ise et al. 2005; Okada et al. 2009; Poulsen et al. 2010). Our calculations show that significant increase in PCl in apoptotic cells if it occurs should be accompanied by a no less significant decrease in the coupled Cl−/Cl− flux. However, the values of PCl obtained for the NKCC and for the NC models given identical coupled Cl−/Cl− exchange are similar, and in the apoptotic cells they are equal to or lower than those in control cells (Fig. 6D–F).
Figure 6. Permeability coefficients PCl, PNa, PK and membrane potential U in normal (open symbols) and apoptotic (filled symbols) U937 cells calculated for the models with NKCC (large symbols) or NC (small symbols) cotransporters.

Data are plotted as a function of Cl− influx related to channels and cotransporters,  , or to the coupled Cl−/Cl− exchange, ICl/Cl. Basic data are taken from Table 1. Apoptosis in Cells 1a was induced by 1 μm whereas in Cells 1b and Cells 2 by 0.2 μm STS. PCl, PNa and PK are normalized by using as reference the values obtained for NKCC model with zero Cl−/Cl− exchange. The reference values in ml g−1 min−1 are shown in the left upper corner of the plots. Insets: pump flux (
 , μmol min−1·g−1), PNa (ml g−1 min−1× 100) and PK (ml g−1 min−1× 50) calculated for the NKCC model at zero ICl/Cl; light grey columns are control cells; dark grey columns, apoptotic cells.
Integral channel permeability of the cell membrane for Na+
The solution of the flux balance equation made it possible to calculate PNa without direct measurement of the Na+ fluxes, supposing only that the balanced Na+ distribution holds and that the ratio of the Na+ and K+ fluxes via the pump is 3:2. Figure 6G–I show how PNa changes during apoptosis in models with NKCC and NC cotransport as a function of  . The values of PNa calculated for the NKCC model (large triangles) remain nearly constant over a wide range of
  . The PNa level in apoptosis of Cells 1a and 3 (data not shown) induced by 1 μm STS is 2.5–3.0 times less than in normal cells. For milder apoptosis (Cells 2) induced by 0.2 μm STS, PNa decreases by a factor of 1.6. However, PNa in apoptosis induced by 0.2 μm STS in Cells 1b decreases by only about 10% (compare filled and open large triangles in Fig. 6H). The slight decrease of PNa in this case correlates with the absence of changes in the pump fluxes
  (see inset in Fig. 6B). We can suppose that a decrease of PNa in apoptosis is coupled to a decrease in the pump fluxes. The decrease in the integral channel permeability of membrane for Na+ when the pump is suppressed is useful, because it reduces the gain of Na+ and the concomitant cell swelling. This phenomenon is crucial to apoptotic cell shrinkage when the pump is inhibited.
The values of PNa calculated for the model with NC (Fig. 6G–I, small triangles) depend significantly on the assumed relationship between  and ICl/Cl in the measured total Cl− flux
  . The situation is similar to that for PCl. Comparison of the data calculated at identical ICl/Cl indicates that PNa in apoptosis is lower than that for cells in the normal state for all cases studied except Cells 2 (data not shown). The absolute values of PNa calculated for the models NC and NKCC differ significantly from each other because of the differing contribution of the INC and INKCC fluxes to the total balance of Na+ fluxes.
Integral channel permeability of the cell membrane for K+
Changes in the ouabain-sensitive and ouabain-resistant Rb+ influx during apoptosis of U937 cells induced by STS have been found to depend on the depth of apoptosis and cell properties (Vereninov et al. 2008). The permeability coefficient PK was calculated in the present study using the equations set out in the Appendix. The PK reflects alterations of channel activity more accurately than the flux value because the effect of variations in the membrane potential is eliminated. Figure 6 demonstrates that only the apoptosis in Cells 1b caused by 0.2 μm STS was associated with an increase in PK. In other cells the PK remained unchanged (mild apoptosis of Cells 2), or decreased (more severe apoptosis in Cells 1 and 3). Consequently, cell shrinkage in apoptosis of the cells we studied here occurs mostly without an increase in PK. An increase in PK in apoptosis was observed when the pump flux remained unchanged (Vereninov et al. 2008). No changes were observed in Rb+ efflux during apoptosis of U937 cells following treatment with 1 μm STS in previous experiments, in which the Rb+ efflux was studied after 24 h incubation of cells in RPMI medium with 1 mm Rb+ (Vereninov et al. 2007). The conclusion concerning minute changes of PK holds even if rectification in K+ channels is allowed for in the model (Rubashkin et al. 2010). Insets in Fig. 6A–C illustrate the relationship between changes in the pump flux ( ), PK and PNa in different apoptotic cells observed in the present study.
Membrane potential
The values of the membrane potential calculated according to Ussing (1949) from the measured fluxes and distribution of Rb+ are shown in Fig. 6K–M. The membrane potential in the U937 cells was in the range of −30 to −50 mV. This value is consistent with the measured and calculated values obtained for various proliferating cells (Hoffmann et al. 1979; Lambert et al. 1989; Wonderlin et al. 1995; Ouadid-Ahidouch et al. 2004). The calculated membrane potential in the model with NC does not depend on the assumed portion of ICl/Cl in the measured total Cl− flux. In contrast, in the NKCC model a portion of the Cl− flux is coupled to the K+ flux in the NKCC cotransporter. The ratio of channel K+ (Rb+) efflux to influx is therefore changed. Consequently, the membrane potential is changed. An increase in membrane potential becomes apparent when the flux ICl/Cl exceeds 85% of the total measured flux  .
.
The calculated membrane potential of all cells, except Cells 2, was hyperpolarizing by 10–15 mV in apoptosis. For Cells 2 the potential did not change during apoptosis. These results differ from previous findings (Franco et al. 2006), and further studies are required to determine whether cell depolarization occurs in more severe apoptosis or whether the cell model we have used here is incomplete. A more complex model, including cotransport KCC and the assumption that apoptosis is accompanied by KCC decrease, sees cell depolarization (Rubashkin et al. 2010).
Discussion
It is clear that the monovalent ion channels and transporters are involved in apoptosis. Numerous studies, mostly electrophysiological, indicate that apoptosis is associated with changes to various ion channels and transporters. Conversely, alteration of the channels and transporters can influence apoptosis. It is important to distinguish the role of monovalent ions in signalling related to apoptosis, and their role as osmolytes responsible for preventing osmotic bursting of a cell during apoptosis. This second role has not been investigated in detail. Many studies provide information only on one species of ions or a single ion pathway, and do not consider the overall ion and water balance of the cell. Recent progress has been made by elemental X-ray microanalysis of cells undergoing apoptosis (Fernandez-Segura et al. 1999; Skepper et al. 1999; Arrebola et al. 2005a,b, 2006). Quantitative changes in the joint K, Na, Cl, P, Mg and S content in U937 cells undergoing apoptosis due to exposure to staurosporine or other agents was estimated in these works. Unfortunately there was no determination of cell water, so that the analysis of the ion and water balance in apoptotic cells is not complete. Further progress was achieved by Poulsen et al. (2010), who determined in apoptotic Ehrlich ascites tumour cells the K+, Na+, Cl− levels, ‘ninhydrin-positive’ substances and cell water. In the present study we have aimed to determine all major players in the apoptotic disturbance of osmotic balance in human lymphoma U937 cells treated with STS. The amount of intracellular osmolytes other than K+, Na+ and Cl− was calculated by subtraction of the monovalent ion content from the total intracellular osmolyte content. The latter was calculated in turn from the amount of cell water and the total osmolarity of the extracellular (and hence intracellular) medium. The errors in this procedure are critical for the estimation of ‘residual’ intracellular osmolytes, and the information obtained should be regarded as approximate. Our findings nevertheless indicate that the apoptotic decrease in the intracellular amount of osmolytes defined as ‘residual’ is comparable with the decrease in Cl− content. The decrease in Cl−, K+ and ‘residual’ intracellular osmolytes is responsible for the total decrease in cell water, whereas the increase in Na+ plays an opposite role. The decrease in Cl−, K+ and ‘residual’ intracellular osmolytes in U937 cells undergoing apoptosis following exposure to etoposide is fully counterbalanced by an increase in Na+ content, and no cell shrinkage occurs (Yurinskaya et al. 2005a).
Analysis of ‘isosmotic’ cell volume regulation in apoptosis is based mainly on analogy with ‘anisosmotic’ cell volume regulation by such reactions as regulatory volume decrease (RVD) and regulatory volume increase (RVI). This is why the term apoptotic volume decrease (AVD) was coined (Maeno et al. 2000; Okada & Maeno, 2001; Burg et al. 2006; Okada et al. 2006; Bortner & Cidlowski, 2007; Lambert et al. 2008; Lang et al. 2008; Hoffmann et al. 2009). In fact the RVD is usually studied as a short-term response to the acute osmotic disturbance associated with the sharp (up to 1.5 times) increase in the cell volume, whereas long-term apoptotic cell shrinkage is a drift of the essentially balanced ion and water distribution. This is associated with a decrease in the cell volume of about 15–25%. To study apoptotic cell shrinkage we therefore applied the flux balance equations to the double Donnan system with the Na+/K+ pump, the Na+, K+ and Cl− electroconductive channels, NKCC or NC cotransport, and Cl−/Cl− exchange. The present paper is based on this approach.
Estimation of the Cl− flux related to the Cl−/Cl− exchange pathway is crucial in calculating the total balance of the unidirectional Cl−, Na+ and K+ fluxes. Because of difficulties in the experimental detection of the coupled Cl−/Cl− flux under a balanced ion distribution, the calculations were performed for different values of the Cl−/Cl− flux. Significant conclusions can be drawn by modelling the total ion flux balance in the cells under study in spite of the uncertainty in the determination of the Cl−/Cl− flux and the simplistic mathematical model. A decrease in integral channel permeability of membrane for Na+ is crucial to cell shrinkage in apoptosis accompanied by a decrease in the sodium pump fluxes. This was seen in the severe apoptosis of U937 cells caused by 1 μm STS (4 h). No significant changes occurred in the integral channel permeability of membrane for K+ in these cells. On the other hand, mild apoptosis induced by 0.2 μm STS in cells of one of the cell strains studied was associated with an increase in integral channel permeability of membrane for K+ without change in the pump and the Na+ channels. Our calculations showed that the net Cl− flux through the channels in the cells we studied was small compared to the total flux measured by 36Cl−. This implies that the opposite active net Cl− flux due to cotransport was also small. This is why Cl− cotransport fluxes are difficult to reveal by inhibitors.
Finally, in view of the limited role of the Cl− and K+ channels in apoptotic cell shrinkage, and the abundant electrophysiological evidence for their involvement in apoptosis, we expect that there is a further role of electroconductive channels in apoptosis. This could be connected with monitoring of the membrane potential in some as yet unknown transient apoptotic processes.
Conclusions
(1) The integral decrease in the amount of intracellular osmolytes underlying apoptotic cell dehydration, by about 20%, is due to the loss of K+ and Cl− (56–72% of all osmolytes going out of the cell) and also some unidentified intracellular osmolytes (44–28%) and the gain of Na+, which counterbalances 20–25% of the (K++ Cl−) loss.
(2) The state of the cells after incubation with 1 μm STS for 4 h should be considered as almost balanced with respect to the Cl−, Na+ and K+ distributions. The values of PCl, PNa, PK and the NKCC and NC cotransport fluxes can be obtained by solving the flux balance equations if the cellular Cl− content and fluxes, the K+, Na+, water content and the ouabain-sensitive and -resistant Rb+ fluxes are known.
(3) The calculated values of PCl and NKCC and NC cotransport fluxes depend strongly on the portion of the coupled Cl−/Cl− exchange component in the Cl− fluxes. This component could not be measured for a balanced ion distribution. Useful conclusions can nevertheless be made by modelling ion homeostasis irrespective of the exchange component value. These conclusions are as follows: (1) balance of Cl−, Na+ and K+ fluxes can be accomplished in the model with NKCC cotransport at any share of the Cl−/Cl− exchange flux in the total measured Cl− flux, whereas flux balance in the model with NC is possible only if the sum of unidirectional Cl− cotransport and channel fluxes does not exceed a certain limit; (2) the values of PCl obtained for the NKCC and for the NC models given identical Cl− exchange are similar, and in the apoptotic cells they are equal to or lower than those in control cells.
(4) The value of PNa in apoptosis induced with 1 μm STS, which is accompanied by suppression of the pump, is lower than in normal cells by a factor of 2.5–3.0. In contrast, PNa in milder apoptosis induced by 0.2 μm STS with no pump suppression decreases only by about 10%, although the channel permeability of membrane for K+ increases significantly in this case. The fall in integral channel permeability of cell membrane for Na+ is crucial in preventing cell swelling during apoptosis accompanied by suppression of the pump.
(5) Direct influence of the monovalent ion channels on the cell water balance cannot explain all of the observed effects of monovalent ions in apoptosis. Involvement of these channels in monitoring of the membrane potential is likely, in some as yet unknown transient apoptotic processes.
Acknowledgments
We are grateful to Professor Florian Lang for thoughtful discussions and to Professor Andrey E. Vassilyev for valuable advice. This study was supported by the Russian Foundation for Basic Research, projects no. 09-04-00301a and by the Deutsche Forschungsgemeinschaft (436 RUS 113/488/0-2R, RFBR 06-04-04000).
Glossary
Abbreviations
- AVD
apoptotic volume decrease
- KCC
K+–Cl− cotransporter
- NC
Na+–Cl− cotransporter
- NKCC
Na+–K+–2Cl− cotransporter
- NMDG
N-methyl-d-glucamine
- NPPB
5-nitro-2-(3-phenylpropylamino) benzoic acid
- RVD
regulatory volume decrease
- RVI
regulatory volume increase
- STS
staurosporine
Appendix
A minimal cell model based on the known principles (Jakobsson, 1980; Lew & Bookchin, 1986; Hoffmann, 1987; Vereninov et al. 2004, 2006) is considered where Na+, K+ and Cl− net fluxes into and out of the cell are balanced due to parallel functioning of the Na+/K+ pump, electroconductive channels, and NKCC or NC cotransport. Equations (A1.1)–(A1.3) represent the flux balance (symbols are specified in Definitions)
 |
(A1.1) |
 |
(A1.2) |
 |
(A1.3) |
The first members in these equations are the net fluxes through the channels, where  ,
,  and
and  are integral channel permeability coefficients according to Goldman (1943).
  and
and  are Na+ efflux and K+ influx via the Na+/K+ pump connected by the relationship
  . The values
  and
and  are the influxes of Cl− due to NC and NKCC cotransport. (
 ) and (
 ) are the Cl− effluxes via cotransporters. It is assumed that
  and
and  are the simple functions of concentrations
| (A2.1) |
| (A2.2) |
The stoichiometry of the NKCC cotransporter is assumed to be 1:1:2 (see references in Russell, 2000). The term NC cotransporter is a functional definition. Actually, unidirectional Na+–Cl− cotransport with 1:1 stoichiometry may be performed by a single transport protein, like thiazide-sensitive Na+-Cl− cotransporter (Gamba, 2005), or by two functionally coupled exchangers, e.g. NHE and Cl−/HCO3− (Garcia-Soto & Grinstein, 1990; Hoffmann et al. 2009). Hence, following relationships between Cl−, Na+ and K+ cotransport influxes should be held
| (A2.3) |
Equation (A1.3) does not include Cl− influx and efflux mediated by one-for-one Cl− exchanger whereas the flux measured by 36Cl− includes this flux. The experimental separation of this flux is difficult and analysis of the flux balance was performed under different assumptions on the value of this flux. Therefore, the total unidirectional Cl− influx  via all pathways of eqn (A1.3) is introduced below for using as independent variable.
| (A3) |
When the model includes only NC cotransport the influx  and
and  are connected with
  and the membrane potential u by the expressions
| (A4) |
| (A5) |
where φCl is the dimensionless Cl− equilibrium potential,  .
.
When the model includes only NKCC cotransport the analogous expressions for  and
and  are held
| (A6) |
| (A7) |
An important point is the determination of the membrane potential u. It can be done according to the Ussing theory provided that Rb+ efflux and influx through channels and equilibrium potential φRb are known (Ussing, 1949; Lambert et al. 1989)
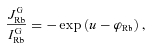 |
(A8) |
where  . The concentration [Rb]i is connected with [K]i by proportion [Rb]i=[K]i[Rb]o/[K]o. The influx IRb via the NKCC cotransporter can be expressed as {0.5
 ([Rb]o/[K]o)}. The Rb+ influx
  and efflux
  through the K+ channels can be expressed as
| (A9) |
| (A10) |
where  is the total measured Rb+ influx. From eqns (A8)–(A10) follows
 |
(A11) |
After transferring  from eqn (A6) into eqn (A11) the latter is transformed to an equation of second power, where exp(u) is a single unknown variable. The solution of eqn (A11) is simplified in case of the model with NC.
 |
(A12) |
When u is found, the values  and
and  can be obtained by using eqns (A4) and (A6). The channel Cl− influx
  and efflux
  are calculated as
| (A13) |
| (A14) |
The permeability coefficients  ,
,  and
and  are calculated from eqns (A1.1) and (A1.2) provided that potential u and influxes due to cotransport are known:
 |
(A15) |
 |
(A16) |
 |
(A17) |
The upper limit for  in the model with NC cotransport can be obtained from the relationship
  . In view of eqn (A1.1) the upper limit for INC can be calculated as
  . Therefore,
| (A18) |
The dimensionless potential u0 is calculated by eqn (A12), as u0=U0F/RT, for 37°C, u0=U0/(26.7).
The  can be derived from eqn (A1.3) at
| (A19) |
Equation (A18) can be rewritten if chloride permeability from eqn (A19) is substituted
| (A20) |
Supplemental Table S1 can be used for easy calculating flux balance in any cells and in any circumstances provided that conditions specified by the model are observed.
Symbols and definitions
| Intracellular water and ion content | |
| Water | Cell water (determined in present study by buoyant density) (ml (g protein)−1) |
 |
Na+ content (determined in present study by flame photometry) (μmol (g protein)−1) |
 |
K+ content (determined in present study by flame photometry) (μmol (g protein)−1) |
| Cl− | Cl− content (determined in present study by the steady-state 36Cl− distribution, specific radioactivity of the extracellular medium and [Cl]o) (μmol (g protein)−1) |
| A | ‘Impermeant’ osmolytes in cell (μmol (g protein)−1) |
 . . |
|
| Concentration of ions (mM) | |
| [Na]i, [K]i, [Cl]i | Concentration of ions in cell water |
| [Rb]I | Intracellular Rb+ concentration under the balanced state, [Rb]i=[K]i[Rb]o/[K]o |
| [Na]o, [K]o, [Cl]o, [Rb]o | Concentration of ions in extracellular medium |
| Potentials | |
| u | Membrane potential (dimensionless) (eqn (A11)) |
| U | Membrane potential U=uRT/F; for 37°C U = 26.7u (mV) |
| U0 | Membrane potential when NKCC is absent (mV) (eqn (A12)) |
 |
‘Equilibrium’ potential for K+(Rb+),  (dimensionless) (dimensionless) |
 |
‘Equilibrium’ potential for Cl−,  (dimensionless) (dimensionless) |
| Kinetic coefficients of ion Cl− exchange and integral channel permeability | |
| k | Rate constant of the total Cl− exchange (determined by 36Cl−) (min−1) |
| PNa, PK, PCl | Coefficient of integral channel permeability of membrane for Na+, K+ and Cl− (ml min−1 (g protein)−1) (eqns (A15)–(A17)) |
| Fluxes (μmol min−1 (g protein)−1) | |
 |
Total Cl− influx ≡ efflux determined by the kinetic of 36Cl− uptake or release under the balanced distribution of Cl−, 
|
 |
Flux related to the one-for-one Cl− exchanger |
 |
Difference between the measured Cl− flux and the flux related to the one-for-one Cl− exchanger, 
|
 |
Cl− influx through electroconductive Cl− channels (eqn (A13)) |
 |
Cl− efflux through electroconductive Cl− channels (eqn (A14)) |
 |
Cl− influx via NKCC pathway (eqn (A6)) |
 |
Cl− efflux via NKCC pathway, 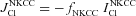
|
 |
Half the Cl− influx and the whole Na+ or K+ influxes via NKCC pathway |
 |
Half the Cl− efflux and the whole Na+ or K+ effluxes via NKCC pathway, |
 |
|
 |
Influx Na+ and Cl− via NC cotransport  = = , calculated by eqn (A4) , calculated by eqn (A4)
|
 |
Efflux of Na+ and Cl− via NC cotransport, 
|
 |
‘Pump’ Na+ efflux, 
|
 |
‘Pump’ K+ influx |
 |
Total Rb+ influx estimated by Rb+ flame photometry |
 |
Ouabain-resistant Rb+ influx in the presence of ouabain |
 |
Ouabain sensitive, the ‘pump’ Rb+ influx, 
|
 |
Rb+ influx through channels |
 |
Rb+ efflux through channels |
 |
Ratio between efflux and influx via cotransporters NKCC or, respectively, NC (eqns (A2.1) and (A2.2)) |
Author contributions
All authors contributed equally to this work and all approved the final version.
Supplementary material
Supplemental Table S1
As a service to our authors and readers, this journal provides supporting information supplied by the authors. Such materials are peer-reviewed and may be re-organized for online delivery, but are not copy-edited or typeset. Technical support issues arising from supporting information (other than missing files) should be addressed to the authors
References
- Arrebola F, Cañizares J, Cubero MA, Crespo PV, Warley A, Fernández-Segura E. Biphasic behavior of changes in elemental composition during staurosporine-induced apoptosis. Apoptosis. 2005a;10:1317–1331. doi: 10.1007/s10495-005-2718-x. [DOI] [PubMed] [Google Scholar]
- Arrebola F, Zabiti S, Cañizares FJ, Cubero MA, Crespo PV, Fernández-Segura E. Changes in intracellular sodium, chlorine, and potassium concentrations in staurosporine-induced apoptosis. J Cell Physiol. 2005b;204:500–507. doi: 10.1002/jcp.20306. [DOI] [PubMed] [Google Scholar]
- Arrebola F, Fernández-Segura E, Campos A, Crespo PV, Skepper JN, Warley A. Changes in intracellular electrolyte concentrations during apoptosis induced by UV irradiation of human myeloblastic cells. Am J Physiol Cell Physiol. 2006;290:C638–C649. doi: 10.1152/ajpcell.00364.2005. [DOI] [PubMed] [Google Scholar]
- Aull F, Nachbar MS, Oppenheim JD. Chloride self exchange in Ehrlich ascites cells. Biochim Biophys Acta. 1977;471:341–347. doi: 10.1016/0005-2736(77)90040-2. [DOI] [PubMed] [Google Scholar]
- Bortner CD, Cidlowski JA. Cell shrinkage and monovalent cation fluxes: role in apoptosis. Arch Biochem Biophys. 2007;462:176–188. doi: 10.1016/j.abb.2007.01.020. [DOI] [PMC free article] [PubMed] [Google Scholar]
- Bortner CD, Gomez-Angelats M, Cidlowski JA. Plasma membrane depolarization without repolarization is an early molecular event in anti-Fas-induced apoptosis. J Biol Chem. 2001;276:4304–4314. doi: 10.1074/jbc.M005171200. [DOI] [PubMed] [Google Scholar]
- Burg ED, Remillard CV, Yuan JX. K+ channels in apoptosis. J Membr Biol. 2006;209:3–20. doi: 10.1007/s00232-005-0838-4. [DOI] [PubMed] [Google Scholar]
- D'Anglemont de Tassigny A, Souktani R, Henry P, Ghaleh B, Berdeaux A. Volume-sensitive chloride channels (ICl,vol) mediate doxorubicin-induced apoptosis through apoptotic volume decrease in cardiomyocytes. Fundam Clin Pharmacol. 2004;18:531–538. doi: 10.1111/j.1472-8206.2004.00273.x. [DOI] [PubMed] [Google Scholar]
- Drummond GB. Reporting ethical matters in The Journal of Physiology: standards and advice. J Physiol. 2006;587:713–719. doi: 10.1113/jphysiol.2008.167387. [DOI] [PMC free article] [PubMed] [Google Scholar]
- Fernández-Segura E, Cañizares FJ, Cubero MA, Warley A, Campos A. Changes in elemental content during apoptotic cell death studied by electron probe X-ray microanalysis. Exp Cell Res. 1999;253:454–462. doi: 10.1006/excr.1999.4657. [DOI] [PubMed] [Google Scholar]
- Franco R, Bortner CD, Cidlowski JA. Potential roles of electrogenic ion transport and plasma membrane depolarization in apoptosis. J Membr Biol. 2006;209:43–58. doi: 10.1007/s00232-005-0837-5. [DOI] [PubMed] [Google Scholar]
- Gamba G. Molecular physiology and pathophysiology of electroneutral cation-chloride cotransporters. Physiol Rev. 2005;85:423–493. doi: 10.1152/physrev.00011.2004. [DOI] [PubMed] [Google Scholar]
- Garcia-Soto JJ, Grinstein S. Determination of the transmembrane distribution of chloride in rat lymphocytes: role of Cl−-HCO3− exchange. Am J PhysiolCell Physiol. 1990;258:C1108–C1116. doi: 10.1152/ajpcell.1990.258.6.C1108. [DOI] [PubMed] [Google Scholar]
- Goldman D. Potential, impedance and rectification in membranes. J Gen Physiol. 1943;27:37–60. doi: 10.1085/jgp.27.1.37. [DOI] [PMC free article] [PubMed] [Google Scholar]
- Hoffmann EK. Anion exchange and anion-cation co-transport systems in mammalian cells. Philos Trans R Soc Lond B. 1982;299:519–535. doi: 10.1098/rstb.1982.0149. [DOI] [PubMed] [Google Scholar]
- Hoffmann EK. Volume regulation in cultured cells. In: Kleinzeller A, editor. Cell Volume Control: Fundamental and Comparative Aspects in Animal Cells. New York: Academic Press; 1987. pp. 125–180. [Google Scholar]
- Hoffmann EK. The pump and leak steady-state concept with a variety of regulated leak pathways. J Membr Biol. 2001;184:321–330. doi: 10.1007/s00232-001-0102-5. [DOI] [PubMed] [Google Scholar]
- Hoffmann EK, Lambert IH, Pedersen SF. Physiology of cell volume regulation in vertebrates. Physiol Rev. 2009;89:193–277. doi: 10.1152/physrev.00037.2007. [DOI] [PubMed] [Google Scholar]
- Hoffmann EK, Simonsen LO, Sjoholm C. Membrane potential, chloride exchange, and chloride conductance in Ehrlich mouse ascites tumour cells. J Physiol. 1979;296:61–84. doi: 10.1113/jphysiol.1979.sp012991. [DOI] [PMC free article] [PubMed] [Google Scholar]
- Ise T, Shimizu T, Lee EL, Inoue H, Kohno K, Okada Y. Roles of volume-sensitive Cl− channel in cisplatin-induced apoptosis in human epidermoid cancer cells. J Membr Biol. 2005;205:139–145. doi: 10.1007/s00232-005-0779-y. [DOI] [PubMed] [Google Scholar]
- Jakobsson E. Interactions of cell volume, membrane potential, and membrane transport parameters. Am J Physiol Cell Physiol. 1980;238:C196–C206. doi: 10.1152/ajpcell.1980.238.5.C196. [DOI] [PubMed] [Google Scholar]
- Kerr JF. Shrinkage necrosis: a distinct mode of cellular death. J Pathol. 1971;105:13– 20. doi: 10.1002/path.1711050103. [DOI] [PubMed] [Google Scholar]
- Ladoux A, Krawice I, Cragoe EJ, Abita JP, Frelin C. Properties of the Na+-dependent Cl−/HCO3− exchange system in U937 human leukemic cells. Eur J Biochem. 1987;170:43–49. doi: 10.1111/j.1432-1033.1987.tb13665.x. [DOI] [PubMed] [Google Scholar]
- Lambert IH, Hoffmann EK, Jorgensen F. Membrane potential, anion and cation conductances in Ehrlich ascites tumor cells. J Membr Biol. 1989;111:113–131. doi: 10.1007/BF01871776. [DOI] [PubMed] [Google Scholar]
- Lambert IH, Hoffmann EK, Pedersen SF. Cell volume regulation: physiology and pathophysiology. Acta Physiol. 2008;194:255–282. doi: 10.1111/j.1748-1716.2008.01910.x. [DOI] [PubMed] [Google Scholar]
- Lang F, Föller M, Lang K, Lang P, Ritter M, Vereninov A, Szabo I, Huber SM, Gulbins E. Cell volume regulatory ion channels in cell proliferation and cell death. Methods Enzymol. 2007;428:209–225. doi: 10.1016/S0076-6879(07)28011-5. [DOI] [PubMed] [Google Scholar]
- Lang F, Gulbins E, Szabo I, Vereninov A, Huber SM. Ion channels, cell volume, cell proliferation and apoptotic cell death. In: Martinac B, editor. Sensing with Ion Channels. Berlin, Heidelberg: Springer Verlag; 2008. pp. 69–84. [Google Scholar]
- Lang F, Shumilina E, Ritter M, Gulbins E, Vereninov A, Huber SM. Ion channels and cell volume in regulation of cell proliferation and apoptotic cell death. Contrib Nephrol. 2006;152:142–160. doi: 10.1159/000096321. [DOI] [PubMed] [Google Scholar]
- Levinson C. Sodium-dependent ion cotransport in steady state Ehrlich ascites tumor cells. J Membr Biol. 1985;87:121–130. doi: 10.1007/BF01870658. [DOI] [PubMed] [Google Scholar]
- Lew VL, Bookchin RM. Volume, pH, and ion-content regulation in human red cells: analysis of transient behavior with an integrated model. J Membr Biol. 1986;92:57–74. doi: 10.1007/BF01869016. [DOI] [PubMed] [Google Scholar]
- Maeno E, Ishizaki Y, Kanaseki T, Hazama A, Okada Y. Normotonic cell shrinkage because of disordered volume regulation is an early prerequisite to apoptosis. Proc Natl Acad Sci U S A. 2000;97:9487–9492. doi: 10.1073/pnas.140216197. [DOI] [PMC free article] [PubMed] [Google Scholar]
- Maeno E, Shimizu T, Okada Y. Normotonic cell shrinkage induces apoptosis under extracellular low Cl− conditions in human lymphoid and epithelial cells. Acta Physiol. 2006;187:217–222. doi: 10.1111/j.1748-1716.2006.01554.x. [DOI] [PubMed] [Google Scholar]
- Nobel CS, Aronson JK, Van Den Dobbelsteen DJ, Slater AF. Inhibition of Na+/K+-ATPase may be one mechanism contributing to potassium efflux and cell shrinkage in CD95-induced apoptosis. Apoptosis. 2000;5:153–163. doi: 10.1023/a:1009684713784. [DOI] [PubMed] [Google Scholar]
- Okada Y, Maeno E. Apoptosis, cell volume regulation and volume-regulatory chloride channels. Comp Biochem Physiol A Mol Integr Physiol. 2001;130:377–383. doi: 10.1016/s1095-6433(01)00424-x. [DOI] [PubMed] [Google Scholar]
- Okada Y, Sato K, Numata T. Pathophysiology and puzzles of the volume-sensitive outwardly rectifying anion channel. J Physiol. 2009;587:2141–2149. doi: 10.1113/jphysiol.2008.165076. [DOI] [PMC free article] [PubMed] [Google Scholar]
- Okada Y, Shimizu T, Maeno E, Tanabe S, Wang X, Takahashi N. Volume-sensitive chloride channels involved in apoptotic volume decrease and cell death. J Membr Biol. 2006;209:21–29. doi: 10.1007/s00232-005-0836-6. [DOI] [PubMed] [Google Scholar]
- Ouadid-Ahidouch H, Roudbaraki M, Delcourt P, Ahidouch A, Joury N, Prevarskaya N. Functional and molecular identification of intermediate-conductance Ca2+-activated K+ channels in breast cancer cells: association with cell cycle progression. Am J Physiol Cell Physiol. 2004;287:C125–C134. doi: 10.1152/ajpcell.00488.2003. [DOI] [PubMed] [Google Scholar]
- Poulsen KA, Andersen ES, Hansen CF, Klausen TK, Hougaard C, Lambert IH, Hoffmann EK. Deregulation of apoptotic volume decrease and ionic movements in multidrug-resistant tumor cells: role of chloride channels. Am J Physiol Cell Physiol. 2010;298:C14–C25. doi: 10.1152/ajpcell.00654.2008. [DOI] [PubMed] [Google Scholar]
- Rubashkin AA, Yurinskaya VE, Vereninov AA. Calculations of K+, Na+ and Cl− fluxes across cell membrane with Na+/K+ pump, NKCC, NC cotransport and ionic channels with non-Goldman rectification in K+ channels: normal and apoptotic cells (in Russian) Tsitologiya. 2010;52:568–573. in English: Cell and Tissue Biol. 4, 464–470. [PubMed] [Google Scholar]
- Russell JM. Sodium-potassium-chloride cotransport. Physiol Rev. 2000;80:211–276. doi: 10.1152/physrev.2000.80.1.211. [DOI] [PubMed] [Google Scholar]
- Simchowitz L, De Weer P. Chloride movements in human neutrophils diffusion, exchange, and active transport. J Gen Physiol. 1986;88:167–194. doi: 10.1085/jgp.88.2.167. [DOI] [PMC free article] [PubMed] [Google Scholar]
- Simchowitz L, Ratzlaff R, De Weer P. Anion/anion exchange in human neutrophils. J Gen Physiol. 1986;88:195–217. doi: 10.1085/jgp.88.2.195. [DOI] [PMC free article] [PubMed] [Google Scholar]
- Skepper JN, Karydis I, Garnett MR, Hegyi L, Hardwick SJ, Warley A, Mitchinson MJ, Cary NR. Changes in elemental concentrations are associated with early stages of apoptosis in human monocyte-macrophages exposed to oxidized low-density lipoprotein: an X-ray microanalytical study. J Pathol. 1999;188:100–106. doi: 10.1002/(SICI)1096-9896(199905)188:1<100::AID-PATH306>3.0.CO;2-O. [DOI] [PubMed] [Google Scholar]
- Ussing HH. The distinction by means of tracers between active transport and diffusion. Acta Physiol Scand. 1949;19:43–56. [Google Scholar]
- Vereninov AA, Goryachaya TS, Moshkov AV, Vassilieva IO, Yurinskaya VE, Lang F, Rubashkin AA. Analysis of the monovalent ion fluxes in U937 cells under the balanced ion distribution: recognition of ion transporters responsible for changes in cell ion and water balance during apoptosis. Cell Biol Int. 2007;31:382–393. doi: 10.1016/j.cellbi.2007.01.023. [DOI] [PubMed] [Google Scholar]
- Vereninov AA, Rubashkin AA, Goryachaya TS, Moshkov AV, Rozanov YM, Shirokova AV, Strelkova EG, Lang F, Yurinskaya VE. Pump and channel K (Rb+) fluxes in apoptosis of human lymphoid cell line U937. Cell Physiol Biochem. 2008;22:187–194. doi: 10.1159/000149796. [DOI] [PubMed] [Google Scholar]
- Vereninov AA, Yurinskaya VE, Rubashkin AA. The role of potassium, potassium channels, and symporters in the apoptotic cell volume decrease: experiment and theory. Dokl Biol Sci. 2004;398:417–420. doi: 10.1023/b:dobs.0000046672.99148.fb. [DOI] [PubMed] [Google Scholar]
- Vereninov AA, Yurinskaya VE, Rubashkin AA. Apoptotic shrinkage of lymphoid cells: a model of changes in ion flux balance. Dokl Biochem Biophys. 2006;411:356–360. doi: 10.1134/s1607672906060093. [DOI] [PubMed] [Google Scholar]
- Wonderlin WF, Woodfork KA, Strobl JS. Changes in membrane potential during the progression of MCF-7 human mammary tumor cells through the cell cycle. J Cell Physiol. 1995;165:177–185. doi: 10.1002/jcp.1041650121. [DOI] [PubMed] [Google Scholar]
- Yurinskaya V, Goryachaya T, Guzhova I, Moshkov A, Rozanov Y, Sakuta G, Shirokova A, Shumilina E, Vassilieva I, Lang F, Vereninov A. Potassium and sodium balance in U937 cells during apoptosis with and without cell shrinkage. Cell Physiol Biochem. 2005a;16:155–162. doi: 10.1159/000089841. [DOI] [PubMed] [Google Scholar]
- Yurinskaya VE, Goryachaya TS, Rubashkin AA, Shirokova AV, Vereninov AA. Changes in K+, Na+, Cl− balance and K+, Cl− fluxes in U937 cells induced to apoptosis by staurosporine: on cell dehydration in apoptosis (in Russian) Tsitologiya. 2010;52:562–567. in English: Cell and Tissue Biol. 4, 457–463. [PubMed] [Google Scholar]
- Yurinskaya VE, Moshkov AV, Rozanov YM, Shirokova AV, Vassilieva IO, Shumilina EV, Lang F, Volgareva EV, Vereninov AA. Thymocyte K+, Na+ and water balance during dexamethasone- and etoposide-induced apoptosis. Cell Physiol Biochem. 2005b;16:15–22. doi: 10.1159/000087727. [DOI] [PubMed] [Google Scholar]
Associated Data
This section collects any data citations, data availability statements, or supplementary materials included in this article.