

The calcium-dependent activator proteins for secretion, CAPS1 and CAPS2, facilitate syntaxin opening during synaptic vesicle priming.
Abstract
Priming of large dense-core vesicles (LDCVs) is a Ca2+-dependent step by which LDCVs enter a release-ready pool, involving the formation of the soluble N-ethyl-maleimide sensitive fusion protein attachment protein (SNAP) receptor complex consisting of syntaxin, SNAP-25, and synaptobrevin. Using mice lacking both isoforms of the calcium-dependent activator protein for secretion (CAPS), we show that LDCV priming in adrenal chromaffin cells entails two distinct steps. CAPS is required for priming of the readily releasable LDCV pool and sustained secretion in the continued presence of high Ca2+ concentrations. Either CAPS1 or CAPS2 can rescue secretion in cells lacking both CAPS isoforms. Furthermore, the deficit in the readily releasable LDCV pool resulting from CAPS deletion is reversed by a constitutively open form of syntaxin but not by Munc13-1, a priming protein that facilitates the conversion of syntaxin to the open conformation. Our data indicate that CAPS functions downstream of Munc13s but also interacts functionally with Munc13s in the LDCV-priming process.
Introduction
In neuroendocrine cells and synaptic terminals, only a fraction of the secretory vesicles that are docked at the plasma membrane can be released upon stimulation, indicating that a maturation or priming step, which renders secretory vesicles fusion competent, must take place after docking (Parsons et al., 1995; Plattner et al., 1997). Interestingly, the pool of primed and fusion-competent vesicles is heterogeneous in many secretory systems (Bittner and Holz, 1992). In chromaffin cells, for example, high time resolution experiments revealed two populations of vesicles with different release rates, a readily releasable pool (RRP) and a slowly releasable pool (SRP), which produce two phases of release (Voets et al., 1999).
Several recent experiments showed that calcium-dependent activator protein for secretion (CAPS) proteins play a key role in the priming of large dense-core vesicles (LDCVs) and synaptic vesicles (SVs; Stevens and Rettig, 2009). CAPS1 was discovered as a cytosolic factor that is required for regulated fusion of LDCVs in PC12 cells (Walent et al., 1992). Subsequently, it was shown that CAPS1 is a homologue of the Caenorhabditis elegans protein UNC-31, whose mutation leads to an uncoordinated phenotype with motor deficits (Ann et al., 1997) and depresses release of SVs (Jockusch et al., 2007) and LDCVs (Elhamdani et al., 1999). Deletion of CAPS proteins causes a strong reduction in the size of the releasable pool of vesicles in several organisms (Renden et al., 2001; Speidel et al., 2005; Jockusch et al., 2007; Speese et al., 2007; Liu et al., 2008).
In mouse and human, there are two CAPS genes encoding isoforms that both contain a Munc13 homology domain (MHD; Speidel et al., 2003). This domain is part of the minimal structure required for the function of Munc13-1 (Basu et al., 2005; Madison et al., 2005; Stevens et al., 2005), a vesicle-priming protein in neurons (Tokumaru and Augustine, 1999) and neuroendocrine cells (Ashery et al., 2000). The sequence required for priming activity by Munc13-1 consists of a stretch of 672 amino acids, including both MHDs (Basu et al., 2005; Madison et al., 2005; Stevens et al., 2005), that has also been termed the MUN domain (Basu et al., 2005). Interestingly, an MUN domain–like structure has also been identified in CAPS (Koch et al., 2000; Hammarlund et al., 2008). In light of the role of the MUN domain in priming by Munc13s and the accumulating evidence that CAPSs also promote priming (Stevens and Rettig, 2009), an attractive hypothesis is that CAPSs carry out their priming function in a fashion similar to that of Munc-13s. Munc13-1 functions by binding to syntaxin (Betz et al., 1997; Richmond et al., 2001), promoting a conformational change in syntaxin that allows it to engage in SNARE complex formation (Dulubova et al., 1999).
In mouse chromaffin cells, deletion of CAPSs (double knockout [KO; DKO]) causes a reduction of the releasable LDCV pool and of sustained release (Liu et al., 2008), the latter of which occurs in the continued presence of elevated Ca2+ because vesicles that are primed are immediately released and, thus, is an indicator of vesicle priming. In addition, the loss of CAPS1 results in reduced transmitter loading into chromaffin granules (Speidel et al., 2005). Expression of CAPS1 in the KO background restores normal transmitter loading (Speidel et al., 2005) and secretion, increases the readily releasable LDCV pool, and enhances sustained release (Liu et al., 2008).
In this study, we show that both CAPS1 and CAPS2 facilitate LDCV priming and that open syntaxin can overcome the loss of CAPSs, indicating that CAPS function may indeed be similar to that of Munc13s. However, expression of Munc13-1 does not enhance priming in the absence of CAPS1, although its expression in the presence of CAPS1 leads to the expected enhancement of secretion. These results indicate that LDCV priming in mouse chromaffin cells involves the opening of the protein syntaxin and that opening of syntaxin is facilitated by CAPS. Both CAPS isoforms enhance priming activity and preferentially prime LDCVs of the RRP.
Results
CAPS2 restores secretion to wild-type levels in CAPS DKO chromaffin cells
Deletion of both CAPS genes in mouse chromaffin cells (CAPS DKO) causes an ∼50% decrease in exocytosis as a result of a strong (>50%) decrease in the size of the RRP and almost complete block of sustained release (Liu et al., 2008). We stimulated catecholamine secretion from mouse chromaffin cells using flash photolysis of caged calcium to examine the ability of virally expressed CAPS2 protein to restore secretion in mouse chromaffin cells lacking both CAPS1 and CAPS2. After UV flash illumination, secretion (as measured by a membrane capacitance change) occurred in an exocytotic burst consisting of an RRP and an SRP followed by a sustained release phase (Fig. 1). Expression of CAPS2 in chromaffin cells from CAPS DKO mice resulted in a strong enhancement of the exocytotic burst and of sustained release as compared with DKO cells (Fig. 1 A). By fitting the exocytotic burst as the sum of two exponentials and sustained release as a linear phase, we estimated the size of the RRP and SRP, their time constants, and the rate of sustained release. There was a significant increase in the RRP of DKO cells expressing CAPS2 (125.3 ± 25.8 fF; n = 24) compared with that of untreated DKO cells (42.8 ± 18.6 fF; n = 19; P < 0.001; Mann-Whitney U test) but no change in the release time constant of the RRP (CAPS2, 23.5 ± 5.2 ms; vs. DKO, 23.2 ± 1.4 ms). The amplitude of the SRP was not altered in CAPS2-expressing DKO cells (51.7 ± 12.2 fF; n = 24) when compared with DKO cells (51.8 ± 7.5 fF; n = 19). Sustained release, which was not measurable in DKO cells, was 19.2 ± 3.7 fF/s in the CAPS2-expressing DKO cells (Fig. 1 B). Thus, as is the case for CAPS1, expression of CAPS2 in CAPS DKO cells restores secretion with a selective effect on the RRP and the sustained release phase.
Figure 1.

CAPS2 restores secretion to wild-type levels in CAPS DKO cells. (A) Responses to flash photolysis of caged calcium in CAPS DKO cells (n = 19) and CAPS DKO cells expressing CAPS2 protein (n = 24). Upon elevation of intracellular calcium (top), the resulting change in membrane capacitance (middle) shows a clear enhancement in those cells expressing CAPS2. Carbon fiber amperometry verifies that the observed increase in capacitance is caused by an increase in (bottom) catecholamine release. (B) Analyses of the kinetics of the capacitance traces yield estimates of the releasable pools and the sustained release rate. The RRP was strongly enhanced by CAPS2 expression (***, P < 0.001), whereas the SRP was unaffected. The rate of sustained release in the period in which calcium remained elevated was also enhanced after CAPS2 expression (P < 0.001). (C) CAPS1 enhances secretion in wild-type (WT) cells. Overexpression of CAPS1 in wild-type chromaffin cells (n = 26) results in a modest enhancement of secretion as compared with untreated cells (n = 24). (D) A modest strengthening of the RRP of vesicles did not reach statistical significance. (E) CAPS2 expression enhances the exocytotic burst in wild-type mouse chromaffin cells. Responses to a calcium stimulus induced by flash photolysis of caged calcium (top) in CAPS2-expressing cells (n = 31) and wild-type chromaffin cells (n = 33) indicate that secretion is enhanced (middle), and this increase is mirrored by an increase in catecholamine release as indicated by amperometric detection (bottom). (F) There was a significant increase in the RRP (**, P < 0.01) as compared with that of untreated wild-type cells, with no difference in the SRP and a reduction in the sustained rate of release (P < 0.01). Error bars indicate mean ± SEM.
CAPS1 and CAPS2 overexpression increase the RRP size in wild-type chromaffin cells
We next tested how overexpression of CAPS1 in wild-type cells affects secretion. The results of this experiment are shown in Fig. 1 C. CAPS1 overexpression in wild-type chromaffin cells led to a modest enhancement of the exocytotic burst and sustained release after photolysis of caged Ca2+, neither of which was statistically significant. The RRP after CAPS1 overexpression in wild-type cells (n = 24) was 105 ± 16.1 fF as compared with 79 ± 13.8 fF in control cells (n = 26). The SRP sizes were 60.8 fF and 60.7 fF in CAPS1-expressing wild-type cells and control cells, respectively. The sustained release rate was slightly greater in CAPS1-expressing cells (26.1 ± 5.2 fF) than in control cells (19.1 ± 2.4 fF; Fig. 1 D).
We also tested whether overexpression of CAPS2 in wild-type cells would have a similar effect as CAPS1 on secretion. As shown in Fig. 1 E, introduction of CAPS2 in wild-type chromaffin cells resulted in a comparable, selective increase in the RRP. Although the RRP was enhanced (CAPS2 expression, 147.3 ± 18.4 fF [n = 31]; vs. control cells, 85.1 ± 8.1fF [n = 33]), the SRP was unchanged (76.2 ± 8.3 vs. 76.4 ± 10.0 fF), and the sustained release slightly decreased (27.1 ± 3.0 vs. 16.5 ± 2.0 fF; Fig.1, E and F). These results indicate that both CAPS1 and CAPS2 overexpression promote priming into the RRP in wild-type chromaffin cells.
Open syntaxin restores RRP in CAPS DKO cells to wild-type levels
In subsequent experiments, we tested whether expression of an open form of syntaxin (syntaxin1A L165A/E166A; Dulubova et al., 1999) can reverse the secretion deficit in CAPS DKO chromaffin cells (Fig. 2 A). Expression of open syntaxin in chromaffin cells from CAPS DKO mice led to strongly enhanced secretion (threefold increase) as compared with that of DKO cells. This enhancement was accounted for by an approximately threefold increase in the RRP size (open syntaxin–expressing DKO cells, 129.2 ± 21.8 fF [n = 24]; vs. CAPS DKO cells, 43.5 ± 8.9 fF [n = 23]; Fig. 2 B). There was also a modest increase in the SRP size in open syntaxin–expressing DKO cells (79.5 ± 11.3 fF) relative to untreated CAPS DKO cells (DKO, 52.3 ± 8.9 fF), but there was virtually no detectable sustained component in either group of cells. Application of a second flash after a 2-min recovery period resulted in a reduced open syntaxin response with a small RRP and no sustained component, whereas in the CAPS DKO cells, the response to the second flash was equivalent to the first response (Fig. 2, C and D). These findings are compatible with the view that the supply of primable vesicles is limited in the open syntaxin–expressing cells.
Figure 2.

Open syntaxin restores secretion in CAPS DKO cells to wild-type levels. (A) Responses to flash photolysis of caged calcium in CAPS DKO cells (n = 23) and CAPS DKO cells expressing open syntaxin (n = 24) show that open syntaxin restores secretion. The burst component of the capacitance response is much greater in the open syntaxin–expressing cells (middle), and the catecholamine release in amperometric recordings is also strongly enhanced (bottom). (B) Estimates of the releasable pools and the sustained rate indicate that open syntaxin strongly enhances the RRP (***, P < 0.001), although the SRP is also enhanced (this difference was not significant). Note that there is little sustained release after the burst. (C) Examination of a second flash stimulation to the same cells after a 2-min recovery period shows that open syntaxin–treated CAPS DKO cells recover poorly after flash stimulation. (D) Pool analysis shows that open syntaxin–expressing CAPS DKO cells recover more poorly and do not exhibit a greater RRP after a second flash. **, P < 0.01. Error bars indicate mean ± SEM.
Open syntaxin expression in CAPS DKO cells leads to rapid exhaustion of release
Stimulation of mouse chromaffin cells with a slowly rising calcium concentration (calcium ramp) leads to biphasic secretion, the late phase of which is likely the result of priming during the stimulus, i.e., analogous to the sustained release during flash photolysis (Sørensen et al., 2002). In CAPS DKO cells, the late phase of secretion is either very small or absent (Liu et al., 2008). We examined the effects of ramp stimulation in DKO cells in which open syntaxin was expressed. In agreement with the data obtained by flash stimulation (Fig. 2), open syntaxin–expressing DKO cells showed strongly enhanced secretion (295.5 ± 38.9 fF; n = 29) as compared with untreated DKO cells (72.2 ± 13.2 fF; n = 27; Fig. 3 A). Secretion during ramp stimulation started slowly, so we used the second derivative of the capacitance trace to more accurately determine the increase in slope at the beginning of the secretory phase. The Ca2+ value at the time of a peak in the second derivative of the smoothed capacitance trace (Schonn et al., 2008), taken as the threshold Ca2+ concentration required for secretion, was ∼850 nM in both DKO and open syntaxin–expressing DKO cells. Both the response of DKO cells and that of the open syntaxin–expressing DKO cells were sigmoid. In spite of the greater secretion in the open syntaxin–expressing DKO cells (or perhaps as a result of this), secretion of the open syntaxin–expressing cells reached a plateau before the end of the stimulation. This was not the case in the DKO cells, which secreted throughout the stimulation.
Figure 3.

The releasable pools in CAPS DKO cells expressing open syntaxin are rapidly exhausted. (A) The free calcium concentration (top) and the capacitance change (bottom) are shown. Those cells expressing open syntaxin exhibit very strong secretion (n = 29) compared with CAPS DKO cells not expressing open syntaxin (n = 27). (B) To determine the amount of secretion remaining after the calcium ramp stimulation, a flash was applied 3 s after the ramp ended to increase calcium to high levels. The residual secretion in the CAPS DKO cells was larger than that of the DKO cells expressing open syntaxin and accounted for ∼65% of the total secretion, whereas the flash response in the open syntaxin–expressing CAPS DKO cells accounted for ∼25% of the total secretion. Error bars indicate mean ± SEM.
We tested the residual secretory capacity that remains after the ramp stimulus by applying a flash 3 s after the end of the ramp stimulus. The DKO cells secreted slightly more in response to the postramp flash (131.0 ± 31.7 fF; n = 22) than did the open syntaxin–expressing DKO cells (98.3 ± 24.9 fF; n = 23; Fig. 3 B). The secretion induced by the flash was equivalent to ∼65% of the total secretion in the DKO cells and to ∼25% of the total secretion in the open syntaxin–expressing DKO cells. Thus, in the open syntaxin–expressing DKO cells, ∼75% of the secretory capacity was released during the ramp stimulation, whereas only 35% of the secretory capacity was released by the ramp stimulation in the DKO cells. The kinetics of release after the flash stimulation were slow and similar in both groups, indicating that residual release originated from an SRP of vesicles. Total secretion was much greater in the open syntaxin–expressing DKO cells in these ramp stimulation experiments, as was the case in the original flash experiments. Thus, open syntaxin bypasses the requirement for CAPS and generates a large pool of releasable vesicles.
Chromaffin cells from mutant mice that only express open syntaxin are characterized by a large reduction in the number of morphologically docked vesicles (Gerber et al., 2008). The lack of sustained release and the apparent fast exhaustion of release that we observed in chromaffin cells expressing open syntaxin might therefore be because of a reduction in vesicle docking rather than to effects on priming. To test this, we expressed open syntaxin in wild-type cells (Fig. 4 A). Open syntaxin expression led to an approximately twofold increase in the RRP size (209.3 ± 26.0 fF; n = 24) relative to untreated wild-type cells (95.8 ± 9.4 fF; n = 22) and enhanced the SRP size, although this effect was not statistically significant (open syntaxin–expressing wild-type cells,146.6 ± 25.3 fF; vs. untreated wild-type cells, 101.7 ± 14 fF) but reduced the sustained phase (open syntaxin–expressing wild-type cells, 4.6 ± 2.1 fF/s; vs. untreated wild-type cells, 22.5 ± 3.8 fF; Fig. 4 B).
Figure 4.

Expression of open syntaxin in wild-type cells enhances the RRP selectively. (A) Flash photolysis of caged calcium produces a larger burst of secretion in open syntaxin–expressing wild-type (WT) cells (n = 24) when compared with cells not expressing open syntaxin (n = 22). This is mirrored in an increase in catecholamine release. (B) Analysis of the kinetics of the releasable pools and the rate of sustained release show that the RRP is strongly enhanced (**, P < 0.01), whereas the SRP is unaltered. The sustained release is reduced (***, P < 0.001). (C) Examination of the second flash response after a 2-min recovery period shows a deficit in refilling pools emptied by a flash stimulation in open syntaxin–expressing wild-type cells. (D) Analysis of pools in the responses to the second stimulation. Error bars indicate mean ± SEM.
As in CAPS DKO cells, wild-type cells expressing open syntaxin recovered from stimulation poorly, as illustrated by reductions of all phases of release in the responses to a second flash stimulation (Fig. 4 C). In the responses to a second flash, the RRP size was 104.6 ± 18.9 fF in open syntaxin–expressing wild-type cells (n = 20) versus 136.8 ± 21.5 fF in untreated wild-type cells (n = 18). The SRP was 56.3 ± 10.5 fF in open syntaxin–expressing wild-type cells versus 99.8 ± 13.0 fF in untreated wild-type cells. Sustained release was 1.6 ± 1.0 fF/s in open syntaxin–expressing cells and 11.4 ± 2.5 fF/s in untreated cells (Fig. 4 D). The reduction of sustained release is thus independent of CAPS function. These experiments indicate that open syntaxin promotes priming into the RRP but simultaneously reduces sustained release and pool recovery, possibly because of a reduction in the number of docked vesicles.
Open syntaxin expression leads to reduced LDCV docking
We next analyzed the distribution of LDCVs in chromaffin cells to determine whether open syntaxin causes a docking defect such as the one reported for mutant mice expressing only open syntaxin (Gerber et al., 2008). We compared the distributions of LDCVs in untreated chromaffin cells from wild-type (n = 21) and CAPS DKO cells (n = 16) to those in wild-type cells after expression of open syntaxin (n = 10) and in CAPS DKO after expression of open syntaxin (n = 7). We determined the shortest distance from the plasma membrane of all identifiable LDCVs in chromaffin cells derived from wild-type or CAPS DKO embryonic day (E) 18/postnatal day (P) 0 mice either with or without expression of open syntaxin. Representative micrographs are shown in Fig. 5 (A–D). The distributions of measured distances (Fig. 5 E) showed a clear reduction in the fraction of LDCVs in close apposition to the membrane in open syntaxin–overexpressing CAPS DKO (62% reduction) and wild-type cells (77% reduction), as compared with untreated cells of CAPS DKO and wild-type mice. We conclude from these data that the reduction in sustained release by expression of open syntaxin is the result of a reduction in the transport of LDCVs to the plasma membrane, i.e., docking.
Figure 5.

Open syntaxin expression reduces the numbers of docked vesicles in chromaffin cells. (A and B) Representative electron micrographs of chromaffin cells from wild-type (WT) and CAPS DKO mice are shown. N, nucleus; M, mitochondria. (C and D) Representative electron micrographs of chromaffin cells from wild-type and CAPS DKO mice 6 h after pSFV1-syntaxinL165A/E166A-IRES-GFP infection are shown. (A–D) Bars, 2 µm. (E) Relative frequency distribution of the granule distances from the plasma membrane in chromaffin cells from CAPS DKO (n = 16) and wild-type mice (n = 21) and CAPS DKO with open syntaxin expression (n = 7) and wild-type with open syntaxin expression (n = 10). Although there was no difference in docked vesicles in CAPS DKO cells compared with wild-type cells, expression of open syntaxin led to a strong reduction in LDCVs adjacent to the membrane in both populations. Bin width was 60 nm. Error bars indicate mean ± SEM. (F) High magnification inset taken from the boxed region in A. Dashed line shows the distance of 60 nm from the plasma membrane that was taken to define docked vesicles. Bar, 200 nm.
Munc13-1 does not restore secretion in CAPS DKO cells
The results of expressing open syntaxin indicate that LDCV priming is facilitated by opening of syntaxin, thus enabling syntaxin to engage in SNARE complex formation. The MHD domain of CAPS may be involved in the conformational change of syntaxin required for priming, as is believed to be the case for the MHD domains of Munc13s (Basu et al., 2005; Madison et al., 2005; Stevens et al., 2005). If this were indeed the case, secretion in chromaffin cells from CAPS DKO mice should also be restored by expression of Munc13-1. Surprisingly, but in agreement with data in cultured hippocampal neurons (Jockusch et al., 2007), expression of a full-length Munc13-1–GFP construct in CAPS DKO cells failed to restore secretion (Fig. 6 A). Unexpectedly, all phases of flash-induced secretion in DKO cells expressing Munc13-1 (RRP, 31.1 ± 8.5 fF; SRP, 24.7 ± 5.6 fF; sustained, 1.9 ± 1.0 fF/s; n = 23) were reduced compared with untreated DKO cells (RRP, 48.4 ± 12.8 fF; SRP, 58.1 ± 10.0 fF; sustained, 2.9 ± 1.6 fF/s; n = 22; Fig. 6 B). We also tested whether expression of a truncated construct of Munc13-1 containing the minimal priming domain (Stevens et al., 2005) can rescue secretion in CAPS DKO cells, but expression of this construct also failed to restore secretion in CAPS DKO cells, although it enhanced secretion in wild-type mouse chromaffin cells (unpublished data).
Figure 6.

Expression of Munc13-1 does not enhance secretion in CAPS DKO chromaffin cells. (A) The free calcium (top), capacitance changes (middle), and amperometric recordings (bottom) in CAPS DKO cells (n = 22) and CAPS DKO cells expressing Munc13-1 (n = 23) are shown. Munc 13–1 expression did not restore release in CAPS DKO cells. (B) Estimates of the kinetic parameters show that all phases of release were suppressed in cells expressing Munc13-1. (C) Munc13-1 overexpression in cells heterozygous for CAPS1 (CAPS1+/− CAPS2−/−) has the expected enhancing effect on secretion. Secretion was enhanced in CAPS1 heterozygotes expressing Munc13-1 (n = 25) when compared with CAPS1 heterozygotes not expressing Munc13-1 (n = 23). (D) Analysis of the kinetics of capacitance responses shows that Munc13-1 enhances the RRP (**, P < 0.01), SRP (***, P < 0.001), and sustained release (P < 0.001) in the response in CAPS1-expressing chromaffin cells. Error bars indicate mean ± SEM.
Munc13-1 enhances secretion only in the presence of CAPS1
Munc13-1 expression strongly enhances secretion in wild-type mouse chromaffin cells (Stevens et al., 2005) but reduces secretion in CAPS DKO cells (Fig. 6, A and B). In view of this discrepancy, we tested whether the lack of a positive Munc13-1 effect on secretion seen in CAPS DKO cells might be directly related to the lack of CAPS. We first examined the ability of Munc13-1 to enhance secretion in cells from CAPS1+/− CAPS2−/− mice (Fig. 6 C). In these cells, Munc13-1 expression (n = 25) enhanced all phases of secretion significantly when compared with untreated cells (n = 23). For CAPS1+/− CAPS2−/− cells expressing Munc13-1, the RRP was 281.5 ± 39.9 fF, the SRP was 278.3 ± 44.0 fF, and the sustained release was 50.7 ± 7.2 fF/s. In untreated CAPS1+/− CAPS2−/− cells, the RRP was 145.8 ± 19 fF, the SRP was 82.5 ± 10.0 fF, and the sustained release was 20.0 ± 3.3 fF/s (Fig. 6 D).
Strikingly, when we examined the effect of Munc13-1 expression in cells from CAPS1−/− CAPS2+/− mice, we found that Munc13-1 expression (n = 23) not only failed to increase secretion, but even decreased it (Fig. 7 A) relative to untreated cells (n = 22), as was the case in the DKO cells (Fig. 6, A and B). The RRP of CAPS1−/− CAPS2+/− cells expressing Munc13-1 was 72.8 ± 16.6 fF, whereas in untreated CAPS1−/− CAPS2+/− cells, the RRP was 98.8 ± 12.4 fF. The SRP of Munc13-1–expressing CAPS1−/− CAPS2+/− cells was 33.8 ± 5.7 fF and that of untreated cells was 50.3 ± 7.5 fF, whereas the sustained release in Munc13-1–expressing CAPS1−/− CAPS2+/− cells was 6.3 ± 2.2 fF/s and that in untreated CAPS1−/− CAPS2+/− cells was 9.2 ± 2.4 fF/s (Fig. 7 B). In contrast, expression of Munc13-1 in wild-type (n = 15) cells resulted in the expected robust enhancement of all phases of secretion as compared with wild-type controls (n = 12; Fig. 7 C). Thus, it appears that Munc13-1 requires CAPS1 to promote secretion in chromaffin cells, indicating that the two proteins interact functionally in the process of chromaffin granule priming.
Figure 7.

The priming effect of Munc13-1 requires the presence of CAPS1 but not of CAPS2. (A) Responses to flash photolysis in CAPS1 deletion cells having one functional CAPS2 allele. Munc13-1–expressing cells (n = 23), in spite of slightly higher resting calcium concentrations (top), secreted less than did cells from CAPS1−/− CAPS2+/− littermates (n = 22; middle). The catecholamine release results are consistent with the capacitance data (bottom). (B) The kinetic analysis of flash responses demonstrates that Munc13-1 did not enhance any component of the responses. (C) Summary of the results of expressing Munc13-1 in chromaffin cells from various CAPS deletion mice. In CAPS DKO and CAPS1−/− CAPS2+/− cells, Munc13-1 expression failed to enhance responses, whereas in CAPS1+/− CAPS2−/− and wild-type (WT) cells (C57Black6, not littermates), expression of Munc13-1 (n = 15) produced a robust enhancement of secretion versus untreated controls (n = 12). Error bars indicate mean ± SEM.
The CAPS effect on RRP does not explain the lack of sustained release
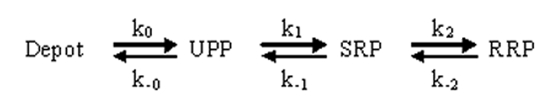
CAPS deletion reduces total secretion from chromaffin cells, with a strong reduction in the RRP of LDCVs. However, the effect on sustained release is much greater (Fig. 1; Speidel et al., 2005; Liu et al., 2008). The current model for LDCV maturation and release in chromaffin cells involves a linear path from a depot pool to a docked pool (unprimed pool [UPP]) followed by priming into the SRP and further maturation into the RRP (Sørensen, 2004).
Secretion from the SRP and RRP requires the appropriate Ca2+ stimulus. Manipulation of the rate constants k2 and k-2 will alter the balance between SRP and RRP and thus alter RRP size. Altering k1 or k-1 will change the numbers of primed vesicles at steady state without affecting the SRP/RRP ratio. We have performed numerical simulations of the vesicle pools and their release using the following scheme (see Materials and methods):
 |
(SCHEME 1) |
Using the constants suggested by Sørensen (2004), we solved the equations for steady-state pool size for UPP, SRP, and RRP and then solved the differential equations describing the changes in pool sizes, release rate, and release of vesicles (after a stepwise increase in [Ca2+]i to 10 µM) over time using a fourth-order Runge-Kutte integration.
Because priming is considered the step that delivers releasable vesicles, the k1 step would be equivalent to priming in a linear model. This step is calcium dependent, with a Kd for Ca2+ near 2.5 µM (Voets, 2000). This results in an increase in priming when basal [Ca2+]i changes at subthreshold concentrations (100 to ∼900 nM) and a strong increase in priming after flash photolysis, which causes the strong sustained release observed under these conditions. Increasing or decreasing k1 leads to an increase or decrease, respectively, in the size of the primed vesicle pool with no change in the SRP/RRP ratio (Ca2+ = 300 nM, k1 ∼0.003; Ca2+ = 600 nM, k1 ∼0.006; Fig. 8 A).
Figure 8.

Numerical simulations of priming and release indicate that CAPS alters the Ca2+-dependent enhancement of priming. (A) Simulated flash responses under conditions of moderate priming (300 nM free calcium; black) and high priming (600 nM free calcium; blue). Changing basal free calcium changes the basal priming rate, altering pool size with no effect on the relative sizes of the SRP and RRP or on sustained release. Enhancing the priming rate into the RRP at a moderate priming rate (basal calcium 300 nM; dashed line) enhances the RRP with no effect on sustained release. (B) The bar graph shows the RRP, the SRP, and the sustained rate under these conditions. (C) Decreasing the UPP (red) results in decreased pool size and sustained release. This decrease in pool size can be compensated by increasing the priming rate into the RRP (k2/k-2 ratio > 1), which increases the burst size but not the sustained rate. Note that sustained release is reduced proportionally to the reduction in docking. Sustained release is dependent on the calcium level after the flash. Removing the calcium-dependent enhancement of secretion reduces the sustained component (dashed line) and approximates the effect of CAPS deletion on sustained release. (D) The bar graphs illustrate the pool sizes and sustained rates under these conditions.
The slowly releasable vesicles then undergo an additional maturation step (k2), making them readily releasable. Decreasing k-2 or increasing k2 increases the RRP and the total number of primed vesicles, although leaving SRP virtually unchanged (Fig. 8 A, dashed line). This will not alter the sustained release rate, which depends only on UPP size and the rate constants k1 and k-1 (Fig. 8 B). A decrease in RRP priming would only decrease sustained release in a parallel scheme in which total priming is the sum of SRP and RRP priming. Such a scheme does not fit the results by Voets et al. (1999), which showed that refilling of the RRP is accompanied by a simultaneous SRP decrease of similar magnitude.
The effects on pool size of CAPS deletion and of CAPS rescue in the DKO background are readily simulated by a respective decrease or increase of the rate constant of priming (transfer) into the RRP (k2). The effects of open syntaxin expression on the releasable pools in both wild-type and DKO cells can be modeled in the same way. However, as discussed in the previous paragraph, this does not explain the observed lack of sustained release in CAPS DKO cells and cells overexpressing open syntaxin.
Because open syntaxin causes a docking deficit, we examined to what extent this might explain the lack of sustained release in our open syntaxin experiments (docking rate reduced to 45%). The ratio k1/k-1 combined with the UPP size controls overall priming rate, explaining why a depletion of the UPP will lead to lower sustained rates and smaller pool sizes (Fig. 8 C). The effect on pool size can be overcome by an increase in conversion from the SRP to the RRP (k2 is enhanced or k-2 is decreased; k2/k-2 > 1), which increases burst and RRP size.
Adding an increase in the rate constant for priming the RRP (k2) to the reduced forward docking rate (k0) produced a response in which the burst was larger, the RRP was enhanced relative to the SRP, the UPP was depleted, and the sustained rate was decreased (Fig. 8 C). Changes in the components are summarized in Fig. 8 D. However, if the UPP (docking) is normal, as in the case of the CAPS DKO, a loss of sustained release will require a stronger reduction in priming. This can be achieved by removing the enhancement of priming because of high calcium after the flash (Fig. 8 C, dashed line [the calcium-dependent increase in k1 was removed]) to achieve the observed deficit in sustained release. This change approaches the effect of CAPS deletion on sustained secretion we observed. If this loss of priming is preferentially affecting the RRP, the results will model the effects of CAPS loss.
Discussion
Our results show that CAPS2 promotes LDCV priming to the RRP in chromaffin cells (Fig. 1), as does CAPS1 (Liu et al., 2008), although there may be subtle functional differences between the two CAPS isoforms. The selective effect of CAPS deletion on the RRP is not compatible with a docking defect. This conclusion is supported by our modeling data (Fig. 8) and the present (Fig. 5) and previous analyses of LDCV distributions in CAPS KO chromaffin cells (Speidel et al., 2005; Liu et al., 2008).
The fact that the CAPS DKO phenotype can be rescued by expression of open syntaxin is consistent with the notion that CAPS and Munc13 proteins operate in the same molecular priming pathway (Richmond et al., 2001). Similarly, expression of open syntaxin rescues the locomotion and vesicle docking defects in C. elegans UNC-31 (CAPS) mutants (Zhou et al., 2007; Hammarlund et al., 2008), although rescue of the transmitter release defects caused by UNC-31 mutations was not tested in these studies. The effects of open syntaxin, although stronger in CAPS DKO cells, were also seen in wild-type cells (Fig. 4). The blockade of sustained release caused by the presence of open syntaxin is, to a large degree, likely because of the observed docking deficit (Fig. 5) that has been previously described in open syntaxin mutant mice (Gerber et al., 2008) and unrelated to CAPS function or dysfunction, as it occurs in wild-type and CAPS DKO chromaffin cells alike. Whether wild-type syntaxin overexpression could rescue the CAPS DKO phenotype in a similar fashion as open syntaxin could not be tested because expression of wild-type syntaxin requires the presence of about equal amounts of Munc18. Without the Munc18-induced conversion into a form that can be transported, as Rowe et al. (1999) stated, “syntaxin remains stuck in the Golgi-TGN area….leading to severe structural and membrane traffic alterations.” Because open syntaxin does not interact with Munc18, apparently this sorting problem does not exist for this mutant.
As open syntaxin rescues the UNC-13 and UNC-31 mutant phenotypes in C. elegans (Zhou et al., 2007; Hammarlund et al., 2008) and the effects on RRP size of CAPS DKO in chromaffin cells (Fig. 2), we reasoned that CAPSs and Munc13s are functionally related and tested whether overexpression of Munc13-1 can also rescue the priming deficits in the CAPS DKO chromaffin cells. This was not the case, although overexpression of Munc13-1 strongly enhanced secretion in cells with one functional CAPS1 allele remaining (Fig. 6). At present, we can only speculate about the molecular basis of the observed isoform specificity. Although the existence of two splice variants has been reported for CAPS1 (Ann et al., 1997), at least six splice variants exist for CAPS2 (Sadakata et al., 2007). Interestingly, three of these splice variants have alternative exons in the MHD domain, whereas the remaining three splice variants do not contain the MHD at all. It seems conceivable that only the isoforms without the MHD are expressed at the time point of our measurements (i.e., E18/P0). These splice variants are probably unable to bind syntaxin and, thus, cannot serve as a platform for Munc13 to act on. Further experiments with specific antibodies for the splice variants will be necessary to prove or refute this hypothesis.
The observation that exogenous Munc13-1 cannot boost priming in chromaffin cells in the absence of CAPS1 may indicate a functional interaction between CAPSs and Munc13s. Such an interaction has been suggested to occur in mouse hippocampal neurons (Jockusch et al., 2007), where overexpression of Munc13-1 failed to reverse deficits in synaptic transmission in CAPS DKO neurons. Interestingly, in C. elegans neurons, dense-core vesicle secretion, which is strongly CAPS dependent, is enhanced by phorbol esters, but only when CAPS is present (Zhou et al., 2007). Because Munc13-1 overexpression in chromaffin cells enhances the sizes of both SRP and RRP (Ashery et al., 2000), Munc13-1 may act upstream of CAPS by opening syntaxin, followed by CAPS binding to open syntaxin. Thus, a stabilized open syntaxin could bypass the need for Munc13 and CAPS. An interaction of CAPS with syntaxin has recently been reported (James et al., 2009) in a study showing that the fusogenic effect of CAPS in a SNARE complex–dependent liposome fusion assay is inhibited by a soluble syntaxin fragment and that CAPS binds to syntaxin-containing SNAREs and syntaxin alone. This function of CAPS appears to result in enhanced SNARE complex formation, which would be congruent with a model of combined Munc13/CAPS function.
Although numerous data have firmly established Munc13s as absolutely essential for priming of SVs in neurons (Augustin et al., 1999; Richmond et al., 1999), the inability of Munc13-1 to promote priming in the absence of CAPS1 (Figs. 6 and 7) in conjunction with the lack of a measurable secretion defect in Munc13-1 KO chromaffin cells (unpublished data) might indicate that Munc13-1 is not required for LDCV priming in chromaffin cells. The lack of rescue by the truncated Munc13-1 construct containing the minimal priming domain would then indicate that this conclusion is valid for all Munc13 isoforms expressed in adrenal chromaffin cells. Consequently, priming of LDCVs into the RRP might proceed constitutively but might be accelerated by Munc13s and other factors. In this scenario, CAPS would either promote priming into the RRP directly in a calcium-dependent manner or function in an alternative calcium-dependent priming pathway via the SRP to the RRP. A selective function at the RRP cannot explain CAPS effects on sustained release, as discussed in Results. Thus, an alternative CAPS-dependent priming pathway seems more likely. This priming pathway would be calcium dependent because a loss of the calcium-dependent enhancement of priming is the only manipulation that practically abolishes sustained release (Fig. 8) and must preferentially prime to the RRP. This would result in a CAPS-dependent RRP and CAPS-dependent sustained release, explaining the reduced RRP and sustained release in the CAPS DKO.
In conclusion, our data demonstrate that CAPS plays a facilitatory role in the second step of LDCV priming into the RRP in adrenal chromaffin cells. Thus, priming in adrenal chromaffin cells consists of a sequential two-step process.
Materials and methods
CAPS1 and CAPS2 KO mice were described previously (Speidel et al., 2005; Jockusch et al., 2007). CAPS DKO mice were generated by breeding the CAPS1 mutation into the CAPS2 mutant background. Genotypes were confirmed by PCR using primers as described previously (Speidel et al., 2005; Jockusch et al., 2007).
Chromaffin cell preparation and infection
All electrophysiological experiments were performed on mouse chromaffin cells in primary culture. The cells were prepared as previously described (Sørensen et al., 2002). In brief, the mice were prepared after hysterectomy on E18/E19. The adrenal glands were rapidly removed and placed in cold Locke’s solution. The glands were incubated for 20 min in a DME solution containing 20 U/ml papain (Roche). After the removal of the papain solution, the glands were washed in an inactivating solution (DME plus 10% BSA). After 4 min in the inactivating solution, the glands were triturated and cells were plated on glass coverslips. 30 min later, 3 ml DME was added to the wells containing the coverslips, and the cells were incubated for up to 4 d at 37°C in DME gassed with 8% CO2. For the CAPS rescue experiments, isolated chromaffin cells were infected with 50 µl activated pSFV1-CAPS1-IRES-GFP or pSFV1-CAPS2-IRES-GFP after a previously described protocol (Ashery et al., 1999, 2000). Open syntaxin was delivered via a pSFV1-syntaxinL165A/E166A-IRES-GFP. For Munc13-1 overexpression experiments, we used pSFV1–Munc13-1–GFP or pSFV1–Munc13-1–644-1735-GFP, which have been previously described (Stevens et al., 2005).
Patch clamp analysis and amperometry
Conventional whole cell recordings were performed with 4–6-MΩ pipettes and an EPC-9 patch clamp amplifier together with PULSE software (HEKA). For measurements from isolated chromaffin cells, the extracellular solution contained 145 mM NaCl, 2.4 mM KCl, 10 mM Hepes, 4.0 mM MgCl2, 1.0 mM CaCl2, and 10 mM glucose, pH 7.4. The intracellular solution for isolated cells contained 100 mM Cs-glutamate, 2 mM Mg-ATP, 0.3 mM Na2-GTP, 40 mM Cs-Hepes, 5 mM nitrophenyl-EGTA (NP-EGTA), 4 mM CaCl2, 0.4 mM furaptra, and 0.4 mM Fura-4F, pH 7.2. Capacitance measurements were performed using the Lindau-Neher technique implemented as the ‘sine+dc’ mode of the ‘software lock-in’ extension of PULSE software. A 1-kHz, 70-mV peak to peak sinusoid stimulus was applied about a DC holding potential of −70 mV. All experiments were performed at room temperature. Data are shown as mean ± SEM. We used the Mann-Whitney U test for comparison of differences between groups. Curve fits were performed using IGOR Pro (Wavemetrics).
Measurements of [Ca2+]i and photolysis of caged Ca2+
[Ca2+]i was measured using a mixture of two indicator dyes, Fura-4F and furaptra. The dyes were excited with light alternated between 350 and 380 nm using a monochromator-based system, and the fluorescent signal was measured using a photomultiplier (T.I.L.L. Photonics). To convert the ratio R of the fluorescent signals at both wavelengths into [Ca2+]i, an in vivo calibration curve was used (Voets, 2000). To obtain stepwise increases in [Ca2+]I, short flashes of ultraviolet light from an arc flash lamp (Xenon; Rapp OptoElectronics) were applied to the whole cell. The monochromator light was not only used to measure [Ca2+]i but also to maintain calcium levels for 5 s after the flash (Figs. 1–3, 5, and 6) and allowed us to adjust [Ca2+]i after a flash or to achieve calcium ramps by photolysing smaller amounts of NP-EGTA. Trains of light at 350 and 380 nm for ratio measurement of calcium were generated via the monochromator.
Amperometric recordings of catecholamines
Amperometry recordings on isolated chromaffin cells were performed as previously described (Bruns et al., 2000). Carbon fiber electrodes used for amperometry were produced as follows. Carbon fibers (5-µm diameter) were glued to copper cannulae using a conducting carbon paste (Electrodag 5513; Bavaria Elektronik) and glued inside a glass pipette. The pipettes were pulled with a conventional puller. The carbon fiber extending beyond the pulled pipette tip was coated with a cathodal paint by electrolysis (BASF). The assembly was baked for 20 min at 50°C. The junction between the fiber and glass was sealed with Sylgard (Dow Corning) and baked again at 50°C. Before use, the carbon fibers were broken off to expose the tip for recording.
The electrode was connected to the head stage of an EPC7 patch clamp amplifier (HEKA), and a holding potential of 800 mV was applied in the voltage clamp mode. After the whole cell configuration was achieved, the carbon fiber was positioned so that it lightly touched the cell that was being recorded. Catecholamines contacting the carbon fiber were immediately oxidized, producing a current on the pipette that was countered by the patch clamp and allowing recording of catecholamine release as a measure of the amperometric current.
Preparation of cells for EM
Acutely dissociated chromaffin cells from wild-type and CAPS DKO mice (E18/P0) were plated on collagen-coated sapphire discs (EM PACT2; Leica) in 4-well plates. After 2 d in culture, some wells were infected with 50 µl activated pSFV1-syntaxinL165A/E166A-IRES-GFP for 5 h. The infected cells were visualized using a standard laser-scanning confocal microscope (LSM 710; Carl Zeiss, Inc.) with an excitation wavelength of 488 nm. Low resolution overview images of the whole sapphire discs were acquired with a 10× objective.
High pressure freezing
Sapphire discs with cultured cells were dipped into DME with 30% FCS, transferred into flat specimen carriers, and frozen in a high pressure freezer (EM PACT2; Leica). Wild-type and CAPS DKO cells were frozen 6 h after infection. Untreated control cells were frozen at the same time.
Freeze substitution and embedding
Frozen mouse chromaffin cells were fixed in an automatic freeze substitution apparatus (AFS2; Leica) as described previously (Edelmann et al., 2007). In brief, cryosubstitution was performed with 2% osmium tetroxide in anhydrous acetone and 2% H2O. The temperature was increased linearly from −90°C to −70°C over 20 h, from −70°C to −50°C over 20 h, and from −50°C to −10°C over 4 h. After washing with acetone, the cells were embedded in epon-812 (30% epon/acetone for 10 min at −10°C, 70% epon/acetone for 1 h at −10°C, and pure epon for 1 h at 20°C; Electron Microscopy Sciences). The temperature was increased linearly from 20 to 60°C over 4 h, and epon was polymerized at 60°C for 1 d. After polymerization, the carrier and the sapphire disc were removed from the epon block. The embedded cells were localized at the surface of the block and could be inspected with a light microscope. Comparing light micrographs of the infected living DKO and wild-type chromaffin cells with the cell patterns sketched from the corresponding block, we were able to identify the virus-infected cells in the resin block. During trimming of the block, care was taken so that some of the surrounding cells were left for orientation purposes when viewed at higher resolution in the electron microscope.
Ultrathin (70 nm) sections were cut parallel to the cell monolayer and collected on pioloform-coated copper grids using an electron microscope (EM UC7; Leica) stained with uranyl acetate and lead citrate and analyzed with an electron microscope (Tecnai 12 Biotwin; Philips).
Only cells with a visible nucleus and preserved plasma membrane were analyzed. LDCVs were recognized by their round, dense core. An outline of both the plasma membrane and the nucleus was generated manually, and vesicles were marked manually and outlined with a circle. The radius of the vesicle and the shortest distance from its edge to the plasma membrane were calculated using software written in house (by D. Hof).
Numerical simulation
We use the model for the chromaffin cell exocytotic pools (Sørensen, 2004) quantifying the dynamical evolution of the number of vesicles u, s, and r in the UPP, SRP, and RRP, respectively, by a set of ordinary differential equations ( and denote the time derivative of u, s, and r, respectively):
k0 (k-0) is the forward (backward) docking rate, k1 (k-1) is the forward (backward) priming rate, and k2 (k-2) is the forward (backward) rate for the transfer SRP↔RRP. fs and fr are the release rates from SRP and RRP, respectively, and dsize is the depot size, which is set to 2,000 vesicles. All rates are constant for constant Ca2+ stimulus; the standard model assumes that only the forward priming rate k1 and the release rates fs and fr are Ca2+ dependent. The total number of released vesicles, denoted F, is given by For our base scenario, we use the rates given in Table I and indicate when we use values deviating from these rates in the simulation.
Table I.
Base scenario rates used in this study
| Free [Ca2+]i | k0 | k-0 | k1 | k-1 | k2 | k-2 | fs | fr |
| 100 nM | 0.002 | 0.0041 | 0.00125 | 0.05 | 0.12 | 0.15 | 0.001 | 0.001 |
| 10 µM | 0.002 | 0.0041 | 0.00125 | 0.05 | 0.12 | 0.15 | 3.0 | 30.0 |
For low Ca2+ (100 nM), we calculate the stationary depot sizes by solving the linear equations for u, s, and r which one obtains by setting the time derivatives to zero ( = = = 0). This yields the depot size shown in Fig. 8 (B and D). The stationary solution for low Ca2+ is then used as initial values for u, s, and r, and the time evolution of the depot sizes and released vesicles (F) at high Ca2+ is simulated by integrating the aforementioned differential equations numerically with a fourth-order Runge-Kutta method implemented in a C-code on a standard PC. The sustained rate is then extracted from the time course of the number of released vesicles F(t) obtained from the simulation by applying the same fit procedure as used to extract the experimentally determined sustained rate from data for the time course of the membrane capacitance during the first 5 s of flash photolysis of caged Ca.
Acknowledgments
We thank Carolin Bick, Katrin Sandmeier, Manuela Schneider, and Reiko Trautmann (Department of Physiology) and Birgit Leis and Norbert Pütz (Department of Anatomy and Cell Biology, University of the Saarland) for expert technical support.
This work was supported by the Deutsche Forschungsgemeinschaft (grants SFB 530, GRK 845, and GRK 1326 to D. Bruns and J. Rettig) and an intramural funding program (HOMFOR) of the University of the Saarland Medical School at Homburg.
Footnotes
Abbreviations used in this paper:
- CAPS
- calcium-dependent activator protein for secretion
- DKO
- double KO
- KO
- knockout
- LDCV
- large dense-core vesicle
- MHD
- Munc13 homology domain
- RRP
- readily releasable pool
- SRP
- slowly releasable pool
- SV
- synaptic vesicle
- UPP
- unprimed pool
References
- Ann K., Kowalchyk J.A., Loyet K.M., Martin T.F. 1997. Novel Ca2+-binding protein (CAPS) related to UNC-31 required for Ca2+-activated exocytosis. J. Biol. Chem. 272:19637–19640 10.1074/jbc.272.32.19637 [DOI] [PubMed] [Google Scholar]
- Ashery U., Betz A., Xu T., Brose N., Rettig J. 1999. An efficient method for infection of adrenal chromaffin cells using the Semliki Forest virus gene expression system. Eur. J. Cell Biol. 78:525–532 [DOI] [PubMed] [Google Scholar]
- Ashery U., Varoqueaux F., Voets T., Betz A., Thakur P., Koch H., Neher E., Brose N., Rettig J. 2000. Munc13-1 acts as a priming factor for large dense-core vesicles in bovine chromaffin cells. EMBO J. 19:3586–3596 10.1093/emboj/19.14.3586 [DOI] [PMC free article] [PubMed] [Google Scholar]
- Augustin I., Rosenmund C., Südhof T.C., Brose N. 1999. Munc13-1 is essential for fusion competence of glutamatergic synaptic vesicles. Nature. 400:457–461 10.1038/22768 [DOI] [PubMed] [Google Scholar]
- Basu J., Shen N., Dulubova I., Lu J., Guan R., Guryev O., Grishin N.V., Rosenmund C., Rizo J. 2005. A minimal domain responsible for Munc13 activity. Nat. Struct. Mol. Biol. 12:1017–1018 [DOI] [PubMed] [Google Scholar]
- Betz A., Okamoto M., Benseler F., Brose N. 1997. Direct interaction of the rat unc-13 homologue Munc13-1 with the N terminus of syntaxin. J. Biol. Chem. 272:2520–2526 10.1074/jbc.272.4.2520 [DOI] [PubMed] [Google Scholar]
- Bittner M.A., Holz R.W. 1992. Kinetic analysis of secretion from permeabilized adrenal chromaffin cells reveals distinct components. J. Biol. Chem. 267:16219–16225 [PubMed] [Google Scholar]
- Bruns D., Riedel D., Klingauf J., Jahn R. 2000. Quantal release of serotonin. Neuron. 28:205–220 10.1016/S0896-6273(00)00097-0 [DOI] [PubMed] [Google Scholar]
- Dulubova I., Sugita S., Hill S., Hosaka M., Fernandez I., Südhof T.C., Rizo J. 1999. A conformational switch in syntaxin during exocytosis: role of munc18. EMBO J. 18:4372–4382 10.1093/emboj/18.16.4372 [DOI] [PMC free article] [PubMed] [Google Scholar]
- Edelmann L., Spehner D., Vecerdea A., Lipp P. 2007. High pressure freezing and freeze-substitution of cardiac myocytes. Microsc. Microanal. 13:146–147 [Google Scholar]
- Elhamdani A., Martin T.F., Kowalchyk J.A., Artalejo C.R. 1999. Ca(2+)-dependent activator protein for secretion is critical for the fusion of dense-core vesicles with the membrane in calf adrenal chromaffin cells. J. Neurosci. 19:7375–7383 [DOI] [PMC free article] [PubMed] [Google Scholar]
- Gerber S.H., Rah J.C., Min S.W., Liu X., de Wit H., Dulubova I., Meyer A.C., Rizo J., Arancillo M., Hammer R.E., et al. 2008. Conformational switch of syntaxin-1 controls synaptic vesicle fusion. Science. 321:1507–1510 10.1126/science.1163174 [DOI] [PMC free article] [PubMed] [Google Scholar]
- Hammarlund M., Watanabe S., Schuske K., Jorgensen E.M. 2008. CAPS and syntaxin dock dense core vesicles to the plasma membrane in neurons. J. Cell Biol. 180:483–491 10.1083/jcb.200708018 [DOI] [PMC free article] [PubMed] [Google Scholar]
- James D.J., Kowalchyk J., Daily N., Petrie M., Martin T.F. 2009. CAPS drives trans-SNARE complex formation and membrane fusion through syntaxin interactions. Proc. Natl. Acad. Sci. USA. 106:17308–17313 10.1073/pnas.0900755106 [DOI] [PMC free article] [PubMed] [Google Scholar]
- Jockusch W.J., Speidel D., Sigler A., Sørensen J.B., Varoqueaux F., Rhee J.S., Brose N. 2007. CAPS-1 and CAPS-2 are essential synaptic vesicle priming proteins. Cell. 131:796–808 10.1016/j.cell.2007.11.002 [DOI] [PubMed] [Google Scholar]
- Koch H., Hofmann K., Brose N. 2000. Definition of Munc13-homology-domains and characterization of a novel ubiquitously expressed Munc13 isoform. Biochem. J. 349:247–253 10.1042/0264-6021:3490247 [DOI] [PMC free article] [PubMed] [Google Scholar]
- Liu Y., Schirra C., Stevens D.R., Matti U., Speidel D., Hof D., Bruns D., Brose N., Rettig J. 2008. CAPS facilitates filling of the rapidly releasable pool of large dense-core vesicles. J. Neurosci. 28:5594–5601 10.1523/JNEUROSCI.5672-07.2008 [DOI] [PMC free article] [PubMed] [Google Scholar]
- Madison J.M., Nurrish S., Kaplan J.M. 2005. UNC-13 interaction with syntaxin is required for synaptic transmission. Curr. Biol. 15:2236–2242 10.1016/j.cub.2005.10.049 [DOI] [PubMed] [Google Scholar]
- Parsons T.D., Coorssen J.R., Horstmann H., Almers W. 1995. Docked granules, the exocytic burst, and the need for ATP hydrolysis in endocrine cells. Neuron. 15:1085–1096 10.1016/0896-6273(95)90097-7 [DOI] [PubMed] [Google Scholar]
- Plattner H., Artalejo A.R., Neher E. 1997. Ultrastructural organization of bovine chromaffin cell cortex–analysis by cryofixation and morphometry of aspects pertinent to exocytosis. J. Cell Biol. 139:1709–1717 10.1083/jcb.139.7.1709 [DOI] [PMC free article] [PubMed] [Google Scholar]
- Renden R., Berwin B., Davis W., Ann K., Chin C.T., Kreber R., Ganetzky B., Martin T.F., Broadie K. 2001. Drosophila CAPS is an essential gene that regulates dense-core vesicle release and synaptic vesicle fusion. Neuron. 31:421–437 10.1016/S0896-6273(01)00382-8 [DOI] [PubMed] [Google Scholar]
- Richmond J.E., Davis W.S., Jorgensen E.M. 1999. UNC-13 is required for synaptic vesicle fusion in C. elegans. Nat. Neurosci. 2:959–964 10.1038/12160 [DOI] [PMC free article] [PubMed] [Google Scholar]
- Richmond J.E., Weimer R.M., Jorgensen E.M. 2001. An open form of syntaxin bypasses the requirement for UNC-13 in vesicle priming. Nature. 412:338–341 10.1038/35085583 [DOI] [PMC free article] [PubMed] [Google Scholar]
- Rowe J., Corradi N., Malosio M.L., Taverna E., Halban P., Meldolesi J., Rosa P. 1999. Blockade of membrane transport and disassembly of the Golgi complex by expression of syntaxin 1A in neurosecretion-incompetent cells: prevention by rbSEC1. J. Cell Sci. 112:1865–1877 [DOI] [PubMed] [Google Scholar]
- Sadakata T., Washida M., Furuichi T. 2007. Alternative splicing variations in mouse CAPS2: differential expression and functional properties of splicing variants. BMC Neurosci. 8:25 10.1186/1471-2202-8-25 [DOI] [PMC free article] [PubMed] [Google Scholar]
- Schonn J.S., Maximov A., Lao Y., Südhof T.C., Sørensen J.B. 2008. Synaptotagmin-1 and -7 are functionally overlapping Ca2+ sensors for exocytosis in adrenal chromaffin cells. Proc. Natl. Acad. Sci. USA. 105:3998–4003 10.1073/pnas.0712373105 [DOI] [PMC free article] [PubMed] [Google Scholar]
- Sørensen J.B. 2004. Formation, stabilisation and fusion of the readily releasable pool of secretory vesicles. Pflugers Arch. 448:347–362 10.1007/s00424-004-1247-8 [DOI] [PubMed] [Google Scholar]
- Sørensen J.B., Matti U., Wei S.H., Nehring R.B., Voets T., Ashery U., Binz T., Neher E., Rettig J. 2002. The SNARE protein SNAP-25 is linked to fast calcium triggering of exocytosis. Proc. Natl. Acad. Sci. USA. 99:1627–1632 10.1073/pnas.251673298 [DOI] [PMC free article] [PubMed] [Google Scholar]
- Speese S., Petrie M., Schuske K., Ailion M., Ann K., Iwasaki K., Jorgensen E.M., Martin T.F. 2007. UNC-31 (CAPS) is required for dense-core vesicle but not synaptic vesicle exocytosis in Caenorhabditis elegans. J. Neurosci. 27:6150–6162 10.1523/JNEUROSCI.1466-07.2007 [DOI] [PMC free article] [PubMed] [Google Scholar]
- Speidel D., Varoqueaux F., Enk C., Nojiri M., Grishanin R.N., Martin T.F., Hofmann K., Brose N., Reim K. 2003. A family of Ca2+-dependent activator proteins for secretion: comparative analysis of structure, expression, localization, and function. J. Biol. Chem. 278:52802–52809 10.1074/jbc.M304727200 [DOI] [PubMed] [Google Scholar]
- Speidel D., Bruederle C.E., Enk C., Voets T., Varoqueaux F., Reim K., Becherer U., Fornai F., Ruggieri S., Holighaus Y., et al. 2005. CAPS1 regulates catecholamine loading of large dense-core vesicles. Neuron. 46:75–88 10.1016/j.neuron.2005.02.019 [DOI] [PubMed] [Google Scholar]
- Stevens D.R., Rettig J. 2009. The Ca(2+)-dependent activator protein for secretion CAPS: do I dock or do I prime? Mol. Neurobiol. 39:62–72 10.1007/s12035-009-8052-5 [DOI] [PubMed] [Google Scholar]
- Stevens D.R., Wu Z.X., Matti U., Junge H.J., Schirra C., Becherer U., Wojcik S.M., Brose N., Rettig J. 2005. Identification of the minimal protein domain required for priming activity of Munc13-1. Curr. Biol. 15:2243–2248 10.1016/j.cub.2005.10.055 [DOI] [PubMed] [Google Scholar]
- Tokumaru H., Augustine G.J. 1999. UNC-13 and neurotransmitter release. Nat. Neurosci. 2:929–930 10.1038/14710 [DOI] [PubMed] [Google Scholar]
- Voets T. 2000. Dissection of three Ca2+-dependent steps leading to secretion in chromaffin cells from mouse adrenal slices. Neuron. 28:537–545 10.1016/S0896-6273(00)00131-8 [DOI] [PubMed] [Google Scholar]
- Voets T., Neher E., Moser T. 1999. Mechanisms underlying phasic and sustained secretion in chromaffin cells from mouse adrenal slices. Neuron. 23:607–615 10.1016/S0896-6273(00)80812-0 [DOI] [PubMed] [Google Scholar]
- Walent J.H., Porter B.W., Martin T.F. 1992. A novel 145 kd brain cytosolic protein reconstitutes Ca(2+)-regulated secretion in permeable neuroendocrine cells. Cell. 70:765–775 10.1016/0092-8674(92)90310-9 [DOI] [PubMed] [Google Scholar]
- Zhou K.M., Dong Y.M., Ge Q., Zhu D., Zhou W., Lin X.G., Liang T., Wu Z.X., Xu T. 2007. PKA activation bypasses the requirement for UNC-31 in the docking of dense core vesicles from C. elegans neurons. Neuron. 56:657–669 10.1016/j.neuron.2007.09.015 [DOI] [PubMed] [Google Scholar]