

Abstract
We develop a theory for the rapid search of specific sites on DNA, via a mechanism in which a nonspecifically-bound protein can switch between two conformations. In the “inactive” conformation, the bound protein has favorable, nonspecific interactions with the DNA, but cannot be recognized by the target site. In the “active” conformation, the protein is recognized by the target site but has a very rugged energy surface elsewhere on the DNA. The rate constant for protein binding to the specific site is calculated by an approach in which the protein, after reaching the DNA surface via 3D diffusion, searches for the target site via 1D diffusion while being allowed to escape to the bulk solution. Mindful of the pitfalls of many previous approximate treatments, we validate our approach against a rigorous solution of the problem when the protein has a fixed conformation. In the 1D diffusion toward the specific site, a conformationally switchable protein predominantly adopts the inactive conformation due to the favorable nonspecific interactions with the DNA, thus maximizing the 1D diffusion constant and minimizing the chance of escape to the bulk solution. Once at the target site, a transition to the active conformation allows the protein to be captured. This induced-switch mechanism provides robust speedup of protein-DNA binding rates, and appears to be adopted by many transcription factors and DNA-modifying enzymes.
Keywords: conformational change, nonspecific binding, binding kinetics
Ever since the first demonstration that proteins can bind to specific DNA sequences (1, 2), numerous studies have been carried out to address the question of how a protein can readily find a short specific site on a long DNA (3–20). It is widely accepted that the search is accomplished by coupled 3D diffusion in the bulk solution and 1D diffusion, while specifically bound, along the DNA surface. Many theoretical models have focused on the 1D diffusion. Appealing terms such as hopping and jumping have been used to treat excursions into the bulk solution. However, the lack of rigor in previous treatments has led to conflicting results. In particular, whether 1D diffusion can play a significant rate-enhancement role under physiological conditions has been questioned (15). Here we present an approach for calculating the protein-DNA binding rate constant ka that allows for proper coupling between 3D and 1D diffusion. We use this approach to treat the conformational switch of a nonspecifically bound protein, and demonstrate that it provides a robust mechanism for speeding up the search of specific sites.
The bimolecular rate constant ka can be rigorously determined from the equation governing the relative translational diffusion, rotational diffusion, and internal motions of the two binding molecules (21). This governing equation involves the potential of mean force in these degrees of freedom and parameters characterizing the external and internal dynamics, such as a position-dependent diffusion constant for the translational diffusion and transition rates between different conformations. In earlier work (10, 14) we used a potential of mean force featuring a narrow shell of deep energy well around the DNA to model nonspecific binding (Fig. 1A). The rate constant of a protein binding to a specific site on the DNA was found to be a monotonically increasing function of the DNA length. That is, nonspecific flanking sequences always enhance ka, which is directly supported by experimental studies (8, 9).
Fig. 1.

Models of protein-DNA binding. (A) A system studied previously (14) and used here as benchmark. The DNA is modeled as a cylinder with length 2L, with an absorbing strip of length 2h in the middle representing the specific site. In the hatched region around the DNA, a surface potential is present, allowing the protein to bind nonspecifically. (B) The energy surfaces of a nonspecifically-bound protein that can switch between two conformations. Throughout the DNA length, the energy surface in the inactive conformation has a significant negative mean value, Ui(x), with a modest root-mean-square fluctuation σi. Away from the specific site, the energy surface in the active conformation has a modest negative mean value, Ua(x), with a significant root-mean-square fluctuation σa. This energy surface has a very deep energy well at the specific site, making that entire site absorbing. The fluctuations in the energy surfaces arise from different sets of interactions experienced by the protein as it moves along the DNA.
Further approximations, in particular those involving separately treating the 3D diffusion in the bulk solution and the 1D diffusion along the DNA surface, allow important details such as conformational switch to be accounted for. Many recent theoretical studies (11–13, 16, 19) were based on a two-state model, in which the transfer of the DNA-binding protein between the bulk solution and the DNA surface, as well as the capture of the protein, while nonspecifically bound, by the specific site are modeled by ordinary chemical kinetics, with rate constants κ3, κ3-, and κ1:
 |
In this reaction scheme, Pb, Pns, and Ps denote the protein in the bulk solution, the nonspecifically-bound protein, and the protein bound to the specific site, respectively. The total search time for the specific site can be written as (see SI Appendix):  , where
  is the average length of individual excursions in the bulk solution,
  is the average lifetime of the nonspecifically-bound protein, and
  is the average rounds of cycling between Pb and Pns that the protein goes through before being captured by the specific site. However, previous specifications of
  ,
,  , and
, and  appear to be misguided, leading to a number of suspicious predictions, including an optimal
  , or alternatively, an optimal “sliding length.” The latter, touted as an important finding, is the basis for questioning the significance of 1D diffusion under physiological conditions (15). Another erroneous prediction is that the search time increases with increasing DNA length, which is counter to the basic notion that 1D diffusion speeds up the search and contradicts the above rigorous result that ka is a monotonically increasing function of DNA length.
When  ,
,  , and
, and  are properly specified, we find that the bimolecular rate constant predicted by the two-state model agrees well with the rigorous solution for short DNA. However, as the DNA length increases further and further, ka predicted by the two-state model eventually decreases, incorrectly resulting in a maximum in ka as a function of the DNA length. Here we develop another approach, based on the position-dependent capture probability, for coupling 3D and 1D diffusion. Mindful of the pitfalls of the previous approximate treatments, we validate this approach against the rigorous solution.
We apply this approach to deal with conformational switch of the DNA-binding protein (Fig. 1B). Conformational switch was introduced to diffusion-influenced binding kinetics by McCammon and Northrup (22) and has been treated in subsequent theoretical studies (21, 23–25). For protein-DNA binding, Slutsky and Mirny (12) explicitly considered the conformational switch of the protein while nonspecifically bound to the DNA. This and other follow-up studies (16, 19) were based on the two-state model, but with an unjustified specification of  . Using our approach based on the position-dependent capture probability, we show that a DNA-binding protein can stay mostly in a fast diffusing “inactive” conformation until it encounters the specific site, whereupon interactions with the specific site induce it to quickly switch to the active conformation for recognition. This induced-switch mechanism appears to be adopted by many transcription factors and DNA-modifying enzymes.
Theory
Here we develop the theory for the rate constant of protein-DNA binding. To deal with conformational switch, we introduce an approximate approach. The accuracy of this approach is checked against the rigorous theory (14) for the case where the protein has a fixed conformation.
Protein with a Fixed Conformation.
Previously we (14) studied the following protein-DNA system (Fig. 1A). The protein, with a fixed conformation, was modeled as a sphere and the DNA as a cylinder with length 2L and protein-DNA contact radius R. The protein has a diffusion constant D3 in the bulk solution and a longitudinal diffusion constant D while nonspecifically bound to the DNA. The pair distribution function P(r) at position r relative to the DNA satisfies the steady-state Smoluchowski equation
| [1a] |
where
| [1b] |
is the flux of the distribution function. In Eq. 1b,  is the position-dependent diffusion tensor, U(r) is the potential of mean force, and β = (kBT)-1 where kB denotes Boltzmann’s constant and T the absolute temperature. At the specific site, U(r) has a very deep minimum; once the diffusing protein moves inside, it is trapped there irreversibly, so effectively the rim of this energy minimum is absorbing. In the system of Fig. 1A, this rim is represented by the strip with length 2h and radius R. The rate constant for the protein binding to the specific site is given by the surface integral
 |
[2] |
where n is the outward normal of the surface element ds.
In our previous study, nonspecific binding occurs because of a “surface potential”, i.e., a narrow shell of deep energy well around the DNA. The equilibrium constant per unit surface area for nonspecific binding is (10, 14)
| [3] |
where U is the value of the surface potential and ε is its width. Then ka is found to be
| [4] |
where
 |
[5] |
is the rate constant for an infinitely long DNA (10), with ξ1 = ξh/R, Γ = DKns/D3R, and K0(x) and K1(x) denoting modified Bessel functions. The reduction factor α for a finite-length DNA is given in SI Appendix. The result for ka was derived using the so-called constant-flux approximation (26), which deals with the mixed-type boundary conditions on the DNA surface by assuming that the flux of the distribution function is constant over the absorbing strip representing the specific site.
Another rate constant, for the nonspecific binding of the protein in the bulk solution to anywhere on the DNA surface, will play a prominent role in the results below. We can obtain this bimolecular rate constant, to be denoted as k3, from Eqs. 4 and 5 as a special case with Kns = 0 and h = L, resulting in
 |
[6] |
where ξ2 = λL/R. Note that in calculating k3 every part of the DNA surface over the length 2L is absorbing; consequently k3 is an increasing function of L. Eqs. 4–6 will be used below to test approximate approaches for calculating ka.
Two-State Model.
In previous treatments of this model (11–13, 16, 19), the specifications of  ,
,  , and
, and  were based on heuristic arguments. For example, Slutsky and Mirny (12) took
  as a fixed parameter and assigned
  to be
to be  , where
  is the root-mean-square distance traveled by the nonspecifically-bound protein in a time interval
  . With such specifications, ts would be erroneously predicted to increase with increasing L and have a maximum as a function of
  .
.
In SI Appendix we reanalyze the two-state model. In particular, the correct specification for  is
is
 |
[7] |
The last quantity η is the probability of the nonspecifically-bound protein being captured by the specific site rather than escaping to the bulk solution. When the volume of the bulk solution approaches infinity, as is practically the case in experiments of protein-DNA binding kinetics, we have to abandon the unimolecular scheme and instead use a bimolecular scheme:
 |
where D, Pns·D, and PsD represent the DNA, the protein-DNA nonspecific complex, and the specific complex, respectively. The equilibrium constant for forming Pns·D,
 |
[8] |
is 4πRLKns for the system of Fig. 1A. The overall bimolecular rate constant predicted by the two-state model is
| [9] |
To find η, we need κ1, the rate constant for the nonspecifically-bound protein to be captured by the specific site while not allowed to dissociate. We calculate κ1 as the inverse of the mean-first-passage-time  for reaching the absorbing boundary at x = 0 when the protein is started uniformly in |x| < L while a reflecting boundary condition is applied at |x| = L (see SI Appendix). Then
 |
[10a] |
When the surface potential is constant over the DNA length, Szabo et al. (27) obtained  . In that case,
 |
[10b] |
where m = (D/κ3-)1/2 represents the root-mean-square distance traveled by the nonspecifically-bound protein during the decay time 1/κ3-. Compared to the quantity  used by Slutsky and Mirny (12) and others, m as defined here is closer in spirit to what Berg et al. (6) referred as sliding length.
A Rigorous Expression of ka.
In SI Appendix we show that ka is rigorously given by
| [11a] |
where DNA exterior surface refers to the surface enclosing the shell of deep energy well around the DNA, J3(r) is the flux of the pair distribution function at position r for the problem in which the whole DNA exterior surface is absorbing, and η(r) is the probability that the protein started at r will reach the specific site instead of escape to infinity. If J3(r) is obtained by using the constant-flux approximation, then
| [11b] |
where  is the unweighted average of η(r) over the DNA exterior surface and will be referred to as the average capture probability of the nonspecifically-bound protein. In the two-state model this average capture probability is given by Eq. 10a.
We want to develop a more rigorous approach for calculating  , specifically for the case where U(r) is a narrow shell of deep energy well at the DNA surface. In the system of Fig. 1A, the depth of the surface potential is effectively infinite in |x| < h and a constant elsewhere. Let us consider a general x-dependent surface potential, U(x). The corresponding x-dependent Kns (see Eq. 3) will be denoted as Kns(x). When r is confined to the narrow surface shell, η(r) has appreciable dependence only on the x coordinate. So from here on we denote η(r) simply as η(x).
Equation for η(x).
A rigorous formulation for η(x) necessarily involves the 3D diffusion in the bulk solution. We want to develop an approximate method that focuses on the dynamics within the surface shell. It is noted that η(x) can change by two pathways: by the 1D diffusion along the DNA surface and by escape out of the energy well to infinity. Let κ3-(x) be the decay rate constant of η(x) due to the latter pathway. To find κ3-(x), we propose a local equilibrium condition:
 |
[12] |
If J3(r) is obtained by using the constant-flux approximation, then -n·J3(r) = k3/4πRL. We then obtain
 |
[13] |
which reduces to Eq. 8 when the surface potential is x-independent.
Putting the two pathways for the change of η(x) together, we obtain the following equation for η(x):
 |
[14] |
When the surface potential is x-independent, we find the average capture probability to be
 |
[15] |
Here again m = (D/κ3-)1/2. Berg et al.’s result for ka (6) is the same as what we obtain by using Eq. 15 in Eq. 11b, if their kassoc and Λ are identified with our k3 and κ3-, respectively. Coppey et al. (11) also obtained a result similar to Eq. 15, in which m was replaced by  . The expression of
  for an x-dependent surface potential is derived in SI Appendix.
Eq. 15 and its counterpart in the two-state model, given by Eq. 10b, agrees when L/m → 0 but diverges when L/m → ∞. In that limit, Eq. 10b predicts a quadratic decrease of  with increasing L/m, whereas Eq. 15 predicts a linear decrease. This linear decrease is equivalent to the assignment of
  to
to  by Slutsky and Mirny (12) and others, except for the difference between our m and their
  . However, we emphasize that the linear behavior is obtained only when L/m → ∞.
Conformational Switch.
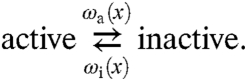
We now extend the η(x)-based approach to the case where the nonspecifically-bound protein can switch between two conformations (Fig. 1B) (12, 28). In the inactive conformation, the bound protein has favorable, nonspecific interactions with the DNA, but cannot be recognized by the target site. In the active conformation, the protein is recognized by the target site but has a very rugged energy surface elsewhere on the DNA. Following Zwanzig (29), diffusion on the rugged energy surface is equivalent to diffusion with a reduced, effective diffusion constant on the smooth average energy surface. We denote the average surface potentials in the two conformations as Ua(x) and Ui(x). The effective diffusion constant for conformation g, g = a, or i, is
| [16] |
where σg is the root-mean-square of the energy fluctuations around the smooth average energy surface; the prefactor could be significantly smaller than D3 due to coupled translational and rotational diffusion when the protein moves along a helical path while maintaining its orientation with respect to the DNA (30). Apparently, Slutsky and Mirny (12) have rediscovered Eq. 16. As illustrated in Fig. 1B, the active conformation has a much more rugged energy surface than the inactive conformation. Correspondingly, Da ≪ Di < D3. We assume that the switch between the two conformations is stochastic, with transition rates ωa(x) and ωi(x) (see Fig. 1B, SI Appendix: Fig. S1):
 |
The protein has a single conformation in the bulk solution but two conformations while nonspecifically bound to the DNA. To connect between the two regions, we imagine that, when the protein is just outside the DNA exterior surface, it also has two conformations. These conformations are physically identical but carry different labels, active and inactive, with probabilities p3a and p3i, respectively. The capture probability η(x) is the weighted average of the capture probabilities, ηa(x) and ηi(x), starting from the two conformations: η(x) = p3aηa(x) + p3iηi(x). The transition rates between the two conformations of the nonspecifically-bound protein must satisfy the detailed-balance relation (24, 25)
 |
[17] |
Including the transitions between the two conformations, the capture probabilities, ηa(x) and ηi(x), now satisfy the following equations:
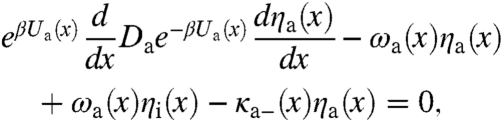 |
[18a] |
 |
[18b] |
where the position- and conformation-dependent escape rate, κg-(x), g = a, or i, is
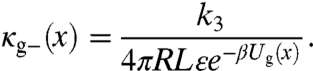 |
[19] |
In SI Appendix we derive the average capture probability  when Ua(x) is either x-independent or has a local deep well at the specific site.
Results and Discussion
Given the pitfalls of previous approximate treatments, it is important to use rigorous results for validation. We now use the rigorous solution for the binding rate constant ka of the system depicted in Fig. 1A as the benchmark for testing approximate approaches. We find that, when properly used, the two-state model predicts well the bimolecular rate constant ka when L/m < 1 but fails for large L. We then show that our approach, based on the position-dependent capture probability, significantly improves the accuracy of the ka calculation. We finally use this approach to treat the conformational switch of a nonspecifically-bound protein, and find that adopting the fast diffusing inactive conformation during the approach to the specific site and then quickly switching to the active conformation via interactions with the specific site allow the protein to achieve significant speedup in ka. Our results suggest that this “induced-switch” mechanism is adopted by many transcription factors and DNA-modifying enzymes.
Two-State Model Predicts ka Well for Small L but Fails for Large L.
As the benchmark for testing approximate approaches, we display in Fig. 2A the rigorous ka result, given by Eq. 4, for the system of Fig. 1A. At a given value of the dimensionless parameter Γ = DKns/D3R, ka is a monotonically increasing function of L. The ka prediction of the two-state model, given by combining Eqs. 6, 9, 10a, and  of Eq. S53 (SI Appendix), is compared to the rigorous result in Fig. 2A. There is very good agreement when L/m < 1. However, as L increases, the two-state model severely underestimates ka. At large L, the predicted ka even decreases, resulting in an apparent maximum in ka as a function of L.
Fig. 2.

Comparison of ka predictions from two approximate approaches against the rigorous results (displayed as circles and triangles). The protein-DNA contact radius R is 30 Å; the absorbing strip representing the specific site has half-length h = 3 Å. (A) Dependence of  on L for two values of Γ = DKns/D3R = (k3/4πD3L)(m2/R2). The vertical lines indicate L values at which L/m = 1 for the two Γ values. Each basepair (bp) is assumed to span 3.4 Å of DNA length. (B) Dependence of ka/k3 on Γ. The DNA half-length L = 1,000 bp.
The severe underestimation of ka at large L indicates a fundamental limitation of the basic assumption of the two-state model: the transfer of the DNA-binding protein between the bulk solution and the DNA surface is stochastic. This assumption is justified only when the nonspecifically-bound protein can equilibrate among all the positions along the DNA before it escapes to the bulk solution. This condition requires L/m < 1.
Approach Based on Position-Dependent Capture Probability Improves Accuracy.
In Fig. 2A we also display the predicted ka by our η(x)-based approach. It can be seen that, relative to the two-state model, this approach significantly improves the accuracy of ka calculation. The improvement in accuracy comes about because we no longer assume that the nonspecifically-bound protein equilibrates among all the positions along the DNA before escaping to the bulk solution. Instead, the equilibration is over a local distance along the DNA (see Eq. 12). It should be noted, however, that ka is still slightly underestimated at very large L.
At a given L, the rigorous solution for ka is a monotonically increasing function of Γ = DKns/D3R = (k3/4πD3L)(m2/R2) (circles in Fig. 2B). The corresponding monotonic dependence on the sliding length m contradicts the prediction of an optimal sliding length (or, alternatively, an optimal  ) by others based on the two-state model (11–13, 16, 19). Actually, our treatment of the two-state model leads to a monotonic dependence of ka on Γ, though the value of ka is underestimated at small Γ (Fig. 2B). More importantly, the approach based on the position-dependent capture probability correctly predicts the monotonic dependence on Γ, and the predicted ka is in close agreement with the rigorous solution (Fig. 2B).
Lomholt et al. (18) introduced an equation for the time-dependent probability density along the DNA, which, like our governing equation (Eq. 14) for η(x), contains a decay term with a rate constant κ3-. However, their prediction of ka for binding to a specific site on a straight DNA shows considerable deviation from the rigorous solution (see SI Appendix: Fig. S2).
Conformational Switch Results in Speedup in ka.
We now consider the case where the nonspecifically-bound protein switches between the inactive and active conformations. The interaction energy Ui in the inactive conformation is more negative than the counterpart Ua in the active conformation everywhere along the DNA except at the specific site, where the latter has a deep well. For the moment let us overlook this deep well and assume that Ua, like Ui, is constant. Then everywhere on the DNA the transition rates between the two conformations are constant, and we refer to this scenario as indifferent switch. Because Ui is more negative than Ua, the inactive-to-active transition rate ωi will be much smaller than the active-to-inactive transition rate ωa, and the escape rate κi- to the bulk solution from the inactive conformation will be much smaller than the counterpart κa- from the active conformation (see Eqs. 17 and 19).
The predicted ka as a function of ωi by our η(x)-based approach is shown as the dashed curve in Fig. 3 for the indifferent-switch scenario at ωi/ωa = κi-/κa- = 10-3, Di/Da = 102, and L = 103 bp. The results are scaled by ka;fc, which denotes the rate constant when the nonspecifically-bound protein is fixed in the active conformation. The value of ka increases as the transition rates between the two conformations increase (24). For the parameters chosen, ka exceeds ka;fc when the inactive-to-active transition rate exceeds ∼1 s-1.
Fig. 3.

The DNA-binding rate constant when the nonspecifically-bound protein can switch between two conformations. The dashed and solid curves show ka/ka;fc for the indifferent-switch and induced-switch scenarios, respectively. The parameters are Di = 0.9 × 10⁻⁹ cm2/s and κi- = 0.2 s-1.
Mirny and coworkers (12, 16) and more recently Murugan (19) studied the indifferent-switch scenario based on the two-state model, but their specification of  seems unjustified. Murugan assigned
  to
to  . Mirny and coworkers’
  was increased by another factor, ostensibly to account for the fact that, when the protein in the inactive conformation diffuses to the specific site it may not switch to the active conformation in time before it diffuses away. As we emphasized in the preceding section, a linear dependence of
  on L is justified only when L/m≫1. However, as Fig. 2A shows, when L/m≫1, the two-state model completely fails. Other problems with the use of the two-state model for a DNA-binding protein that switches between two conformations are noted in SI Appendix.
Induced-Switch Leads to a Robust Speedup Mechanism.
The deep well at the specific site will result in a significant increase in the local inactive-to-active transition rate ω0i and a significant decrease in the active-to-inactive counterpart ω0a (see SI Appendix: Fig. S1). We refer to the increase in ω0i due to interactions with the specific site as induced switch. If the local well is extremely deep, then ω0i → ∞, ω0a → 0, and κ0a- → 0. The protein-DNA binding rate constant in this extreme induced-switch scenario is shown as the solid curve in Fig. 3. We now see that significant speedup in ka over ka;fc is obtained regardless of the inactive-to-activate transition rate ωi at noncognate sites.
For a number of DNA-binding proteins, there is now detailed knowledge about the differences between the nonspecifically-bound inactive conformation and the specifically bound active conformation in their interactions with DNA (31–34). In the specific complex, the protein usually approaches the DNA more closely and the DNA might be locally distorted to accommodate the protein. It is largely the same residues that interact with the DNA in the two complexes, but they switch from electrostatic interactions with phosphate groups in the nonspecific complex to hydrogen bonds with the cognate bases in the specific complex; these residues also appear to be more dynamic in the nonspecific complex.
Where does the switch from the inactive conformation to the active conformation occur? In the indifferent-switch scenario, the protein transitions to the active conformation to probe every site in order not to miss the specific site. Such transitions slow down the 1D diffusion and increase the chance of escape to the bulk solution. For some DNA-modifying enzymes, recognition may further require bases to be flipped out in order to determine whether the bases can fit into their active sites and catalysis can proceed. Flipping every base would be very wasteful. Such wasteful probe of noncognate sites is avoided in the induced-switch scenario, in which the protein stays in the inactive conformation until encountering the specific site. There the protein quickly switches to the active conformation, allowing it to be recognized.
Speedup by Induced Switch May Be Essential for Site-Specific DNA Binding.
Considerations of a number of important details in site-specific protein-DNA binding indicate that the speedup by induced switch may be essential for bringing many DNA-binding rate constants up to a range required for function.
Observations that protein-DNA nonspecific complexes have relative orientations similar to the corresponding specific complexes (31–35) suggest that nonspecifically-bound proteins diffuse along a helical path, e.g., the major groove. This restriction will reduce the rate constant k3 for nonspecific binding and increase the rate constant κ3- for escape to the bulk solution. To obtain an indication on the magnitudes of these changes, let us consider the case where nonspecific binding occurs on a linear strip running along the DNA, defined with the angle ϕ around the DNA axis restricted to |ϕ| < ϕ0. The solution for k3 in this case is given in SI Appendix. Compared to the case where the whole DNA surface allows for nonspecific binding (i.e., ϕ0 = 180°), k3 is reduced by 2- to 3-fold at ϕ0 = 5° when L is between 100 to 5,000 bp. The equilibrium constant for nonspecific binding,  , is reduced by a factor of 180/5 = 36; hence
  would be increased by 12- to 18-fold.
In addition to approaching the DNA surface from a certain range of ϕ, nonspecific binding also requires that the protein be oriented correctly. The orientational restraint on the protein also decreases k3 and increases κ3-. We expect that both the decrease in k3 and the increase in κ3- due to the orientational restraint on the protein will be greater than those illustrated above due to the restriction on ϕ, although long-range electrostatic interactions will offset the effects of the orientational restraint to some extent (15, 36).
It has been recognized that a long DNA is a coil rather than a straight cylinder (6, 18). Coiling would be expected to reduce k3, due to the fact that the nonspecific sites in a coiled DNA are more compact than those in a straight DNA. Assuming that the equilibrium constant for nonspecific binding is not affected, there would be a commensurate reduction in κ3-. Together the changes in k3 and κ3- would lead to a moderate decrease in ka. These expectations are confirmed when the ka results for a straight DNA and for a circular DNA with the same contour length are compared (37). Circularization has the same effect as coiling in condensing the nonspecific binding sites.
All these effects lead to decreases in ka. Inside cells, macromolecular crowding and presence of other proteins as obstacles on DNA may further decrease ka. Therefore a robust speedup mechanism may be essential for protein-DNA binding. We also note that accounting for the details outlined above leads to an increase in κ3-; that in turn will lead to an increase in the minimum inactive-to-active transition rate for the indifferent-switch scenario to produce speedup (Fig. 3). This burden does not apply to the induced-switch mechanism.
Extension of η(x)-Based Approach.
Although our approach for treating conformational switch during site-specific protein-DNA binding has been implemented explicitly for an idealized model, it opens the door for realistic modeling of the DNA-binding kinetics of the many transcription factors and DNA-modifying enzymes that appear to rely on the induced-switch mechanism for rapid target search. The key to our approach is that the 3D diffusion in the bulk solution and the 1D diffusion along the DNA surface are separately considered, but with the coupling between the two regions properly accounted for. Realistic modeling will entail generating the parameters in our theory by molecular dynamics and Brownian dynamics simulations. For example, k3 can be obtained from Brownian dynamics simulations (38–40). These improved calculations of parameters will allow for quantitative comparison against experimental kinetic studies.
Supplementary Material
Acknowledgments.
This work was supported in part by Grant GM58187 from the National Institutes of Health.
Footnotes
The authors declare no conflict of interest.
*This Direct Submission article had a prearranged editor.
This article contains supporting information online at www.pnas.org/lookup/suppl/doi:10.1073/pnas.1101555108/-/DCSupplemental.
References
- 1.Ptashne M. Specific binding of the lambda phage repressor to lambda DNA. Nature. 1967;214:232–234. doi: 10.1038/214232a0. [DOI] [PubMed] [Google Scholar]
- 2.Gilbert W, Muller-Hill B. The lac operator is DNA. Proc Natl Acad Sci USA. 1967;58:2415–2421. doi: 10.1073/pnas.58.6.2415. [DOI] [PMC free article] [PubMed] [Google Scholar]
- 3.Adam G, Delbruck M. In: Structural Chemistry and Molecular Biology. Davidson N, editor. San Francisco: W.H. Freeman; 1968. pp. 198–215. [Google Scholar]
- 4.Riggs AD, Bourgeois S, Cohn M. The lac repressor-operator interaction. 3. Kinetic studies. J Mol Biol. 1970;53:401–417. doi: 10.1016/0022-2836(70)90074-4. [DOI] [PubMed] [Google Scholar]
- 5.Richter PH, Eigen M. Diffusion controlled reaction rates in spheroidal geometry. Application to repressor—operator association and membrane bound enzymes. Biophys Chem. 1974;2:255–263. doi: 10.1016/0301-4622(74)80050-5. [DOI] [PubMed] [Google Scholar]
- 6.Berg OG, Winter RB, von Hippel PH. Diffusion-driven mechanisms of protein translocation on nucleic acids. 1. Models and theory. Biochemistry. 1981;20:6929–6948. doi: 10.1021/bi00527a028. [DOI] [PubMed] [Google Scholar]
- 7.Berg OG, Ehrenberg M. Association kinetics with coupled three- and one-dimensional diffusion. Chain-length dependence of the association rate of specific DNA sites. Biophys Chem. 1982;15:41–51. doi: 10.1016/0301-4622(82)87015-4. [DOI] [PubMed] [Google Scholar]
- 8.Jack WE, Terry BJ, Modrich P. Involvement of outside DNA sequences in the major kinetic path by which EcoRI endonuclease locates and leaves its recognition sequence. Proc Natl Acad Sci USA. 1982;79:4010–4014. doi: 10.1073/pnas.79.13.4010. [DOI] [PMC free article] [PubMed] [Google Scholar]
- 9.Kim JG, Takeda Y, Matthews BW, Anderson WF. Kinetic studies on Cro repressor-operator DNA interaction. J Mol Biol. 1987;196:149–158. doi: 10.1016/0022-2836(87)90517-1. [DOI] [PubMed] [Google Scholar]
- 10.Zhou HX, Szabo A. Enhancement of association rates by nonspecific binding to DNA and cell membranes. Phys Rev Lett. 2004;93:178101. doi: 10.1103/PhysRevLett.93.178101. [DOI] [PubMed] [Google Scholar]
- 11.Coppey M, Benichou O, Voituriez R, Moreau M. Kinetics of target site localization of a protein on DNA: a stochastic approach. Biophys J. 2004;87:1640–1649. doi: 10.1529/biophysj.104.045773. [DOI] [PMC free article] [PubMed] [Google Scholar]
- 12.Slutsky M, Mirny LA. Kinetics of protein-DNA interaction: facilitated target location in sequence-dependent potential. Biophys J. 2004;87:4021–4035. doi: 10.1529/biophysj.104.050765. [DOI] [PMC free article] [PubMed] [Google Scholar]
- 13.Halford SE, Marko JF. How do site-specific DNA-binding proteins find their targets? Nucleic Acids Res. 2004;32:3040–3052. doi: 10.1093/nar/gkh624. [DOI] [PMC free article] [PubMed] [Google Scholar]
- 14.Zhou HX. A model for the mediation of processivity of DNA-targeting proteins by nonspecific binding: dependence on DNA length and presence of obstacles. Biophys J. 2005;88:1608–1615. doi: 10.1529/biophysj.104.052688. [DOI] [PMC free article] [PubMed] [Google Scholar]
- 15.Halford SE. An end to 40 years of mistakes in DNA-protein association kinetics? Biochem Soc Trans. 2009;37:343–348. doi: 10.1042/BST0370343. [DOI] [PubMed] [Google Scholar]
- 16.Mirny L, et al. How a protein searches for its site on DNA: the mechanism of facilitated diffusion. J Phy A-Math Theor. 2009;42:434013. [Google Scholar]
- 17.Hu LH, Grosberg AY, Bruinsma R. First passage time distribution for the 1D diffusion of particles with internal degrees of freedom. J Phys A-Math Theor. 2009;42:434011. [Google Scholar]
- 18.Lomholt MA, van den Broek B, Kalisch SM, Wuite GJ, Metzler R. Facilitated diffusion with DNA coiling. Proc Natl Acad Sci USA. 2009;106:8204–8208. doi: 10.1073/pnas.0903293106. [DOI] [PMC free article] [PubMed] [Google Scholar]
- 19.Murugan R. Theory of site-specific DNA-protein interactions in the presence of conformational fluctuations of DNA binding domains. Biophys J. 2010;99:353–359. doi: 10.1016/j.bpj.2010.04.026. [DOI] [PMC free article] [PubMed] [Google Scholar]
- 20.Kolomeisky AB. Physics of protein-DNA interactions: mechanisms of facilitated target search. Phys Chem Chem Phys. 2011;13:2088–2095. doi: 10.1039/c0cp01966f. [DOI] [PubMed] [Google Scholar]
- 21.Zhou HX, Szabo A. Theory and simulation of the time-dependent rate coefficients of diffusion-influenced reactions. Biophys J. 1996;71:2440–2457. doi: 10.1016/S0006-3495(96)79437-7. [DOI] [PMC free article] [PubMed] [Google Scholar]
- 22.McCammon JA, Northrup SH. Gated binding of ligands to proteins. Nature. 1981;293:316–317. doi: 10.1038/293316a0. [DOI] [PubMed] [Google Scholar]
- 23.Szabo A, Shoup D, Northrup SH, McCammon JA. Stochastically gated diffusion-influenced reactions. J Chem Phys. 1982;77:4484–4493. [Google Scholar]
- 24.Zhou HX. From induced fit to conformational selection: a continuum of binding mechanism controlled by the time scale of conformational transitions. Biophys J. 2010;98:L15–17. doi: 10.1016/j.bpj.2009.11.029. [DOI] [PMC free article] [PubMed] [Google Scholar]
- 25.Cai L, Zhou HX. Theory and simulation on the kinetics of protein-ligand binding coupled to conformational change. J Chem Phys. 2011;134:105101. doi: 10.1063/1.3561694. [DOI] [PMC free article] [PubMed] [Google Scholar]
- 26.Shoup D, Lipari G, Szabo A. Diffusion-controlled bimolecular reaction rates. The effect of rotational diffusion and orientation constraints. Biophys J. 1981;36:697–714. doi: 10.1016/S0006-3495(81)84759-5. [DOI] [PMC free article] [PubMed] [Google Scholar]
- 27.Szabo A, Schulten K, Schulten Z. First passage time approach to diffusion controlled reactions. J Chem Phys. 1980;72:4350–4357. [Google Scholar]
- 28.Gerland U, Moroz JD, Hwa T. Physical constraints and functional characteristics of transcription factor-DNA interaction. Proc Natl Acad Sci USA. 2002;99:12015–12020. doi: 10.1073/pnas.192693599. [DOI] [PMC free article] [PubMed] [Google Scholar]
- 29.Zwanzig R. Diffusion in a rough potential. Proc Natl Acad Sci USA. 1988;85:2029–2030. doi: 10.1073/pnas.85.7.2029. [DOI] [PMC free article] [PubMed] [Google Scholar]
- 30.Blainey PC, et al. Nonspecifically bound proteins spin while diffusing along DNA. Nat Struct Mol Biol. 2009;16:1224–1229. doi: 10.1038/nsmb.1716. [DOI] [PMC free article] [PubMed] [Google Scholar]
- 31.Albright RA, Mossing MC, Matthews BW. Crystal structure of an engineered Cro monomer bound nonspecifically to DNA: Possible implications for nonspecific binding by the wild-type protein. Protein Sci. 1998;7:1485–1494. doi: 10.1002/pro.5560070701. [DOI] [PMC free article] [PubMed] [Google Scholar]
- 32.Kalodimos CG, et al. Structure and flexibility adaptation in nonspecific and specific protein-DNA complexes. Science. 2004;305:386–389. doi: 10.1126/science.1097064. [DOI] [PubMed] [Google Scholar]
- 33.Horton JR, Liebert K, Hattman S, Jeltsch A, Cheng X. Transition from nonspecific to specific DNA interactions along the substrate-recognition pathway of Dam methyltransferase. Cell. 2005;121:349–361. doi: 10.1016/j.cell.2005.02.021. [DOI] [PMC free article] [PubMed] [Google Scholar]
- 34.Iwahara J, Zweckstetter M, Clore GM. NMR structural and kinetic characterization of a homeodomain diffusing and hopping on nonspecific DNA. Proc Natl Acad Sci USA. 2006;103:15062–15067. doi: 10.1073/pnas.0605868103. [DOI] [PMC free article] [PubMed] [Google Scholar]
- 35.Zharkov DO, Mechetin GV, Nevinsky GA. Uracil-DNA glycosylase: Structural, thermodynamic and kinetic aspects of lesion search and recognition. Mutat Res. 2010;685:11–20. doi: 10.1016/j.mrfmmm.2009.10.017. [DOI] [PMC free article] [PubMed] [Google Scholar]
- 36.Schreiber G, Haran G, Zhou HX. Fundamental aspects of protein-protein association kinetics. Chem Rev. 2009;109:839–860. doi: 10.1021/cr800373w. [DOI] [PMC free article] [PubMed] [Google Scholar]
- 37.Alsallaq R, Zhou HX. Protein association with circular DNA: rate enhancement by nonspecific binding. J Chem Phys. 2008;128:115108. doi: 10.1063/1.2888996. [DOI] [PubMed] [Google Scholar]
- 38.Northrup SH, Reynolds JCL, Miller CM, Forrest KJ, Boles JO. Diffusion-controlled association rate of cytochrome c and cytochrome c peroxidase in a simple electrostatic model. J Am Chem Soc. 1986;108:8162–8170. [Google Scholar]
- 39.Vijayakumar M, et al. Electrostatic enhancement of diffusion-controlled protein-protein association: comparison of theory and experiment on barnase and barstar. J Mol Biol. 1998;278:1015–1024. doi: 10.1006/jmbi.1998.1747. [DOI] [PubMed] [Google Scholar]
- 40.Elcock AH, Gabdoulline RR, Wade RC, McCammon JA. Computer simulation of protein-protein association kinetics: acetylcholinesterase-fasciculin. J Mol Biol. 1999;291:149–162. doi: 10.1006/jmbi.1999.2919. [DOI] [PubMed] [Google Scholar]
Associated Data
This section collects any data citations, data availability statements, or supplementary materials included in this article.