

Abstract
Confounding due to population stratification is a potential source of concern in population-based genetic association studies, particularly in recently admixed populations such as African Americans. Several methods have been developed to control for population stratification in the context of genome-wide association studies. Because these approaches require thousands of genotypes from genetic markers, they are not well suited to be used in genetic association analyses without genome-wide data. An alternative approach to control for population stratification is to estimate admixture proportions by using ancestral informative markers (AIMs). The authors evaluated whether a relatively small number of AIMs would be sufficient to estimate ancestral proportions in African Americans. They first estimated European admixture proportions in 1,757 subjects from the Black Women's Health Study (1995–2009) by genotyping an admixture panel of 1,373 AIMs; they then compared these results with those obtained using smaller sets of AIMs. The authors found that just 30 AIMs are needed to obtain very high correlation of estimates with the entire set (r = 0.89; P < 0.0001). A set of 200 AIMs gave an almost perfect correlation with the entire set (r = 0.98; P < 0.0001). These results show that a small number of AIMs are sufficiently precise to estimate European admixture in African Americans.
Keywords: African Americans; confounding factors (epidemiology); genetic association studies; genetics, population; molecular epidemiology
Population stratification is a potential source of concern in population-based genetic association studies. This problem is especially relevant in recently admixed groups such as African Americans, among whom variation in genetic background has been increased by the introduction of Caucasian alleles (1, 2). Methods such as genomic control (3), structured association analysis (4, 5), and principal component analysis (6) have been proposed to control for population stratification in the context of genome-wide association studies. However, these methods require the genotyping of thousands of single nucleotide polymorphisms (SNPs). Thus, they are not applicable to studies such as replication and candidate gene analyses that do not have genome-wide data.
The use of ancestral informative markers (AIMs) offers a cost-effective approach to control for population stratification when genome-wide data are unavailable and when the ancestral populations of the group under study are known (7). AIMs are genetic markers that show large allele frequency differences among the parental populations from which the present day admixed population originated. Thus, AIMs offer, on average, a greater amount of information per SNP in comparison with randomly selected SNPs from genome-wide association studies’ data. The use of AIMs allows the estimation of individual ancestry proportions as opposed to assigning subjects of mixed genetic lineage into categorical racial groups. This continuous ancestry proportion variable can then be entered into any logistic regression model to control for population stratification due to genetic admixture (7). Control for population admixture by use of AIMs requires the precise estimation of individual ancestry proportions, but the minimum number of AIMs needed to get reliable estimates is still uncertain. For African Americans, it has been proposed that 100 AIMs are enough to estimate precise individual admixture proportions (8), and it has been reported that 128 (9) and 93 AIMs (10) provide enough information to determine and control for individual ancestry in ethnically diverse populations in the United States.
In the present study, we used DNA samples from participants in the Black Women's Health Study, an ongoing prospective cohort study of African-American women, to evaluate whether a relatively small number of AIMs would be sufficient to estimate European ancestry proportions in African Americans.
MATERIALS AND METHODS
Study population
Subjects in the present study are participants in the ongoing Black Women's Health Study (11). Briefly, the study began in 1995 when women 21–69 years of age from across the United States completed a 14-page postal health questionnaire. The initial cohort comprised 59,000 women who self-identified as “black” and had a valid address. Follow-up questionnaires are sent every 2 years. Follow-up of the baseline cohort has averaged 80% or greater for each questionnaire cycle. We obtained saliva samples as a source of DNA from participants in the Black Women's Health Study using the mouthwash-swish method (12). Approximately 50% of participants, 26,814 women, provided a sample. Women who provided samples were slightly older than women who did not, but the 2 groups were similar with regard to educational level, geographic region of residence, body mass index, and family history of breast cancer.
The present study is based on DNA samples from a group of participants who served as cases in an admixture mapping study of uterine fibroids. All subjects were premenopausal women aged 21–50 years who reported uterine fibroids diagnosed by surgery or ultrasound during 1997–2009 (13). The study protocol was approved by the Institutional Review Board of Boston University.
Allele frequencies in parental populations
We estimated the allele frequencies of each AIM in the parental populations using previously published data (8, 14, 15) and data from the International HapMap Project (16). Up to 174 West African samples (from Ghana, Cameroon, and Nigeria) and 333 combined European (from Italy, Norway, and Poland) and European-American (from Baltimore, Maryland; Chicago, Illinois; and Utah) samples provided the Bayesian prior distributions of the parental populations to estimate ancestry proportions in the African-American sample (17).
Selection of ancestral informative markers
A panel of 1,509 AIMs has been described for use in admixture mapping scans in African Americans. This panel, termed the “phase 3” admixture panel, is based on original sets described by Smith et al. (8) and Reich et al. (14) and was further improved by mining of AIMs from the work of Hinds et al. (18) and the phase 2 International Haplotype Map (16). The panel has been used in other admixture mapping scans in African Americans (19–21). We excluded from consideration 27 SNPs on the panel for which parental data were inadequate or the SNPs were not in Hardy-Weinberg equilibrium in the parental data. We selected sets of 30, 60, 100, 150, and 200 AIMs (Web Table 1, which is available on the Journal’s Web site (http://aje.oxfordjournals.org/) to assess their performance relative to the whole admixture panel. For each set, we selected the AIMs with maximum allele frequency differences between European and African populations. We also selected random sets of AIMs to assess how estimates of admixture proportions are affected by the selection of less optimum markers. We selected 10 random sets of 30, 60, 100, 150, and 200 AIMs, and then we proceeded to assess their performance relative to that of the whole admixture panel.
Genotyping and quality control
DNA was isolated from mouthwash swish samples at the Boston University Molecular Core Genetics Laboratory using the QIAamp DNA Mini Kit (Qiagen, Inc., Valencia, California). Whole-genome amplification was performed with Qiagen RePLI-g Kits using the method of multiple displacement amplification. Amplified samples underwent purification and PicoGreen quantification (Life Technologies Corporation, Carlsbad, California) at the Broad Institute Center for Genotyping and Analysis (Cambridge, Massachusetts) before being plated for genotyping. All samples were genotyped at the Broad Institute Center for Genotyping and Analysis using the Illumina GoldenGate Assay in the BeadLab platform (Illumina, Inc., San Diego, California) (22).
Multiple blinded replicates were included in the plates to assess reproducibility of genotypes. An average reproducibility of 99% was obtained among the blinded duplicates. Of the initial 1,482 AIMs, we removed 109 SNPs because of a call rate of less than 95%. Of 1,762 samples, we removed samples with a call rate of less than 95% (n = 5). The final analysis included 1,373 AIMs and 1,757 samples. The mean calling rate in the final analysis was 99.5% for both AIMs and samples.
Estimation of individual admixture proportions and data analysis
We estimated individual admixture proportions using a Bayesian approach as implemented in open-source ADMIXMAP software (7, 17). For each set of AIMs, we ran the Markov chain Monte Carlo algorithm with 5,000 burn-in iterations followed by 20,000 iterations. We assessed convergence of the admixture estimates by examination of the cumulative posterior means over all the iterations (7, 17).
Pearson's correlation coefficients between the admixture estimates from the smaller sets of AIMs and the full admixture panel were estimated by using SAS, version 9, software (SAS Institute, Inc., Cary, North Carolina). Two-sided t tests were used to assess the statistical significance of correlation estimates.
RESULTS
Table 1 provides descriptive statistics of the distribution of European ancestry based on different sets of AIMs. The mean and median percentages of European ancestry were 19.8% and 17.9% based on the full admixture panel and 19.1% and 17.5% based on the set of the best 30 AIMs.
Table 1.
Distribution of European Ancestry Proportions Derived From Increasing Numbers of Ancestral Informative Markers in 1,757 Women From the Black Women's Health Study, 1995–2009
| No. of AIMs | Mean δa | European Ancestry, % |
|||
| Mean | Median | Minimum | Maximum | ||
| Best AIMs | |||||
| 30 | 0.922 | 19.1 | 17.5 | 3.7 | 59.9 |
| 60 | 0.897 | 19.5 | 17.6 | 2.6 | 67.5 |
| 100 | 0.879 | 19.6 | 17.7 | 2.1 | 71.3 |
| 150 | 0.864 | 19.8 | 17.7 | 1.9 | 70.7 |
| 200 | 0.853 | 19.7 | 17.7 | 1.5 | 73.5 |
| Random AIMsb | |||||
| 30 | 0.730 | 20.0 | 18.1 | 5.1 | 67.1 |
| 60 | 0.731 | 19.5 | 17.5 | 3.0 | 69.6 |
| 100 | 0.728 | 19.8 | 18.1 | 2.8 | 72.3 |
| 150 | 0.732 | 19.8 | 17.7 | 1.9 | 75.7 |
| 200 | 0.733 | 19.4 | 17.6 | 1.9 | 73.6 |
| Entire setc | 0.730 | 19.8 | 17.9 | 0.7 | 73.6 |
Abbreviation: AIM, ancestral informative marker.
Absolute value of allele frequency difference between African and European populations.
Results for the random AIMs are the average of 10 random sets for each number of AIMs.
The entire set consists of 1,373 AIMs.
Figure 1 gives scatterplots for individual estimates of European admixture proportion comparing the reduced set of best AIMs with the entire set. Each of the smaller best sets showed very high correlations with the estimates from the entire set of AIMs. Correlation coefficients increased from r = 0.89 for 30 AIMs to r = 0.92 for 60 AIMs to r = 0.98 for 200 AIMs. Ancestry proportions estimates using random AIMs were also highly correlated with the estimates from the entire set. Average correlations for the sets of random AIMs were r = 0.83 for 30 AIMs, r = 0.90 for 60 AIMs, r = 0.94 for 100 AIMs, r = 0.96 for 150 AIMs, and r = 0.97 for 200 AIMs.
Figure 1.
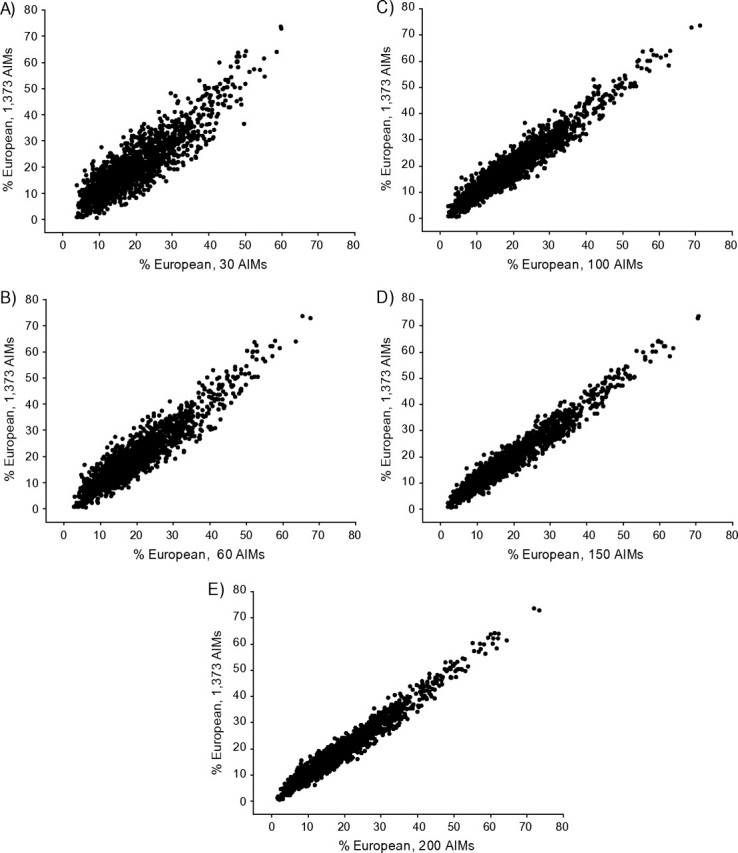
Scatterplots of the estimates of individual European ancestry proportions in 1,757 women of the Black Women's Health Study (1995–2009) using the complete panel of 1,373 ancestral informative markers (AIMs) in comparison with the estimates using the smaller sets of the best 30 AIMs (A), 60 AIMs (B), 100 AIMs (C), 150 AIMs (D), and 200 AIMs (E). Pearson's correlation coefficients between the admixture estimates from the full admixture panel and the smaller sets of best AIMs were r = 0.89 (P < 0.0001) for 30 AIMs, r = 0.93 (P < 0.0001) for 60 AIMs, r = 0.96 (P < 0.0001) for 100 AIMs, r = 0.97 (P < 0.0001) for 150 AIMs, and r = 0.98 (P < 0.0001) for 200 AIMs.
DISCUSSION
In the present study, we sought to evaluate whether a relatively small number of AIMs would be sufficient to obtain precise estimates of European ancestry in African-American individuals. Our results show that as few as 30 highly informative markers provide almost the same estimates as do a set of 1,373 AIMs. The present results have important implications for control of confounding due to population admixture in African-American populations. Our findings indicate that European ancestry can be precisely estimated in African Americans by using as few as 30 AIMs, allowing cost-effective control of confounding due to population admixture. Because of the relatively high amount of information per AIM (i.e., they show large allele frequency differences between African and European populations), even a randomly selected set of 30 AIMs allowed us to estimate European ancestry proportions with good precision, although to a lesser degree than the set of best AIMs.
We note that our estimates of European ancestry proportions (e.g., mean and range) are similar to the estimates reported in previous studies in African Americans involving a variety of different conditions (8, 14, 15, 19, 23). Thus, even though the present analyses were based on samples from women diagnosed with uterine fibroids, the findings are likely generalizable to other populations of African Americans.
In our analyses, we treated the African component as a single group, and it is known that African-American individuals may have ancestry from different regions of West Africa (1, 2). Thus, controlling for percentage of European ancestry would not address possible confounding because of this more subtle population stratification. However, the degree of ancestry variation from different African regions may be a relatively small component of the total genetic variation in African-American populations. It has been estimated that ∼90% of the total African ancestry in African-American individuals is from Niger-Kordofanian ancestry (2) (the Niger-Kordofanian is a macrofamily language spoken throughout sub-Saharan Africa), and Niger-Kordofanian speakers tend to be more genetically homogeneous compared with other African groups (2). It is noteworthy that, in a recent genome-wide association study of hypertension and blood pressure in African Americans, the first principal component of genetic variation was approximately 5 times higher than the second principal component (an eigenvalue of ∼10 for the first principal component compared with an eigenvalue of ∼2 for the second principal component) (24), supporting the notion that most of the genetic variation in African-American individuals is observed along a single axis of variation.
Even though finer subpopulation stratification beyond that given for recent European admixture may exist in African-American subjects, its effects, if any, on genetic association studies are still unclear. An early theoretical study found that the impact of confounding for population stratification tends to decrease as the number of subpopulations increases (25). Using the genomic control method, the genome-wide association studies in hypertension and blood pressure in African-American individuals found an inflation factor of 1.007 for hypertension, 1.001 for systolic blood pressure, and 0.998 for diastolic blood pressure (24). There were no major differences in the unadjusted and genomic control-adjusted results (24). A recent study that measured population stratification in human populations and its effects on genome-wide association studies suggests that confounding by population stratification in African Americans may be less problematic than initially thought, and that adjusting by a principal components method may unnecessarily reduce the statistical power of the genome-wide association studies (26).
In summary, our results show that a small number of AIMs (as low as 30) are enough to obtain reliable estimates of European ancestry in African-American individuals. Because most of the genetic variation in African-American subjects is related to European ancestry, this small set of AIMs may effectively control for confounding by population stratification.
Supplementary Material
Acknowledgments
Author affiliations: Slone Epidemiology Center at Boston University, Boston, Massachusetts (Edward A. Ruiz-Narváez, Lynn Rosenberg, Lauren Wise, Julie R. Palmer); Department of Epidemiology, Boston University School of Public Health, Boston, Massachusetts (Edward A. Ruiz-Narváez, Lynn Rosenberg, Lauren Wise, Julie R. Palmer); Department of Genetics, Harvard Medical School, Boston, Massachusetts (David Reich); and Program in Medical and Population Genetics, Broad Institute of Harvard University and Massachusetts Institute of Technology, Cambridge, Massachusetts (David Reich).
This work was supported by grants R01CA058420 and R01CA098663 from the Division of Cancer Control and Population Science, National Cancer Institute (http://www.cancercontrol.cancer.gov), and by grant R01HD057966 from the National Institute of Child Health and Human Development. The Broad Institute Center for Genotyping and Analysis is supported by grant U54 RR020278 from the National Center for Research Resources (http://www.broadinstitute.org/sections/science/projects/broad/ncrr-center-genotyping-analysis).
The content is solely the responsibility of the authors and does not necessarily represent the official views of the National Cancer Institute, the National Institute of Child Health and Human Development, or the National Institutes of Health.
Conflict of interest: none declared.
Glossary
Abbreviations
- AIM
ancestral informative marker
- SNP
single nucleotide polymorphism
References
- 1.Bryc K, Auton A, Nelson MR, et al. Genome-wide patterns of population structure and admixture in West Africans and African Americans. Proc Natl Acad Sci U S A. 2010;107(2):786–791. doi: 10.1073/pnas.0909559107. [DOI] [PMC free article] [PubMed] [Google Scholar]
- 2.Tishkoff SA, Reed FA, Friedlaender FR, et al. The genetic structure and history of Africans and African Americans. Science. 2009;324(5930):1035–1044. doi: 10.1126/science.1172257. [DOI] [PMC free article] [PubMed] [Google Scholar]
- 3.Devlin B, Roeder K. Genomic control for association studies. Biometrics. 1999;55(4):997–1004. doi: 10.1111/j.0006-341x.1999.00997.x. [DOI] [PubMed] [Google Scholar]
- 4.Pritchard JK, Rosenberg NA. Use of unlinked genetic markers to detect population stratification in association studies. Am J Hum Genet. 1999;65(1):220–228. doi: 10.1086/302449. [DOI] [PMC free article] [PubMed] [Google Scholar]
- 5.Pritchard JK, Stephens M, Rosenberg NA, et al. Association mapping in structured populations. Am J Hum Genet. 2000;67(1):170–181. doi: 10.1086/302959. [DOI] [PMC free article] [PubMed] [Google Scholar]
- 6.Price AL, Patterson NJ, Plenge RM, et al. Principal components analysis corrects for stratification in genome-wide association studies. Nat Genet. 2006;38(8):904–909. doi: 10.1038/ng1847. [DOI] [PubMed] [Google Scholar]
- 7.Hoggart CJ, Parra EJ, Shriver MD, et al. Control of confounding of genetic associations in stratified populations. Am J Hum Genet. 2003;72(6):1492–1504. doi: 10.1086/375613. [DOI] [PMC free article] [PubMed] [Google Scholar]
- 8.Smith MW, Patterson N, Lautenberger JA, et al. A high-density admixture map for disease gene discovery in African Americans. Am J Hum Genet. 2004;74(5):1001–1013. doi: 10.1086/420856. [DOI] [PMC free article] [PubMed] [Google Scholar]
- 9.Kosoy R, Nassir R, Tian C, et al. Ancestry informative marker sets for determining continental origin and admixture proportions in common populations in America. Hum Mutat. 2009;30(1):69–78. doi: 10.1002/humu.20822. [DOI] [PMC free article] [PubMed] [Google Scholar]
- 10.Nassir R, Kosoy R, Tian C, et al. An ancestry informative marker set for determining continental origin: validation and extension using human genome diversity panels [electronic article] BMC Genet. 2009;10:39. doi: 10.1186/1471-2156-10-39. . (doi:10.1186/1471-2156-10-39) [DOI] [PMC free article] [PubMed] [Google Scholar]
- 11.Palmer JR, Wise LA, Horton NJ, et al. Dual effect of parity on breast cancer risk in African-American women. J Natl Cancer Inst. 2003;95(6):478–483. doi: 10.1093/jnci/95.6.478. [DOI] [PubMed] [Google Scholar]
- 12.Cozier YC, Palmer JR, Rosenberg L. Comparison of methods for collection of DNA samples by mail in the Black Women's Health Study. Ann Epidemiol. 2004;14(2):117–122. doi: 10.1016/S1047-2797(03)00132-7. [DOI] [PubMed] [Google Scholar]
- 13.Wise LA, Palmer JR, Stewart EA, et al. Age-specific incidence rates for self-reported uterine leiomyomata in the Black Women's Health Study. Obstet Gynecol. 2005;105(3):563–568. doi: 10.1097/01.AOG.0000154161.03418.e3. [DOI] [PMC free article] [PubMed] [Google Scholar]
- 14.Reich D, Patterson N, De Jager PL, et al. A whole-genome admixture scan finds a candidate locus for multiple sclerosis susceptibility. Nat Genet. 2005;37(10):1113–1118. doi: 10.1038/ng1646. [DOI] [PubMed] [Google Scholar]
- 15.Freedman ML, Haiman CA, Patterson N, et al. Admixture mapping identifies 8q24 as a prostate cancer risk locus in African-American men. Proc Natl Acad Sci U S A. 2006;103(38):14068–14073. doi: 10.1073/pnas.0605832103. [DOI] [PMC free article] [PubMed] [Google Scholar]
- 16.International HapMap Consortium, Frazer KA, Ballinger DG, et al. A second generation human haplotype map of over 3.1 million SNPs. Nature. 2007;449(7164):851–861. doi: 10.1038/nature06258. [DOI] [PMC free article] [PubMed] [Google Scholar]
- 17.McKeigue PM, Carpenter JR, Parra EJ, et al. Estimation of admixture and detection of linkage in admixed populations by a Bayesian approach: application to African-American populations. Ann Hum Genet. 2000;64(pt 2):171–186. doi: 10.1017/S0003480000008022. [DOI] [PubMed] [Google Scholar]
- 18.Hinds DA, Stuve LL, Nilsen GB, et al. Whole-genome patterns of common DNA variation in three human populations. Science. 2005;307(5712):1072–1079. doi: 10.1126/science.1105436. [DOI] [PubMed] [Google Scholar]
- 19.Cheng CY, Reich D, Coresh J, et al. Admixture mapping of obesity-related traits in African Americans: the Atherosclerosis Risk in Communities (ARIC) Study. Obesity (Silver Spring) 2010;18(3):563–572. doi: 10.1038/oby.2009.282. [DOI] [PMC free article] [PubMed] [Google Scholar]
- 20.Cheng CY, Kao WH, Patterson N, et al. Admixture mapping of 15,280 African Americans identifies obesity susceptibility loci on chromosomes 5 and X [electronic article] PLoS Genet. 2009;5(5):e1000490. doi: 10.1371/journal.pgen.1000490. . (doi:10.1371/journal.pgen.1000490) [DOI] [PMC free article] [PubMed] [Google Scholar]
- 21.Fejerman L, Haiman CA, Reich D, et al. An admixture scan in 1,484 African American women with breast cancer. Cancer Epidemiol Biomarkers Prev. 2009;18(11):3110–3117. doi: 10.1158/1055-9965.EPI-09-0464. [DOI] [PMC free article] [PubMed] [Google Scholar]
- 22.Fan JB, Oliphant A, Shen R, et al. Highly parallel SNP genotyping. Cold Spring Harb Symp Quant Biol. 2003;68:69–78. doi: 10.1101/sqb.2003.68.69. [DOI] [PubMed] [Google Scholar]
- 23.Shriver MD, Parra EJ, Dios S, et al. Skin pigmentation, biogeographical ancestry and admixture mapping. Hum Genet. 2003;112(4):387–399. doi: 10.1007/s00439-002-0896-y. [DOI] [PubMed] [Google Scholar]
- 24.Adeyemo A, Gerry N, Chen G, et al. A genome-wide association study of hypertension and blood pressure in African Americans [electronic article] PLoS Genet. 2009;5(7):e1000564. doi: 10.1371/journal.pgen.1000564. . (doi:10.1371/journal.pgen.1000564) [DOI] [PMC free article] [PubMed] [Google Scholar]
- 25.Wacholder S, Rothman N, Caporaso N. Population stratification in epidemiologic studies of common genetic variants and cancer: quantification of bias. J Natl Cancer Inst. 2000;92(14):1151–1158. doi: 10.1093/jnci/92.14.1151. [DOI] [PubMed] [Google Scholar]
- 26.Hao K, Chudin E, Greenawalt D, et al. Magnitude of stratification in human populations and impacts on genome wide association studies [electronic article] PLoS One. 2010;5(1):e8695. doi: 10.1371/journal.pone.0008695. . (doi:10.1371/journal.pone.0008695) [DOI] [PMC free article] [PubMed] [Google Scholar]
Associated Data
This section collects any data citations, data availability statements, or supplementary materials included in this article.