

Abstract
The severity of numerous developmental abnormalities can vary widely despite shared genetic causes. Mice deficient in Twisted gastrulation (Twsg1−/−) display such phenotypic variation, developing a wide range of craniofacial malformations on an isogenic C57BL/6 strain background. To examine the molecular basis for this reduced penetrance and variable expressivity, we used exon microarrays to analyze gene expression in mandibular arches from several distinct, morphologically defined classes of Twsg1−/− and wild type (WT) embryos. Hierarchical clustering analysis of transcript levels identified numerous differentially expressed genes, clearly distinguishing severely affected and unaffected Twsg1−/− mutants from wild type (WT) embryos. Several genes that play well-known roles in craniofacial development were upregulated in unaffected Twsg1−/− mutant embryos, suggesting that they may compensate for the loss of TWSG1. Imprinted genes were overrepresented among genes that were differentially expressed particularly between affected and unaffected mutants. The most severely affected embryos demonstrated increased p53 signaling and increased expression of its target, Trp53inp1. The frequency of craniofacial defects significantly decreased with a reduction of p53 gene dosage from 44% in Twsg1−/−p53+/+ pups (N=675) to 30% in Twsg1−/−p53+/− (N=47, p=0.04) and 15% in Twsg1−/−p53−/− littermates (N=39, p=0.001). In summary, these results demonstrate that phenotypic variability in Twsg1−/− mice is associated with differential expression of certain developmentally regulated genes, and that craniofacial defects can be partially rescued by reduced p53 levels. We postulate that variable responses to stress may contribute to variable craniofacial phenotypes by triggering differential expression of genes and variable cellular apoptosis.
Keywords: Twsg1, BMP, P53, stress, phenotypic variation, craniofacial, neural crest
INTRODUCTION
Phenotypic variation is a well-known phenomenon in a number of developmental abnormalities. For example, patients with Treacher-Collins syndrome or holoprosencephaly (HPE) have an extremely wide range of clinical manifestations (Hansen et al., 1996; Muenke and Cohen, 2000; Roessler et al., 1996). In HPE, the most severe defects, such as cyclopia, are usually incompatible with life, while others including hypotelorism or microphthalmia represent milder forms (Ming et al., 2002). However, the molecular basis for such reduced penetrance and variable severity, even in the context of the same mutations on the same genetic background, has remained unclear.
Differences in genetic background and environmental influences are thought to be two major drivers of transcriptional variation, leading to phenotypic variation or reduced penetrance in both humans and mice (Butchbach et al., 2009; Champy et al., 2008). The contribution of epigenetic phenonema, including DNA methylation and histone modification, has also been increasingly recognized to be an important mechanism underlying variability in genetic expressivity, particularly in the case of imprinted genes (Dindot et al., 2009; Peaston and Whitelaw, 2006). For example, craniofacial manifestations of the Silver-Russell syndrome correlate with the degree of methylation at the H19-(Insulin-like Growth Factor) IGF2 locus (Bruce et al., 2009). This underscores the importance of a better understanding of the basis of phenotypic variation of craniofacial malformations and identification of mammalian models that would facilitate such insights. An advantage in using inbred mouse models to study such phenotypic variation is that both strain differences and environmental differences can be controlled.
We previously reported that disruption of Twisted gastrulation (Twsg1), a modulator of BMP signaling, in mice leads to a spectrum of craniofacial defects on an isogenic, inbred C57BL/6 background (MacKenzie et al., 2009; Petryk et al., 2004). Within a single litter, some mice are born with normal craniofacial structures; some have mild defects, such as micrognathia and microphthalmia; and still others have profound craniofacial abnormalities including anterior truncation, cyclopia, agnathia, and HPE. While some of this variation could be attributed to a variable extent of apoptosis and thus variable loss of first branchial arch 1 (BA1) derivatives (MacKenzie et al., 2009), the underlying molecular mechanisms are not entirely understood. Manifestation of craniofacial defects is highly strain background-dependent and appears in about 40% of Twsg1−/− mice on the C57BL/6 background. In early generations after derivation of the mutant allele on the C57BL/6 background, some as yet undiscovered modifier gene/s could partially account for the observed variation. However, this variation has persisted despite serial backcrossing of the mutant alleles onto the isogenic strain background. The ongoing occurrence of extreme differences in phenotypes, even within the same litter, raises the question of how phenotypic variation might occur despite virtually no differences in inherited genes. The Twsg1 mutant mouse model provides an excellent, well-controlled experimental system in which to study the molecular mechanisms underlying the resulting phenotypic variation and reduced penetrance.
In this study, we have analyzed transcriptional changes that are associated with development of distinct classes of craniofacial phenotypes in Twsg1 mutant mice. We anticipated that these differentially expressed transcripts would include previously unknown effectors of the mutant phenotype as well as genes that may compensate for the loss of TWSG1 and account for incomplete penetrance of Twsg1 mutation. In particular, we were interested in identifying transcriptional differences between unaffected and affected mutants that would shed light on potential mechanisms that allow an organism to cope with a predisposition to disease.
MATERIAL AND METHODS
Mice and tissue collection
Generation and genotyping of mice deficient for TWSG1 (Petryk et al., 2004), p53 (Donehower et al., 1992) as well as transgenic Sox10Cre mice that express Cre recombinase in neural crest cells (NCC) (Matsuoka et al., 2005) have been previously reported. To generate mice with NCC-specific deletion of Twsg1 (Twsg1flox/flox;Sox10Cre), mice carrying a conditional allele of Twsg1 (Twsg1flox/flox), with exon 4 (coding exon 3) flanked by loxP sites, were mated to Sox10-Cre mice to generate Twsg1flox/WT;Sox10Cre, which were then mated to Twsg1flox/flox mice. All strains were on C57BL/6 background. Presence of a spermatic plug was counted as day 0.5 post conception (E0.5). Twsg1−/− embryos were classified as previously published as class A (phenotypically the same as wild type), class B (moderately affected), and class C (severely affected) (MacKenzie et al., 2009). For microarray analysis, mandibular prominences of BA1s from mutants of various phenotypic classes and WT embryos at E10.5 were dissected by cutting the BA1 at the junction between the maxillary and mandibular components using alkali etched tungsten needles. BA1s were flash-frozen in liquid nitrogen and stored at −80°C. Both maxillary and mandibular prominences were dissected at E11.5 to confirm deletion of exon 4 of Twsg1 in NCC-derived tissues. This embryonic stage was chosen to allow the analysis of individual samples in case of variable efficiency of Cre-mediated recombination. Use and care of the mice in this study was approved by the University of Minnesota Institutional Animal Care and Use Committee.
RNA isolation
Frozen tissue samples were thawed in Trizol reagent (Invitrogen, Carlsbad, CA) and pooled according to the phenotypic class. RNA was purified using RNeasy micro kit spin columns (Qiagen, Valencia, CA). Five biological replicates of each mutant class and of WT (each representing a pool of 4–7 arches) were analyzed to achieve adequate statistical power for this microarray analysis (Pavlidis et al., 2003). Pooling was necessary to allow collection of sufficient RNA for microarray analysis (Bobola et al., 2003; Feng et al., 2009).
Microarray analysis
Microarray analysis was performed at the Kimmel Cancer Center Cancer Genomics Core Facility, Thomas Jefferson University (Philadelphia, PA). Total RNA (50 ng) was used to prepare amplified cDNA using the WT-Ovation Pico RNA amplification system (NuGen Technologies, Inc., San Carlos, CA). Sense transcript cDNA (ST-cDNA) was generated from 3 μg of amplified cDNA. Finally, 5.0 μg ST-cDNAs were labeled using FL-Ovation cDNA biotin module v2 (NuGen Technologies, Inc.) (Linton et al., 2009). Affymetrix GeneChip mouse exon 1.0 ST arrays (Affymetrix, Santa Clara, CA) were used following manufacturer’s recommendations. Samples were hybridized overnight, scanned and processed using Command Console Software. Background correction and normalization were done using Robust Multichip Average (RMA) with Genespring v10.0 software (Agilent, Palo Alto, CA, USA).
Bioinformatics analysis
mRNA expression profile data were condensed using RMA to generate raw expression values log base 2. Two group T-tests were used to assess significance in pairwise comparisons between groups with correction for a false discovery rate (FDR) of 10% or less (Benjamini and Hochberg, 1995). For inclusion in WT vs. C and A vs. C analyses, genes were also required to have an absolute value of fold change ≥1.5. Heatmaps were generated using Cluster3.0 and JavaTreeview. Expression profiles were clustered in both supervised and unsupervised methods to identify molecular patterns present in the data. Ingenuity Pathways Analysis (IPA; Ingenuity® Systems, www.ingenuity.com) was used to identify biological functions regulated by differentially expressed genes.
Quantitative PCR
Reverse transcription was carried out with the Thermoscript RT kit (Invitrogen) priming with random hexamers, followed by quantitative PCR (Q-PCR, MX3000p, Agilent, LaJolla, CA) using expression assays from Applied Biosystems (Foster City, CA) for Bambi (Mm03024088_g1), Bmp4 (Mm00432087_m1), Bmpr1b (Mm03023971_m1), Cyp26a1 (Mm00514486_m1), Dkk1 (Mm00438422_m1), Gpr50 (Mm00439147_m1), Peg3 (Mm00493299_s1), Plagl1 (Mm00494250_m1), Satb2 (Mm00507337_m) or using published primer sequences with SYBR green RT2 master mix (SABiosciences, Valencia, CA) for Dlk1, Igf2 (Varrault et al., 2006), and Msx2 (Berdal et al., 2009). To detect Twsg1, the following primers were used (forward: 5′-CTGAACTGGAACATCGTCTC-3′, reverse: 5′-GCAGTCATCAAAGTAAACCAC-3′). Trp53inp1was detected with primers from the MGH primer bank (Spandidos et al., 2010) (PrimerBank ID 11230806a1; forward: 5′-AAGTGGTCCCAGAATGGAAGC-3′, reverse: 5′ – GGCGAAAACTCTTGGGTTGT-3′). All samples were normalized to GAPDH (forward: 5′-TGCACCACCAACTGCTTAG-3′, reverse: 5′-GATGCAGGGATGATGTTC-R for SYBR green assays; Applied Biosystems 4352339E for TaqMan assays). Assays were run in triplicate using N≥3 pooled cDNA samples per probe.
In situ hybridization
In situ hybridization was performed by standard methods (Sasaki and Hogan, 1993). cDNA probe fragments for Plagl1 (Tsuda et al., 2004), Peg3 (Kuroiwa et al., 1996) and Satb2 (FitzPatrick et al., 2003) were amplified from a cDNA library obtained from E10.5 embryos and cloned into the pCRII-TOPO vector (Invitrogen). A probe for Dkk1 was a gift from Dr. William Shawlot (Finley et al., 2003). Msx2 probe was previously published (MacKenzie et al., 1992). Clones were transcribed to generate digoxigenin labeled probes using a DIG RNA labeling kit (Roche). At least 2–3 embryos were evaluated in each phenotypic class per probe.
Western Blotting
E10.5 embryos were isolated from pregnant females set up in timed matings, in ice-cold Tris buffered saline with EDTA (50 mM TrisHCl pH7.4, 150mM NaCl, 1mM EDTA). Embryos were homogenized in lysis buffer (Tris buffered saline with 1% TritonX-100), centrifuged for 10 min at 10,000 g at 4°C, and supernatants were electrophoresed in a 10% polyacrylamide gel using the NextGel system (Amresco, Solon, OH). Proteins were transferred to ImmobilonFL PVDF membranes (Millipore, Billerica, MA) and probed with an anti p53 mouse monoclonal antibody at 1:1000 (clone 1C12, #2524, CellSignaling Beverly, MA). The immunoblot was imaged with HRP conjugated anti mouse IgG secondary at 1:2500 (Promega, Madison, WI) and peroxide/luminol chemiluminescence with the SuperSignal West Pico kit (Pierce/Thermofisher, Rockford, IL). For loading control blots were re-probed with mouse monoclonal anti-GAPDH (AM4300, Ambion, Foster City, CA) and imaged with goat anti mouse secondary conjugated to IR800 fluorophore on the LICOR Odyssey system (Lincoln, NE). Three samples per phenotypic class were analyzed.
Statistical analyses
Student’s t-tests and Pearson’s correlations of Q-PCR data were performed in Prism 4 (GraphPad Software, LaJolla, CA). Significance was set at p<0.05. The incidence of Mendelian ratios and normal vs. abnormal phenotype incidence for Twsg1;p53 mice were compared using Chi-squared analyses and Chi-squared goodness of fit tests.
RESULTS
Transcriptional changes correlate with classes of phenotypic severity
We previously classified Twsg1−/− embryos based on the severity of the phenotype into three classes at E9.5 (MacKenzie et al., 2009). Similarly, at E10.5, class A (unaffected) mutant embryos are morphologically indistinguishable from normal, wild type (WT) embryos, while class B embryos exhibit partial midline fusion of the mandibular components of BA1, and class C embryos have severe midline fusion (Fig. 1A). To determine if these phenotypic classes are associated with differences between their transcriptomes, we used mouse exon microarrays to analyze total RNAs isolated from BA1 samples at E10.5. Differences in gene expression between the classes increased with increasing phenotypic severity, and thus were greatest in the most severely affected (class C) embryos (Fig. 1B).
Figure 1. Association between phenotypic classes and expression differences.
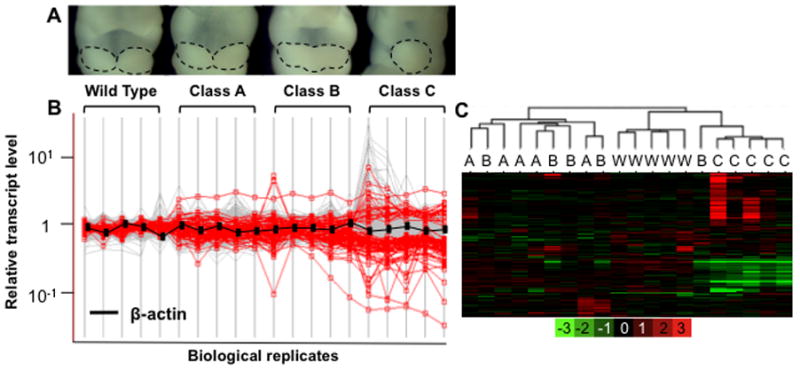
(A) Morphological differences between phenotypic classes of E10.5 embryos are displayed. Dotted lines outline the mandibular components of BA1. (B): Gene expression levels are expressed on a log10 scale (y-axis) vs. an average of WT samples (Y=1) for a given gene. Each vertical line represents a biological replicate from given phenotypic classes (WT, A, B, or C). Genes that are differentially expressed between WT and class C, based on a fold change of 1.5 fold or greater and a false discovery rate of 10% or less, are highlighted (red). Compared with WT gene expression levels, variation is greatest in the most severely affected embryos (class C). (C) Unsupervised hierarchical clustering of array data. Class C samples are clearly separated from WT and class A samples. Class B represents an intermediate phenotype, clustering alternatively with either A or C. The log2 scale of the expression values is shown in the key at the bottom.
Hierarchical clustering analysis was performed on the transcript expression profiles of a set of 127 genes exhibiting the greatest differences in expression between any two pools (Fig. 1C). This analysis clearly distinguished class C phenotypic samples from WT and class A samples. In fact, the clustering algorithm placed class A embryos just as distantly from WT as class C from WT, implying that gene expression differences in class A embryos, albeit not as pronounced as in class C, may be sufficient to compensate for the Twsg1−/− genetic predisposition. Class B samples, representing an intermediate phenotype, clustered alternatively with either class A or class C. These results demonstrate that the variable morphological features of individual embryos with the same genetic mutations in Twsg1 on the same genetic background are associated strongly with distinct transcriptional profiles.
Identification of molecular and cellular effectors of craniofacial phenotype in Twsg1 mutants
To study the association between phenotypic variability and differential gene expression in more detail, we first focused upon samples representing the most divergent morphological classes, i.e. WT vs. class C embryos. Microarray analysis identified 65 genes (represented by 66 exon probe sets, including two sets for Rgs5) with significantly different, reproducible patterns of expression between these classes (Fig. 2A and Supplemental Table 1). While most of these full-length transcripts (82%) are downregulated in class C embryos, 12 transcripts (18%) are increased. To validate results from microarrays, we performed Q-PCR on selected, differentially expressed transcripts. The results closely corroborated those from microarrays (r=0.9541, p<0.0001) (Fig. 2B-G). This high degree of reproducibility of the microarray data was confirmed further using independently isolated mRNAs, by re-measuring expression levels of G-protein-coupled receptor 50 (Gpr50), Bmp4, and BMP receptor, type 1B (Bmpr1b) by Q-PCR (Fig 2H). Again, a high concordance between microarray and Q-PCR results exists across the different phenotypic classes (r=0.9321, p=0.0003) (Fig. 2H).
Figure 2. Gene expression differences between wild type and severely affected mutants.
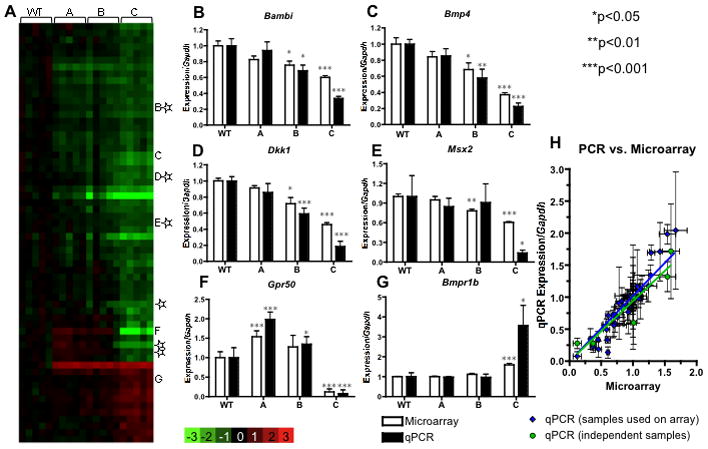
(A) A heatmap displays gene expression changes compared to the average of WT. Genes with expression changes >1.5 fold and with a false discovery rate of <10% are presented as rows. Each column represents a biological replicate. (B–G) Q-PCR confirmation; ✩genes confirmed by in situ hybridization in Fig. 4; *significance in comparison with WT. (H) Scatter plot showing close correlation between microarray data and Q-PCR data for genes in panels B–G (blue) and independent RNA samples (green) for Gpr50, Bmp4 and Bmpr1b.
Among those genes that are differentially expressed between WT and class C mutants, 15 are known to be associated with craniofacial defects in mice and/or humans (Table 1), as annotated by Mouse Genome Informatics (MGI) and Online Mendelian Inheritance in Man (OMIM). Several encode ligands (Bmp4, Bmp5), receptors (Bmpr1b) and downstream targets of BMP signaling (Msx2; Pitx2) (Du and Yip, 2009; Schlange et al., 2002), which is consistent with the known role of TWSG1 in modulating BMP signaling (Ross et al., 2001). Beyond confirming an expected role for BMPs in Twsg1−/− phenotypes, transcriptome analysis facilitated identification of additional candidate effectors of the craniofacial phenotype in Twsg1−/− mice. For example, there is an inverse correlation between Dkk1 expression and increasing phenotypic severity. Other genes showing a similar pattern to Dkk1 include Alx1 (Zhao et al., 1996), Gata3 (Pandolfi et al., 1995), Isl1 (Pfaff et al., 1996), or Pitx2 (Sclafani et al., 2006), each known to play various roles in BA1 development, palate and craniofacial bone morphology.
Table 1.
Human and mouse craniofacial phenotypes associated with genes showing altered expression in Twsg1−/− mice.
| Name | WTvC only | Both | AvC only | Associated human syndrome features (OMIM) | Mouse knockout phenotype (MGI) | Relative expression | |||
|---|---|---|---|---|---|---|---|---|---|
| A/WT | B/WT | C/WT | C/A | ||||||
| Alx1 | X | short mandible and maxilla, abnormal calvaria, facial clefting | 0.87 | 0.51a | 0.24c | 0.27c | |||
| Bmp4 | X | Microphthalmia/anopthalmia (OMIM #607932), orofacial clefting (OMIM #600625) | shortened frontal and nasal bones, agnathia | 0.84 | 0.68 a | 0.37 c | 0.44 c | ||
| Bmp5 | X | small ears, small skull, short nasal bone, short mandible, short maxilla, abnormal hyoid | 0.67b | 0.58 b | 0.56 c | 0.84 | |||
| Bmpr1b | X | short snout | 1.01 | 1.11 | 1.59 c | 1.58 c | |||
| Cyp26a1 | X | branchial arch hypoplasia, abnormal facial/head morphology, microcephaly | 0.93 | 1.1 | 1.68 c | 1.81 c | |||
| Dkk1 | X | absent mandible, maxilla, nasal bone, abnormal calvaria and BA1 morphology, microcephaly | 0.91 | 0.70 a | 0.46 c | 0.50 c | |||
| Dlk1 | X | Facial malformations (OMIM 176290) | 1.24a | 1.0 | 0.58 c | 0.47 c | |||
| Evi1 | X | abnormal branchial arch morphology | 1.21 a | 1.16 a | 0.79 c | 0.66 c | |||
| Eya4 | X | abnormal palate morphology | 1.19 | 1.06 a | 0.69 c | 0.58 c | |||
| Gata3 | X | abnormal craniofacial bone morphology | 0.96 | 0.73 a | 0.51 c | 0.53 c | |||
| Igf2 | X | Silver Russell Syndrome (OMIM #180860), micrognathia, cleft palate (Bruce et. al 2009) | variable cleft palate with (maternal) uniparental disomy 7 | 1.12 | 0.92 | 0.70 c | 0.63 c | ||
| Isl1 | X | abnormal branchial arch morphology | 0.74 b | 0.48b | 0.30 c | 0.42 c | |||
| Lhx8 | X | cleft palate | 1.35c | 1.25* | 0.56* | 0.41 b | |||
| Lrig3 | X | abnormal craniofacial morphology, short snout | 1.09 a | 1.19 b | 1.52 c | 1.39 c | |||
| Msx2 | X | Craniosynostosis type 2 (OMIM #604757) | abnormal craniofacial development, cleft palate, short snout, abnormal calvaria, teeth, middle ear ossicles | 0.95 | 0.78 b | 0.61 c | 0.64 c | ||
| Pitx2 | X | Axenfeld-Rieger syndrome (OMIM #180500), eye abnormalities, dental and maxillary hypoplasia | abnormal Meckel’s cartilage, mandible, maxilla, teeth, cleft palate | 0.84 b | 0.82 | 0.64 c | 0.76 c | ||
| Prrx2 | X | micrognathia, abnormal maxilla, Meckel’s cartilage, middle ear ossicles, hyoid, ears, teeth, cleft palate | 1.08 | 1.09 | 0.69 c | 0.63 c | |||
| Ptch1 | X | Holoprosencephaly (OMIM #610828) | Abnormal craniofacial morphology, abnormal mandible, BA1 | 1.16 | 0.85 | 0.77 a | 0.66 c | ||
| Satb2 | X | Isolated cleft palate (OMIM #119540) | micrognathia, premaxilla hypoplasia, abnormal nasal capsule, microcephaly, cleft palate, tooth abnormalities, short snout | 1.42 b | 0.93 | 0.33 c | 0.23 c | ||
| Sema3e | X | CHARGE syndrome (OMIM #214800), facial dysmorphism, external ear abnormalities | 0.89 b | 1.08 | 1.5 b | 1.7 c | |||
| Sox2 | X | microphthalmia/anopthalmia (OMIM 184429) | abnormal palate morphology | 0.71 c | 0.7 a | 0.59 b | 0.84 | ||
| Tbx22 | X | X-linked cleft palate (OMIM #303400) with or without ankyloglossia | abnormal calvaria, cleft palate | 1.29 | 1.32 | 0.48 b | 0.37 b | ||
Alx1, ALX homeobox 1; Bmp4, bone morphogenetic protein 4; Bmp5, bone morphogenetic protein 5; Bmpr1b, bone morphogenetic protein receptor, type 1B; Cyp26a1, cytochrome P450, family 26, subfamily a, polypeptide 1; Dkk1, dickkopf homolog 1 (Xenopus laevis) or predicted gene, EG546723 or protein phosphatase 1, regulatory (inhibitor) subunit 2 (Ppp1r2); Dlk1, delta-like 1 homolog (Drosophila); Evi1, ecotropic viral integration site 1; Eye4, eyes absent 4 homolog (Drosophila); Gata3, GATA binding protein 3; Igf2, insulin-like growth factor 2; Isl1, ISL1 transcription factor, LIM/homeodomain; Lhx8, LIM homeobox protein 8; Lrig3, leucine-rich repeats and immunoglobulin- like domains 3; Msx2, homeobox, msh-like 2 or LOC100046255, similar to homeobox protein; Pitx2, paired-like homeodomain 2; Prrx2, paired related homeobox 2; Ptch1, patched homolog 1; Satb2, special AT-rich sequence binding protein 2; Sema3e, sema domain, immunoglobulin domain (Ig), short basic domain, secreted, (semaphorin) 3E or hypothetical protein LOC100044162; Sox2, SRY (sex determining region Y)-box 2; Tbx22, T-box 22.
p<0.05,
p<0.01,
p<0.001,
The genes that are differentially expressed between class C and WT regulate a number of biological processes that are important for normal craniofacial morphogenesis (Supplemental Table 2; top 12 molecular and cellular functions represented by at least 3 molecules are shown based on the p value), including apoptosis, which was identified previously as a key cellular process that is altered in Twsg1−/− mice (MacKenzie et al., 2009). In addition, a significant number of differentially expressed genes have been linked by Ingenuity Pathway Analysis (IPA; Ingenuity® Systems, www.ingenuity.com) to “small molecule biochemistry” and “lipid metabolism,” highlighting the importance of cholesterol biosynthesis and metabolism of fatty acids and acyl-CoA in normal craniofacial development (Muenke and Beachy, 2000).
To determine whether NCC are the cellular effectors of the craniofacial phenotype in Twsg1−/− mice, we generated mice with NCC-specific deletion of Twsg1 (Twsg1flox/flox;Sox10Cre). Sox10-Cre mice express Cre recombinase in NCC, as early as a premigratory stage, and in NCC derivatives, specifically the pharyngeal region (Matsuoka et al., 2005; Muller et al., 2008). The phenotype of these mice recapitulated the phenotype of global deletion of Twsg1 (MacKenzie et al., 2009), but the effect was dependent on the efficiency of Cre-mediated deletion of exon 4 of Twsg1 (Fig. 3). A reduction of Twsg1 level to less than 0.2% of the wild type expression in BA1 at E11.5 resulted in embryonic craniofacial defects, including hypoplasia and fusion of the mandibular components of BA1, midline fusion of the frontonasal prominences and non-septation of the telecephalic vesicles.
Figure 3. The frequency of craniofacial defects in mice with NCC-specific deletion of Twsg1.
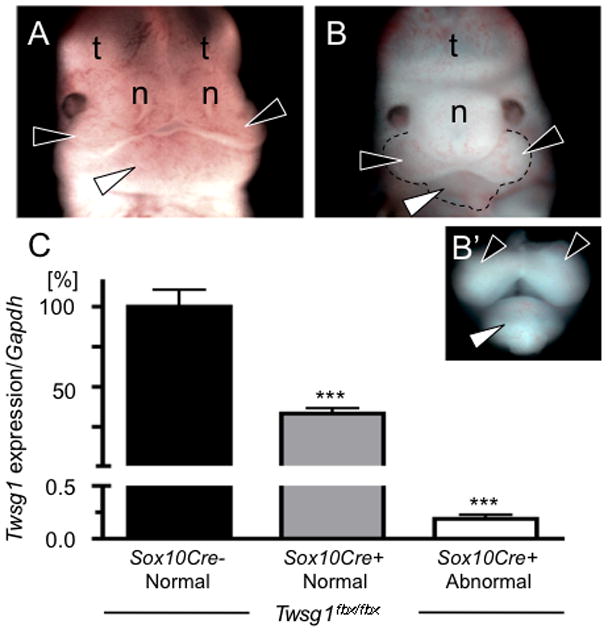
Twsg1flox/flox;Sox10Cre+ embryos included both (A) normal appearing embryos (black arrowheads point to the maxillary components of BA1; white arrowhead to the mandibular component; n, nasal prominences; t, telencephalic vesicles) and (B) embryos with craniofacial abnormalities, including fusion of the mandibular arches, nasal processes, and telencephalic vesicles (B’f) Dissection of the mandibular and maxillary components of BA1 highlights hypoplasia and midline fusion of the mandibular prominences that characterizes the severe Twsg1 phenotype. (C) Expression levels of Twsg1, measured using primers to exon 4 and 5 were compared between Twsg1flox/flox;Sox10Cre- and Twsg1flox/flox;Sox10Cre+ depending on the presence or absence of external craniofacial abnormalities. A reduction of Twsg1 levels to less than 0.2% of the wild type expression in BA1 at E11.5 resulted in craniofacial defects. Both maxillary and mandibular prominences were collected as shown in B’. Q-PCR was performed using individual mRNA samples. Three embryos per group were analyzed, ***p<0.001 (compared to Twsg1flox/flox;Cre− embryos).
Transcriptional changes between class A and class C mutants and their functional significance
Class A and class C embryos share the same genetic mutation in Twsg1 but differ in the absence or presence of craniofacial defects. Therefore we extended our analysis to genes that are differentially expressed between these classes of mutants, as they may provide new insights into mechanisms underlying variable disease expressivity. We identified 80 genes that were differentially expressed between affected and unaffected Twsg1−/− embryos (Supplemental Table 1), including 41 additional transcripts that were not identified in the WT vs class C comparison. The number of genes that showed opposite trends in class A vs class C (Fig. 4A) significantly increased compared to the class C vs WT comparison (Fig. 2A) by using this approach. To highlight such changes, we grouped these differentially expressed genes into various expression patterns: P1 includes genes downregulated in class C; P2 genes upregulated in class A and downregulated in class C; P3 the reverse trend of P2; and P4 genes upregulated in class C (Fig. 4A).
Figure 4. Gene expression differences between unaffected and severely affected mutants.
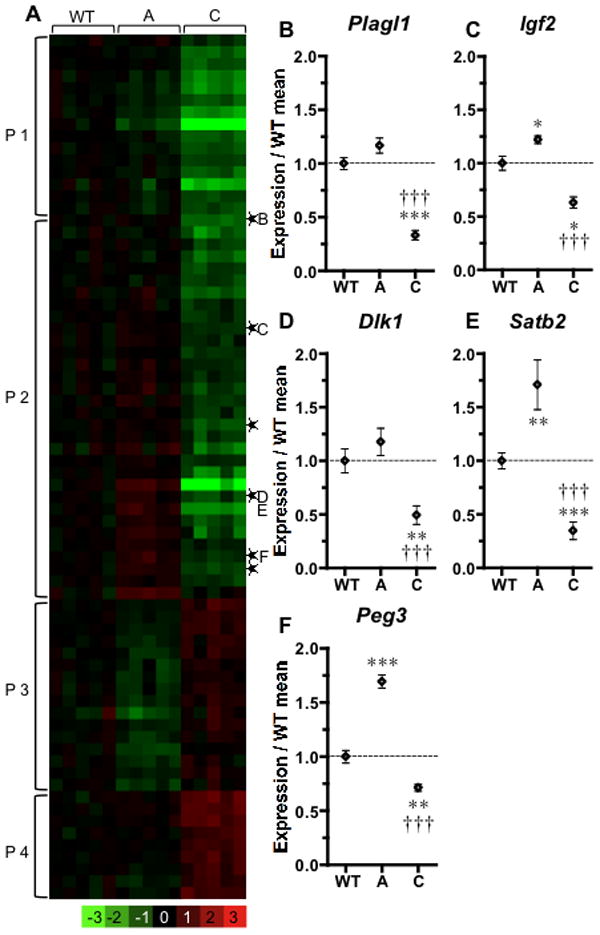
(A) A heatmap of expression changes in various phenotypic classes was compared to the average of WT. Genes with expression changes >1.5 fold and with a false discovery rate of <10% are presented as rows. ▯Imprinted genes. (B–F) Q-PCR confirmation. Significance levels in comparison with WT (*) or with class A (†); three symbols represent p<0.001; two, p<0.01; one, p<0.05.
Microarray results indicating differential gene expression between phenotypic classes A and C were validated further by both Q-PCR (Fig. 4B–F) and in situ hybridizations (Fig. 5). Despite their normal external appearance, class A mutants show a marked increase in expression for Plagl1, Satb2 and Peg3 (Fig. 5G–O). Other anatomic expression sites for these genes outside BA1 were not affected in the various classes of embryos, indicating a BA1-specific effect (data not shown).
Figure 5. Validation of differential gene expression by in situ hybridization.
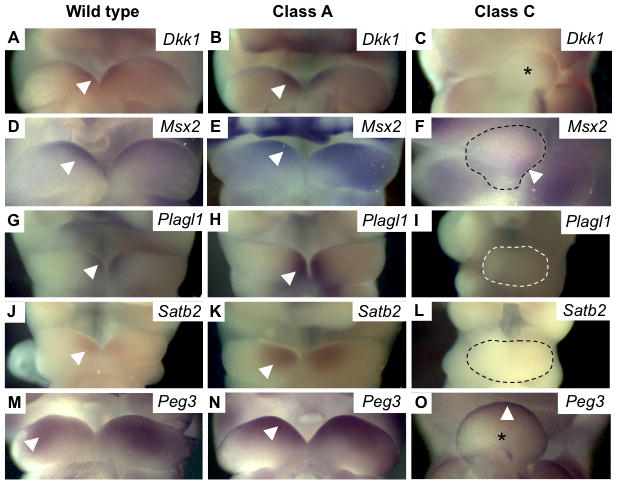
Photomicrographs of embryos from different phenotype classes, probed by in situ hybridization for (A–C) Dkk1 and (D–F) Msx2, show similar expression levels between WT and class A, but profoundly decreased expression in class C. (G–I) Plagl1, (J–L) Satb2 and (M–O) Peg3 show increased expression in class A and markedly decreased expression in class C. These represent various patterns of differential gene expression as described in the text. Arrowheads indicate expression domains within BA1. Fused mandibular prominences of BA1 are either marked with an asterisk or outlined with a dashed line.
The ontological categories of genes whose expression levels differ between class A and class C are shown in Table 2. Again, apoptosis is among the key biological processes. Tumor protein 53-induced nuclear protein 1 (Trp53inp1) was identified among a set of genes that play a role in regulating apoptosis, which are uniquely altered between affected and unaffected mutants. Additional biological processes were identified as distinguishing between affected and unaffected embryos, including cellular assembly and organization, carbohydrate metabolism, and DNA replication, recombination, and repair.
Table 2.
Predicted biological processes regulated by genes uniquely altered between class A and class C mutants.
| Molecular and Cellular Functions | Highest P-value | List of molecules |
|---|---|---|
| Cellular Movement | 1.1E-02 | DAB1, ENPP2, EPHA4, ETV5, FABP7, FOXF1, HGF, IGF2, UNC5C |
| Cell-To-Cell Signaling and Interaction | 1.32E-02 | ENPP3, FABP7, GRIK2, HGF, IGF2 |
| Cellular Growth and Proliferation | 1.6E-02 | DHCR24, ENPP2, ENPP3, EVI1, FABP7, FOXF1, HGF, IGF2, PRRX2, PTCH1, TFAP2B, TP53INP1, UNC5C |
| Cellular Assembly and Organization* | 1.71E-02 | DAB1, ENPP2, EPHA4, FABP7, HGF, IGF2, PTCH1, TFAP2B, |
| Small Molecule Biochemistry | 1.71E-02 | DHCR24, ENPP2, ENPP3, ELOVL6, FABP7, HGF, IGF2, TP53INP1, |
| Cellular Development | 1.71E-02 | FABP7, FOXF1, HGF, IGF2, LHX8, UNC5C |
| Carbohydrate Metabolism* | 1.71E-02 | ENPP2, HGF, IGF2, TP53INP1 |
| Cell Death | 1.71E-02 | DHCR24, GRIK2, HGF, IGF2, MGST1, TFAP2B, TRP53INP1, UNC5C |
| Cellular Function and Maintenance | 1.71E-02 | EPHA4, EVI1, FABP7, HGF, IGF2 |
| Lipid Metabolism | 1.71E-02 | DHCR24, ELOVL6, ENPP2, FABP7, HGF |
| Molecular Transport* | 1.71E-02 | ENPP2, FABP7, HGF, IGF2, TP53INP1 |
| Gene Expression | 1.84E-02 | ETV5, EVI1, FOXF1, HGF, IGF2, TBX22, TFAP2B |
| DNA Replication, Recombination, and Repair* | 1.84E-02 | ENPP3, HGF, IGF2, PTCH1 |
Processes identified as significant based on class C vs class A comparison, but not class C vs wild type comparison
Among the differentially expressed transcripts that were not identified in class C vs WT embryo comparisons, but were identified in comparisons of class A vs. C embryos, seven play known roles in craniofacial development in mice and/or humans (Evi1, Eya4, Igf2, Lhx8, Prrx2, Ptch1, Tbx22) (Braybrook et al., 2001; Bruce et al., 2009; Depreux et al., 2008; Hoyt et al., 1997; Ming et al., 2002; ten Berge et al., 1998; Zhao et al., 1999) (Table 1). Interestingly, each of these genes groups in expression pattern P2. While each transcript showed less than 1.5-fold decrease in expression in class C compared to WT, the difference from class A was accentuated by a small increase in their expression in class A mutants. Since many of these genes may serve similar functions during craniofacial development, it is plausible that additive effects of these small changes may compensate for the loss of TWSG1 during BA1 morphogenesis, and protect class A embryos against manifestation of disease. Other genes, including imprinted genes, also are upregulated in class A and downregulated in class C, suggesting that they either are co-regulated within gene networks important for craniofacial development or may play a direct role in craniofacial development (Feng et al., 2009).
Genetic deletion of p53 reduces incidence of craniofacial defects in Twsg1−/− mice
Further comparison of class A vs. C differentially expressed transcripts identified genes that are downregulated in class A and upregulated in class C. This pattern (P3) was not observed in the comparison between WT and class C mutants except for Sema3e. Among them was a p53-inducible gene, Trp53inp1 (Tomasini et al., 2003). The pattern of Trp53inp1 expression in the different phenotypic classes suggested that increased p53 activity could play a role in mediating the phenotype. Western blotting on whole embryos demonstrated that p53 levels were, in fact increased in severely affected homozygous mutants class C with lower levels of p53 in unaffected homozygous mutants class A, or WT embryos (Fig. 6A). Q-PCR analysis of Trp53inp1 transcript levels confirmed microarray data indicating upregulation of this gene in class C embryos with a trend toward reduction in class A embryos compared to WT (Fig. 6B).
Figure 6. Prevention of craniofacial defects Twsg1−/− mice by a genetic deletion of p53.
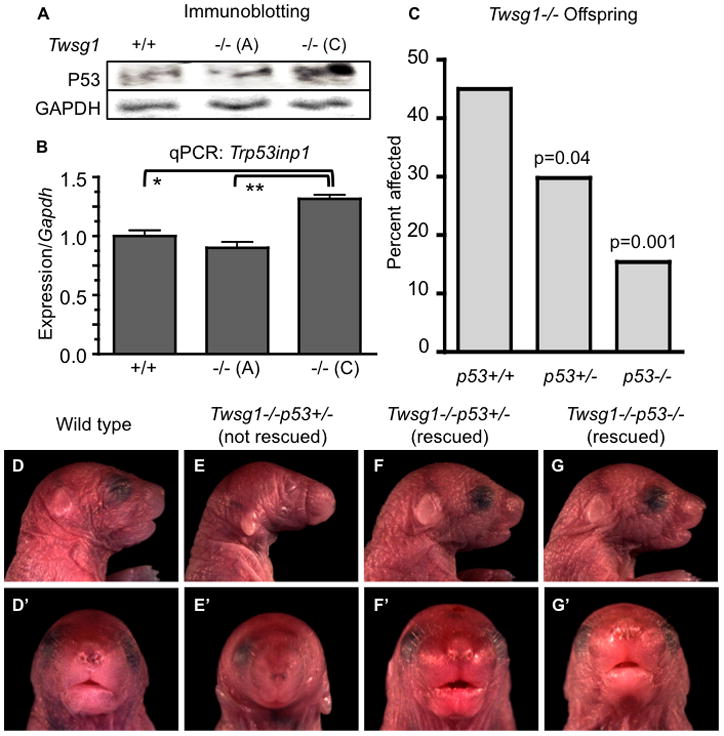
(A) Western blotting for p53 using whole E10.5 embryos indicates increased p53 protein levels in Twsg1−/− class C, compared to Twsg1−/− class A or WT embryos. GAPDH levels were consistent across these samples (B) Q-PCR measurement of Trp53inp1 transcript levels confirms microarray data indicating upregulation of this gene in class C embryos with a trend toward reduction in class A embryos (C) Decreasing incidence of craniofacial defects among Twsg1−/− pups is associated with reduced p53 gene dosage. *p<0.05, **p<0.01, ***p=0.001. Representative images of neonates with their corresponding genotypes, lateral view (D–G) and frontal view (D’–G’).
Based on upregulation of p53 and Trp53inp1 in class C embryos that show the highest degree of apoptosis in BA1, and since suppression of p53 prevents the neurocristopathy of Treacher-Collins syndrome through inhibition of NCC apoptosis (Jones et al., 2008), we hypothesized that a similar phenotypic rescue might be observed after a genetic deletion of p53 on the Twsg1−/− background.
Progeny from Twsg1+/−p53+/− intercrosses or Twsg1+/−p53+/− and Twsg1−/−p53+/− matings were analyzed (both neonates and embryos at E17.5) for the presence of external craniofacial defects. The rate of recovery of Twsg1−/−p53+/− and Twsg1−/−p53−/− genotypes is consistent with the predicted distribution based on Mendelian inheritance. The frequency of Twsg1-related craniofacial defects significantly decreased with a reduction of p53 gene dosage from 44% in Twsg1−/−p53+/+ pups (N=675) (Sun et al., 2010) to 30% in Twsg1−/−p53+/− (N=47, p=0.04) and 15% in Twsg1−/−p53−/− littermates (N=39, p=0.001) (Fig. 6C–G). While craniofacial defects were prevented to a large degree by a loss of two copies of p53, there was also a high degree of perinatal death among Twsg1−/−p53−/− neonates (up to 66%), suggesting involvement of other organ systems. As previously published, we observed that homozygous deletion of p53 leads variably to exencephaly (Sah et al., 1995). This phenotype appeared independently of Twsg1 genotype.
Imprinted genes are overrepresented among genes that are upregulated in class A and downregulated in class C mutants
The various expression patterns defined for groups of differentially expressed genes may help identify a common regulatory mechanism for each group. Interestingly, we found that group P2, with an increase or a trend toward increase from WT in class A and a decrease in expression in class C mutants, is highly enriched in imprinted genes. Using a list of imprinted loci (Morison et al., 2001; Morison et al., 2005), we identified 68 transcript clusters corresponding to imprinted loci in the array of 16755 transcript clusters. Of these 68, six are differentially regulated between class A and class C: Plagl1 (Fig. 4B), Igf2 (Fig. 4C), Dlk1 (Fig. 4D), paternally expressed 3 (Peg3) (Fig. 4F), ankyrin repeat and SOCS box-containing protein 4 (Asb4), and maternally expressed 3 (Meg3). This proportion of imprinted genes is much higher than predicted by chance, as indicated by a χ2 analysis yielding a p-value of < 2.92*10 −23. To confirm the enrichment of imprinted genes, a more stringent approach was also taken. In this case, we estimated the number of imprinted genes to represent 2.5% of the mouse genome (Luedi et al., 2005). Finding six imprinted genes represented in the 81 differentially expressed transcript clusters was again highly significant, with a p value of <0.0046.
DISCUSSION
Differential gene expression is associated with Twsg1−/− phenotypic severity
Transcriptional profiling has been used previously to identify genes important in normal development of individual facial prominences (Feng et al., 2009) as well as downstream targets of mutated genes (Jeong et al., 2008). Mouse knockouts with variable phenotypes present a particular challenge and an opportunity to gain insights into the basis of this variability. For the first time, we undertook an effort to correlate phenotypic severity of craniofacial defects with changes in the transcriptome, based on the premise that both unaffected and affected Twsg1−/− mutants would show changes in gene expression compared to WT mice and to each other.
We observed reproducible transcriptional profiles that cluster into distinct groups, and are strongly associated with the observed phenotypic categories in Twsg1−/− mice. This observation strongly suggests that these transcriptional patterns help to define the distinct morphological and functional groups of Twsg1−/− mice. Among the genes that are differentially expressed between class C and WT BA1, about 20% are associated directly with known human or mouse craniofacial defects. Others may represent new candidate genes that may contribute to human craniofacial diseases. Most of these genes are downregulated in class C mutants; since they regulate development of similar craniofacial structures, their loss of expression helps to explain observed craniofacial defects in Twsg1 mutants. As an example, significantly reduced Dkk1 expression could contribute to the anterior truncation phenotype (Mukhopadhyay et al., 2001) of some Twsg1−/− mice.
We were able to distinguish transcript differences not only between WT and affected mutants, but also between unaffected and affected Twsg1−/− mutants. This led to three main conclusions. First, class A Twsg1−/− embryos, despite appearing normal on a morphological level, are not “normal” on a molecular level. Second, genes that are differentially expressed between the genetic mutants and the WT embryos, but not differentially expressed between phenotypic class A vs. class C mutants, presumably do not play a role in development of the severe mutant phenotype. Third, genes that are differentially expressed between class A and class C mutants may provide clues about possible compensatory mechanisms that prevent class A mutants from developing craniofacial defects. In particular, upregulation of craniofacial genes which regulate development of BA1, palate, maxilla, nasal capsule, and teeth (Evi1, Eya4, Igf2, Lhx8, Prrx2, Ptch1, Satb2, and Tbx22) in class A mutants may compensate for the loss of TWSG1 function during craniofacial morphogenesis.
A role for a stress response in craniofacial pathology
It has been suggested that NCC are particularly sensitive to cellular stress during embryogenesis and that suppression of p53 can prevent craniofacial defects in a murine model of Treacher-Collins syndrome (Jones et al., 2008), Tcof1+/− mice. Our experiments showing a genetic rescue of craniofacial defects in Twsg1−/− mice corroborate this data and suggest that this approach may have broader implications for the prevention of craniofacial defects by targeting the p53 pathway.
The end-result of increased p53 signaling in Tcof1+/− mice was proposed to be an increase in NCC apoptosis and deficient formation of NCC, leading to craniofacial defects. Similarly, increased neuroepithelial apoptosis is at the core of neural tube defects in Pax3-deficient embryos, which also can be rescued by a loss of p53 function (Pani et al., 2002). We have previously shown that abnormal BA1 development in Twsg1−/− mice is also associated with increased apoptosis, albeit at a later stage, once NCC have populated the branchial arches (MacKenzie et al., 2009). Thus, an increase in apoptosis is a common link between these mouse models of birth defects, which each show phenotypic rescue by suppression of p53.
In Twsg1−/− mice, this increase in apoptosis is thought to be due to disruption of a BMP gradient in BA1 (MacKenzie et al., 2009). While BMPs are known to have proapoptotic effects during embryonic development (Graham et al., 1994; Mina et al., 2002), understanding of downstream molecular mechanisms remains limited. There is some evidence from in vitro studies that BMP4-induced apoptosis may be p53-dependent (Fukuda et al., 2006). Interestingly, BMPs have been implicated in modulating cellular responses to stress and TWSG1 as a modulator of BMPs (Oelgeschläger et al., 2000; Ross et al., 2001) would also hence be implicated in this process. For example, BMP7 can have a direct antioxidative effect in the kidneys and in neurons (Tsai et al., 2007; Yeh et al., 2009). On the other hand, BMP2 and BMP4 have been shown to have pro-oxidative stress effects in endothelial cells (Csiszar et al., 2006; Csiszar et al., 2008; Wong et al., 2010). With TWSG1’s bifunctional role, being able to either promote or inhibit BMP signaling depending on context, the effects on modulation of stress may also be context dependent. We propose that the cell’s variable ability to cope with stress may underlie the variable apoptosis and phenotypic variability. The effectors and drivers of this adaptability are not yet known.
A possible role for epigenetic regulation of craniofacial phenotypes cannot be excluded in view of a growing body of evidence that epigenetic phenomena contribute to phenotypic variability in humans and mice (Dolinoy et al., 2007; Whitelaw and Martin, 2001). Imprinted genes are known genomic targets of epigenetic regulation (Waterland and Jirtle, 2004). Whether they also play a role in generating craniofacial variability remains to be determined. While several imprinted genes have been previously shown to be overrepresented in the mandibular prominence compared to the maxillary prominence or the frontonasal prominence in wild type mouse embryos (Feng et al., 2009), our study suggests that altered regulation of the imprinted genes may contribute to generating phenotypic variation in Twsg1−/− mice. Notably, most of these genes show gains and losses of expression between unaffected class A and affected class C Twsg1−/−mutants, respectively. Other genes showing this expression pattern also are known to mediate epigenetic effects during development and disease, for example Satb2 (Gyorgy et al., 2008), Evi1 (Spensberger and Delwel, 2008), Eya4 (Osborn et al., 2006), and Ptch1 (Diede et al., 2009). Several “metastable epialleles” have been described in mice (Avy, AxinFu, CabpIAP) (Dolinoy, 2007; Druker et al., 2004; Rakyan et al., 2003; Waterland and Jirtle, 2003), although none that would confer predisposition to the development of craniofacial defects. Stress response, epigenetics, and gene expression can be interrelated. P53 can interact with both DNA methyltransferase 1 (DNMT1) and DNMT3a to alter gene methylation (Esteve et al., 2005; Gibney and Nolan, 2010; Wang et al., 2005). Cellular stress can also change the expression of imprinted genes, including Igf2, H19, and Meg3, independent of the stress-responsive tumor suppressors, for example due to de novo methylation in cancer cells (Pantoja et al., 2005). Cellular stress and methylation are also both impacted by shared biochemical pathways in the metabolism of folate, homocysteine and the synthesis of glutathione (Chern et al., 2001; Tchantchou, 2006) Future studies will examine global methylation patterns in various classes of Twsg1 mutants to determine if there is indeed a role for epigenetic regulation of craniofacial phenotypes and to identify targets of such regulation.
Multifactorial model of craniofacial defects in Twsg1−/− mice
We have developed a model that integrates various processes that may be involved in establishing phenotypic variation in Twsg1−/− mutant mice (Fig. 7). The most immediate effect, which has been corroborated further by transcriptome analysis described here, is the loss of the normal BMP signaling gradient, leading to mispatterning of BA1, reduced outgrowth and excessive apoptosis (MacKenzie et al., 2009). Loss of tissue by apoptosis and loss of peak BMP activity lead to a reduction in BMP targets and other genes expressed in the distal region of BA1, and evoke compensatory changes in gene expression, changes in cellular metabolism and stress responses. These effects presumably are compounded by stochastic fluctuations in gene expression and signaling pathways (Melnick et al., 2006; Spudich and Koshland, 1976), and possibly by changes in the epigenome at various regulatory elements.
Figure 7. Model for interrelated processes leading to craniofacial phenotypes and craniofacial phenotypic variability in Twsg1−/− mice.
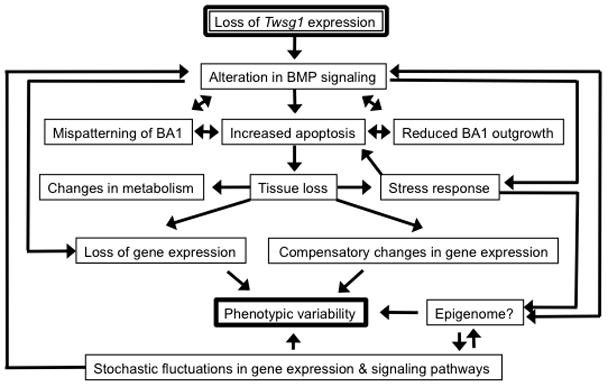
Loss of TWSG1 disrupts the BMP gradient within BA1, which leads to mispatterning of BA1, increased cellular stress, increased apoptosis, and reduced outgrowth. Apoptotic tissue loss and loss of peak BMP activity lead to a reduction in BMP targets and other genes expressed in the distal region of BA1 and evoke stress and metabolic responses as well as compensatory changes in gene expression. This is compounded by likely changes in the epigenome as well as stochastic fluctuations in gene expression and signaling pathways, leading to phenotypic variation.
Conclusions
We show here that phenotypic classes of Twsg1−/− embryos are associated strongly with distinct patterns of differentially expressed transcripts. This suggests that the phenotypic variation observed in Twsg1−/− mice may be caused by heretofore unidentified “master regulators” which in turn would bring about coordinate changes in expression of many downstream genes. An initiating event is disruption of BMP signaling in BA1 of Twsg1−/− mice that evokes a number of cellular and molecular responses, including a cellular stress response, which appears to play a key role in the pathogenesis of craniofacial defects. Occurrence of these defects can be suppressed by a reduction in p53 dosage. Further study of transcriptional, and probably epigenetic, contributions to phenotypic variation may not merely explain the wide variation of craniofacial phenotypes in clinical craniofacial syndromes, but also suggest how craniofacial morphological diversity might be enhanced through evolutionary processes (Brugmann et al., 2006). That the face is a key site for morphological evolution is suggested by the wide diversity of craniofacial adaptations in vertebrates (Brugmann et al., 2006). To provide the phenotypic “space” for these adaptations, craniofacial development must be particularly plastic. The changes we observe highlight the extreme plasticity of transcriptional and likely the epigenetic states of genes involved in craniofacial development.
Supplementary Material
Acknowledgments
The authors thank Dr. Michael O’Connor, Dr. York Marahrens, Dr. Nathan Springer, and Dr. ChangWon Park for helpful discussions, and Dr. Erik Carlson for advice on Q-PCR. Sox10Cre mice were generously provided by Dr. William Richardson (University College London). This project was supported by R01 DE016601 to A.P., Undergraduate Research Opportunities Program (UROP) to B.N., and a Musculoskeletal Training Grant NIH-NIAMS, T32 AR050938 to C.J.B.
Footnotes
Publisher's Disclaimer: This is a PDF file of an unedited manuscript that has been accepted for publication. As a service to our customers we are providing this early version of the manuscript. The manuscript will undergo copyediting, typesetting, and review of the resulting proof before it is published in its final citable form. Please note that during the production process errors may be discovered which could affect the content, and all legal disclaimers that apply to the journal pertain.
References
- Benjamini Y, Hochberg Y. Controlling the false discovery rate: a practical and powerful approach to multiple testing. Journal of the Royal Statistical Society. Series B 1995 [Google Scholar]
- Berdal A, Molla M, Hotton D, Aïoub M, Lézot F, Néfussi JR, Goubin G. Differential impact of MSX1 and MSX2 homeogenes on mouse maxillofacial skeleton. Cells, tissues, organs. 2009;189:126–132. doi: 10.1159/000154271. [DOI] [PubMed] [Google Scholar]
- Bobola N, Carapuco M, Ohnemus S, Kanzler B, Leibbrandt A, Neubuser A, Drouin J, Mallo M. Mesenchymal patterning by Hoxa2 requires blocking Fgf-dependent activation of Ptx1. Development. 2003;130:3403–3414. doi: 10.1242/dev.00554. [DOI] [PubMed] [Google Scholar]
- Braybrook C, Doudney K, Marcano AC, Arnason A, Bjornsson A, Patton MA, Goodfellow PJ, Moore GE, Stanier P. The T-box transcription factor gene TBX22 is mutated in X-linked cleft palate and ankyloglossia. Nat Genet. 2001;29:179–183. doi: 10.1038/ng730. [DOI] [PubMed] [Google Scholar]
- Bruce S, Hannula-Jouppi K, Peltonen J, Kere J, Lipsanen-Nyman M. Clinically Distinct Epigenetic Subgroups in Silver-Russell Syndrome: The Degree of H19 Hypomethylation Associates with Phenotype Severity and Genital and Skeletal Anomalies. Journal of Clinical Endocrinology & Metabolism. 2009;94:579–587. doi: 10.1210/jc.2008-1805. [DOI] [PubMed] [Google Scholar]
- Brugmann SA, Kim J, Helms JA. Looking different: understanding diversity in facial form. Am J Med Genet A. 2006;140:2521–2529. doi: 10.1002/ajmg.a.31361. [DOI] [PubMed] [Google Scholar]
- Butchbach ME, Rose FF, Jr, Rhoades S, Marston J, McCrone JT, Sinnott R, Lorson CL. Effect of diet on the survival and phenotype of a mouse model for spinal muscular atrophy. Biochem Biophys Res Commun. 2009 doi: 10.1016/j.bbrc.2009.11.148. [DOI] [PMC free article] [PubMed] [Google Scholar]
- Champy MF, Selloum M, Zeitler V, Caradec C, Jung B, Rousseau S, Pouilly L, Sorg T, Auwerx J. Genetic background determines metabolic phenotypes in the mouse. Mamm Genome. 2008;19:318–331. doi: 10.1007/s00335-008-9107-z. [DOI] [PubMed] [Google Scholar]
- Chern CL, Huang RF, Chen YH, Cheng JT, Liu TZ. Folate deficiency-induced oxidative stress and apoptosis are mediated via homocysteine-dependent overproduction of hydrogen peroxide and enhanced activation of NF-kappaB in human Hep G2 cells. Biomed Pharmacother. 2001;55:434–442. doi: 10.1016/s0753-3322(01)00095-6. [DOI] [PubMed] [Google Scholar]
- Csiszar A, Ahmad M, Smith KE, Labinskyy N, Gao Q, Kaley G, Edwards JG, Wolin MS, Ungvari Z. Bone morphogenetic protein-2 induces proinflammatory endothelial phenotype. Am J Pathol. 2006;168:629–638. doi: 10.2353/ajpath.2006.050284. [DOI] [PMC free article] [PubMed] [Google Scholar]
- Csiszar A, Labinskyy N, Jo H, Ballabh P, Ungvari Z. Differential proinflammatory and prooxidant effects of bone morphogenetic protein-4 in coronary and pulmonary arterial endothelial cells. Am J Physiol Heart Circ Physiol. 2008;295:H569–577. doi: 10.1152/ajpheart.00180.2008. [DOI] [PMC free article] [PubMed] [Google Scholar]
- Depreux FF, Darrow K, Conner DA, Eavey RD, Liberman MC, Seidman CE, Seidman JG. Eya4-deficient mice are a model for heritable otitis media. J Clin Invest. 2008;118:651–658. doi: 10.1172/JCI32899. [DOI] [PMC free article] [PubMed] [Google Scholar]
- Diede SJ, Guenthoer J, Geng LN, Mahoney SE, Marotta M, Olson JM, Tanaka H, Tapscott SJ. DNA methylation of developmental genes in pediatric medulloblastomas identified by denaturation analysis of methylation differences. Proc Natl Acad Sci U S A. 2009 doi: 10.1073/pnas.0907606106. [DOI] [PMC free article] [PubMed] [Google Scholar]
- Dindot SV, Person R, Strivens M, Garcia R, Beaudet AL. Epigenetic profiling at mouse imprinted gene clusters reveals novel epigenetic and genetic features at differentially methylated regions. Genome Res. 2009;19:1374–1383. doi: 10.1101/gr.089185.108. [DOI] [PMC free article] [PubMed] [Google Scholar]
- Dolinoy DC. Epigenetic gene regulation: early environmental exposures. Pharmacogenomics. 2007;8:5–10. doi: 10.2217/14622416.8.1.5. [DOI] [PubMed] [Google Scholar]
- Dolinoy DC, Das R, Weidman JR, Jirtle RL. Metastable epialleles, imprinting, and the fetal origins of adult diseases. Pediatr Res. 2007;61:30R–37R. doi: 10.1203/pdr.0b013e31804575f7. [DOI] [PubMed] [Google Scholar]
- Donehower LA, Harvey M, Slagle BL, McArthur MJ, Montgomery CA, Jr, Butel JS, Bradley A. Mice deficient for p53 are developmentally normal but susceptible to spontaneous tumours. Nature. 1992;356:215–221. doi: 10.1038/356215a0. [DOI] [PubMed] [Google Scholar]
- Druker R, Bruxner TJ, Lehrbach NJ, Whitelaw E. Complex patterns of transcription at the insertion site of a retrotransposon in the mouse. Nucleic Acids Res. 2004;32:5800–5808. doi: 10.1093/nar/gkh914. [DOI] [PMC free article] [PubMed] [Google Scholar]
- Du Y, Yip H. Effects of bone morphogenetic protein 2 on Id expression and neuroblastoma cell differentiation. Differentiation. 2009 doi: 10.1016/j.diff.2009.10.003. [DOI] [PubMed] [Google Scholar]
- Esteve PO, Chin HG, Pradhan S. Human maintenance DNA (cytosine-5)-methyltransferase and p53 modulate expression of p53-repressed promoters. Proc Natl Acad Sci U S A. 2005;102:1000–1005. doi: 10.1073/pnas.0407729102. [DOI] [PMC free article] [PubMed] [Google Scholar]
- Feng W, Leach SM, Tipney H, Phang T, Geraci M, Spritz RA, Hunter LE, Williams T. Spatial and Temporal Analysis of Gene Expression during Growth and Fusion of the Mouse Facial Prominences. PLoS One. 2009;4:e8066. doi: 10.1371/journal.pone.0008066. [DOI] [PMC free article] [PubMed] [Google Scholar]
- Finley KR, Tennessen J, Shawlot W. The mouse secreted frizzled-related protein 5 gene is expressed in the anterior visceral endoderm and foregut endoderm during early post-implantation development. Gene expression patterns: GEP. 2003;3:681–684. doi: 10.1016/s1567-133x(03)00091-7. [DOI] [PubMed] [Google Scholar]
- FitzPatrick DR, Carr IM, McLaren L, Leek JP, Wightman P, Williamson K, Gautier P, McGill N, Hayward C, Firth H, Markham AF, Fantes JA, Bonthron DT. Identification of SATB2 as the cleft palate gene on 2q32-q33. Human molecular genetics. 2003;12:2491–2501. doi: 10.1093/hmg/ddg248. [DOI] [PubMed] [Google Scholar]
- Fukuda N, Saitoh M, Kobayashi N, Miyazono K. Execution of BMP-4-induced apoptosis by p53-dependent ER dysfunction in myeloma and B-cell hybridoma cells. Oncogene. 2006;25:3509–3517. doi: 10.1038/sj.onc.1209393. [DOI] [PubMed] [Google Scholar]
- Gibney ER, Nolan CM. Epigenetics and gene expression. Heredity. 2010;105:4–13. doi: 10.1038/hdy.2010.54. [DOI] [PubMed] [Google Scholar]
- Graham A, Francis-West P, Brickell P, Lumsden A. The signalling molecule BMP4 mediates apoptosis in the rhombencephalic neural crest. Nature. 1994;372:684–686. doi: 10.1038/372684a0. [DOI] [PubMed] [Google Scholar]
- Gyorgy AB, Szemes M, de Juan Romero C, Tarabykin V, Agoston DV. SATB2 interacts with chromatin-remodeling molecules in differentiating cortical neurons. Eur J Neurosci. 2008;27:865–873. doi: 10.1111/j.1460-9568.2008.06061.x. [DOI] [PubMed] [Google Scholar]
- Hansen M, Lucarelli MJ, Whiteman DAH, Mulliken JB. Treacher Collins syndrome: Phenotypic variability in a family including an infant with arhinia and uveal colobomas. American Journal of Medical Genetics. 1996;61:71–74. doi: 10.1002/(SICI)1096-8628(19960102)61:1<71::AID-AJMG14>3.0.CO;2-T. [DOI] [PubMed] [Google Scholar]
- Hoyt PR, Bartholomew C, Davis AJ, Yutzey K, Gamer LW, Potter SS, Ihle JN, Mucenski ML. The Evi1 proto-oncogene is required at midgestation for neural, heart, and paraxial mesenchyme development. Mech Dev. 1997;65:55–70. doi: 10.1016/s0925-4773(97)00057-9. [DOI] [PubMed] [Google Scholar]
- Jeong J, Li X, McEvilly RJ, Rosenfeld MG, Lufkin T, Rubenstein JL. Dlx genes pattern mammalian jaw primordium by regulating both lower jaw-specific and upper jaw-specific genetic programs. Development (Cambridge, England) 2008;135:2905–2916. doi: 10.1242/dev.019778. [DOI] [PMC free article] [PubMed] [Google Scholar]
- Jones NC, Lynn ML, Gaudenz K, Sakai D, Aoto K, Rey JP, Glynn EF, Ellington L, Du C, Dixon J, Dixon MJ, Trainor PA. Prevention of the neurocristopathy Treacher Collins syndrome through inhibition of p53 function. Nat Med. 2008;14:125–133. doi: 10.1038/nm1725. [DOI] [PMC free article] [PubMed] [Google Scholar]
- Kuroiwa Y, Kaneko-Ishino T, Kagitani F, Kohda T, Li LL, Tada M, Suzuki R, Yokoyama M, Shiroishi T, Wakana S, Barton SC, Ishino F, Surani MA. Peg3 imprinted gene on proximal chromosome 7 encodes for a zinc finger protein. Nat Genet. 1996;12:186–190. doi: 10.1038/ng0296-186. [DOI] [PubMed] [Google Scholar]
- Linton K, Hey Y, Dibben S, Miller C, Freemont A, Radford J, Pepper S. Methods comparison for high-resolution transcriptional analysis of archival material on Affymetrix Plus 2.0 and Exon 1.0 microarrays. Biotechniques. 2009;47:587–596. doi: 10.2144/000113169. [DOI] [PubMed] [Google Scholar]
- Luedi PP, Hartemink AJ, Jirtle RL. Genome-wide prediction of imprinted murine genes. Genome research. 2005;15:875–884. doi: 10.1101/gr.3303505. [DOI] [PMC free article] [PubMed] [Google Scholar]
- MacKenzie A, Ferguson MW, Sharpe PT. Expression patterns of the homeobox gene, Hox-8, in the mouse embryo suggest a role in specifying tooth initiation and shape. Development. 1992;115:403–420. doi: 10.1242/dev.115.2.403. [DOI] [PubMed] [Google Scholar]
- MacKenzie B, Wolff R, Lowe N, Billington CJ, Peterson A, Schmidt B, Graf D, Mina M, Gopalakrishnan R, Petryk A. Twisted gastrulation limits apoptosis in the distal region of the mandibular arch in mice. Developmental Biology. 2009;328:13–23. doi: 10.1016/j.ydbio.2008.12.041. [DOI] [PMC free article] [PubMed] [Google Scholar]
- Matsuoka T, Ahlberg PE, Kessaris N, Iannarelli P, Dennehy U, Richardson WD, McMahon AP, Koentges G. Neural crest origins of the neck and shoulder. Nature. 2005;436:347–355. doi: 10.1038/nature03837. [DOI] [PMC free article] [PubMed] [Google Scholar]
- Melnick M, Petryk A, Abichaker G, Witcher D, Person AD, Jaskoll T. Embryonic salivary gland dysmorphogenesis in Twisted gastrulation deficient mice. Arch Oral Biol. 2006;51:433–438. doi: 10.1016/j.archoralbio.2005.09.010. [DOI] [PMC free article] [PubMed] [Google Scholar]
- Mina M, Wang YH, Ivanisevic AM, Upholt WB, Rodgers B. Region- and stage-specific effects of FGFs and BMPs in chick mandibular morphogenesis. Dev Dyn. 2002;223:333–352. doi: 10.1002/dvdy.10056. [DOI] [PubMed] [Google Scholar]
- Ming JE, Kaupas ME, Roessler E, Brunner HG, Golabi M, Tekin M, Stratton RF, Sujansky E, Bale SJ, Muenke M. Mutations in PATCHED-1, the receptor for SONIC HEDGEHOG, are associated with holoprosencephaly. Hum Genet. 2002;110:297–301. doi: 10.1007/s00439-002-0695-5. [DOI] [PubMed] [Google Scholar]
- Morison IM, Paton CJ, Cleverley SD. The imprinted gene and parent-of-origin effect database. Nucleic Acids Res. 2001;29:275–276. doi: 10.1093/nar/29.1.275. [DOI] [PMC free article] [PubMed] [Google Scholar]
- Morison IM, Ramsay JP, Spencer HG. A census of mammalian imprinting. Trends Genet. 2005;21:457–465. doi: 10.1016/j.tig.2005.06.008. [DOI] [PubMed] [Google Scholar]
- Muenke M, Beachy PA. Genetics of ventral forebrain development and holoprosencephaly. Curr Opin Genet Dev. 2000;10:262–269. doi: 10.1016/s0959-437x(00)00084-8. [DOI] [PubMed] [Google Scholar]
- Muenke M, Cohen MM., Jr Genetic approaches to understanding brain development: holoprosencephaly as a model. Ment Retard Dev Disabil Res Rev. 2000;6:15–21. doi: 10.1002/(SICI)1098-2779(2000)6:1<15::AID-MRDD3>3.0.CO;2-8. [DOI] [PubMed] [Google Scholar]
- Mukhopadhyay M, Shtrom S, Rodriguez-Esteban C, Chen L, Tsukui T, Gomer L, Dorward DW, Glinka A, Grinberg A, Huang SP, Niehrs C, Izpisua Belmonte JC, Westphal H. Dickkopf1 is required for embryonic head induction and limb morphogenesis in the mouse. Dev Cell. 2001;1:423–434. doi: 10.1016/s1534-5807(01)00041-7. [DOI] [PubMed] [Google Scholar]
- Muller SM, Stolt CC, Terszowski G, Blum C, Amagai T, Kessaris N, Iannarelli P, Richardson WD, Wegner M, Rodewald HR. Neural crest origin of perivascular mesenchyme in the adult thymus. J Immunol. 2008;180:5344–5351. doi: 10.4049/jimmunol.180.8.5344. [DOI] [PubMed] [Google Scholar]
- Oelgeschläger M, Larraín J, Geissert D, De Robertis EM. The evolutionarily conserved BMP-binding protein Twisted gastrulation promotes BMP signalling. Nature. 2000;405:757–763. doi: 10.1038/35015500. [DOI] [PMC free article] [PubMed] [Google Scholar]
- Osborn NK, Zou H, Molina JR, Lesche R, Lewin J, Lofton-Day C, Klatt KK, Harrington JJ, Burgart LJ, Ahlquist DA. Aberrant methylation of the eyes absent 4 gene in ulcerative colitis-associated dysplasia. Clin Gastroenterol Hepatol. 2006;4:212–218. doi: 10.1016/j.cgh.2005.11.009. [DOI] [PubMed] [Google Scholar]
- Pandolfi PP, Roth ME, Karis A, Leonard MW, Dzierzak E, Grosveld FG, Engel JD, Lindenbaum MH. Targeted disruption of the GATA3 gene causes severe abnormalities in the nervous system and in fetal liver haematopoiesis. Nat Genet. 1995;11:40–44. doi: 10.1038/ng0995-40. [DOI] [PubMed] [Google Scholar]
- Pani L, Horal M, Loeken MR. Rescue of neural tube defects in Pax-3-deficient embryos by p53 loss of function: implications for Pax-3- dependent development and tumorigenesis. Genes Dev. 2002;16:676–680. doi: 10.1101/gad.969302. [DOI] [PMC free article] [PubMed] [Google Scholar]
- Pantoja C, de Los Rios L, Matheu A, Antequera F, Serrano M. Inactivation of imprinted genes induced by cellular stress and tumorigenesis. Cancer Res. 2005;65:26–33. [PubMed] [Google Scholar]
- Pavlidis P, Li Q, Noble WS. The effect of replication on gene expression microarray experiments. Bioinformatics. 2003;19:1620–1627. doi: 10.1093/bioinformatics/btg227. [DOI] [PubMed] [Google Scholar]
- Peaston AE, Whitelaw E. Epigenetics and phenotypic variation in mammals. Mammalian genome: official journal of the International Mammalian Genome Society. 2006;17:365–374. doi: 10.1007/s00335-005-0180-2. [DOI] [PMC free article] [PubMed] [Google Scholar]
- Petryk A, Anderson R, Jarcho MP, Leaf H, Carlson CS, Klingensmith J, Shawlot W, O’Connor MB. The mammalian twisted gastrulation gene functions in foregut and craniofacial development. Developmental Biology. 2004;267:374–386. doi: 10.1016/j.ydbio.2003.11.015. [DOI] [PubMed] [Google Scholar]
- Pfaff SL, Mendelsohn M, Stewart CL, Edlund T, Jessell TM. Requirement for LIM homeobox gene Isl1 in motor neuron generation reveals a motor neuron-dependent step in interneuron differentiation. Cell. 1996;84:309–320. doi: 10.1016/s0092-8674(00)80985-x. [DOI] [PubMed] [Google Scholar]
- Rakyan VK, Chong S, Champ ME, Cuthbert PC, Morgan HD, Luu KV, Whitelaw E. Transgenerational inheritance of epigenetic states at the murine Axin(Fu) allele occurs after maternal and paternal transmission. Proc Natl Acad Sci U S A. 2003;100:2538–2543. doi: 10.1073/pnas.0436776100. [DOI] [PMC free article] [PubMed] [Google Scholar]
- Roessler E, Belloni E, Gaudenz K, Jay P, Berta P, Scherer SW, Tsui LC, Muenke M. Mutations in the human Sonic hedgehog gene cause holoprosencephaly. Nature Genetics. 1996;14:357–360. doi: 10.1038/ng1196-357. [DOI] [PubMed] [Google Scholar]
- Ross JJ, Shimmi O, Vilmos P, Petryk A, Kim H, Gaudenz K, Hermanson S, Ekker SC, O’Connor MB, Marsh JL. Twisted gastrulation is a conserved extracellular BMP antagonist. Nature. 2001;410:479–483. doi: 10.1038/35068578. [DOI] [PubMed] [Google Scholar]
- Sah VP, Attardi LD, Mulligan GJ, Williams BO, Bronson RT, Jacks T. A subset of p53-deficient embryos exhibit exencephaly. Nat Genet. 1995;10:175–180. doi: 10.1038/ng0695-175. [DOI] [PubMed] [Google Scholar]
- Sasaki H, Hogan BL. Differential expression of multiple fork head related genes during gastrulation and axial pattern formation in the mouse embryo. Development (Cambridge, England) 1993;118:47–59. doi: 10.1242/dev.118.1.47. [DOI] [PubMed] [Google Scholar]
- Schlange T, Arnold HH, Brand T. BMP2 is a positive regulator of Nodal signaling during left-right axis formation in the chicken embryo. Development. 2002;129:3421–3429. doi: 10.1242/dev.129.14.3421. [DOI] [PubMed] [Google Scholar]
- Sclafani AM, Skidmore JM, Ramaprakash H, Trumpp A, Gage PJ, Martin DM. Nestin-Cre mediated deletion of Pitx2 in the mouse. Genesis. 2006;44:336–344. doi: 10.1002/dvg.20220. [DOI] [PubMed] [Google Scholar]
- Spandidos A, Wang X, Wang H, Seed B. PrimerBank: a resource of human and mouse PCR primer pairs for gene expression detection and quantification. Nucleic Acids Res. 2010;38:D792–799. doi: 10.1093/nar/gkp1005. [DOI] [PMC free article] [PubMed] [Google Scholar]
- Spensberger D, Delwel R. A novel interaction between the proto-oncogene Evi1 and histone methyltransferases, SUV39H1 and G9a. FEBS Lett. 2008;582:2761–2767. doi: 10.1016/j.febslet.2008.06.056. [DOI] [PubMed] [Google Scholar]
- Spudich JL, Koshland DE., Jr Non-genetic individuality: chance in the single cell. Nature. 1976;262:467–471. doi: 10.1038/262467a0. [DOI] [PubMed] [Google Scholar]
- Sun M, Forsman C, Sergi C, Gopalakrishnan R, O’Connor MB, Petryk A. The expression of twisted gastrulation in postnatal mouse brain and functional implications. Neuroscience. 2010;169:920–931. doi: 10.1016/j.neuroscience.2010.05.026. [DOI] [PMC free article] [PubMed] [Google Scholar]
- Tchantchou F. Homocysteine metabolism and various consequences of folate deficiency. J Alzheimers Dis. 2006;9:421–427. doi: 10.3233/jad-2006-9408. [DOI] [PubMed] [Google Scholar]
- ten Berge D, Brouwer A, Korving J, Martin JF, Meijlink F. Prx1 and Prx2 in skeletogenesis: roles in the craniofacial region, inner ear and limbs. Development. 1998;125:3831–3842. doi: 10.1242/dev.125.19.3831. [DOI] [PubMed] [Google Scholar]
- Tomasini R, Samir AA, Carrier A, Isnardon D, Cecchinelli B, Soddu S, Malissen B, Dagorn JC, Iovanna JL, Dusetti NJ. TP53INP1s and homeodomain-interacting protein kinase-2 (HIPK2) are partners in regulating p53 activity. J Biol Chem. 2003;278:37722–37729. doi: 10.1074/jbc.M301979200. [DOI] [PubMed] [Google Scholar]
- Tsai MJ, Weng CF, Shyue SK, Liou DY, Chen CH, Chiu CW, Yang TH, Pan HA, Liao RI, Kuo HS, Huang MC, Huang WC, Hoffer BJ, Cheng H. Dual effect of adenovirus-mediated transfer of BMP7 in mixed neuron-glial cultures: neuroprotection and cellular differentiation. J Neurosci Res. 2007;85:2950–2959. doi: 10.1002/jnr.21395. [DOI] [PubMed] [Google Scholar]
- Tsuda T, Markova D, Wang H, Evangelisti L, Pan TC, Chu ML. Zinc finger protein Zac1 is expressed in chondrogenic sites of the mouse. Developmental dynamics: an official publication of the American Association of Anatomists. 2004;229:340–348. doi: 10.1002/dvdy.10439. [DOI] [PubMed] [Google Scholar]
- Varrault A, Gueydan C, Delalbre A, Bellmann A, Houssami S, Aknin C, Severac D, Chotard L, Kahli M, Le Digarcher A, Pavlidis P, Journot L. Zac1 regulates an imprinted gene network critically involved in the control of embryonic growth. Developmental cell. 2006;11:711–722. doi: 10.1016/j.devcel.2006.09.003. [DOI] [PubMed] [Google Scholar]
- Wang YA, Kamarova Y, Shen KC, Jiang Z, Hahn MJ, Wang Y, Brooks SC. DNA methyltransferase-3a interacts with p53 and represses p53-mediated gene expression. Cancer Biol Ther. 2005;4:1138–1143. doi: 10.4161/cbt.4.10.2073. [DOI] [PubMed] [Google Scholar]
- Waterland RA, Jirtle RL. Transposable elements: targets for early nutritional effects on epigenetic gene regulation. Mol Cell Biol. 2003;23:5293–5300. doi: 10.1128/MCB.23.15.5293-5300.2003. [DOI] [PMC free article] [PubMed] [Google Scholar]
- Waterland RA, Jirtle RL. Early nutrition, epigenetic changes at transposons and imprinted genes, and enhanced susceptibility to adult chronic diseases. Nutrition (Burbank, Los Angeles County, Calif) 2004;20:63–68. doi: 10.1016/j.nut.2003.09.011. [DOI] [PubMed] [Google Scholar]
- Whitelaw E, Martin DI. Retrotransposons as epigenetic mediators of phenotypic variation in mammals. Nature Genetics. 2001;27:361–365. doi: 10.1038/86850. [DOI] [PubMed] [Google Scholar]
- Wong WT, Tian XY, Chen Y, Leung FP, Liu L, Lee HK, Ng CF, Xu A, Yao X, Vanhoutte PM, Tipoe GL, Huang Y. Bone morphogenic protein-4 impairs endothelial function through oxidative stress-dependent cyclooxygenase-2 upregulation: implications on hypertension. Circ Res. 2010;107:984–991. doi: 10.1161/CIRCRESAHA.110.222794. [DOI] [PubMed] [Google Scholar]
- Yeh CH, Chang CK, Cheng MF, Lin HJ, Cheng JT. The antioxidative effect of bone morphogenetic protein-7 against high glucose-induced oxidative stress in mesangial cells. Biochem Biophys Res Commun. 2009;382:292–297. doi: 10.1016/j.bbrc.2009.03.011. [DOI] [PubMed] [Google Scholar]
- Zhao Q, Behringer RR, de Crombrugghe B. Prenatal folic acid treatment suppresses acrania and meroanencephaly in mice mutant for the Cart1 homeobox gene. Nat Genet. 1996;13:275–283. doi: 10.1038/ng0796-275. [DOI] [PubMed] [Google Scholar]
- Zhao Y, Guo YJ, Tomac AC, Taylor NR, Grinberg A, Lee EJ, Huang S, Westphal H. Isolated cleft palate in mice with a targeted mutation of the LIM homeobox gene lhx8. Proc Natl Acad Sci U S A. 1999;96:15002–15006. doi: 10.1073/pnas.96.26.15002. [DOI] [PMC free article] [PubMed] [Google Scholar]
Associated Data
This section collects any data citations, data availability statements, or supplementary materials included in this article.