Abstract
Sequencing centers such as the Human Genome Center at LBNL are producing an ever-increasing flood of genetic data. Annotation can greatly enhance the biological value of these sequences. Useful annotations include possible gene locations, homologies to known genes, and gene signals such as promoters and splice sites. Genotator is a workbench for automated sequence annotation and annotation browsing. The back end runs a series of sequence analysis tools on a DNA sequence, handling the various input and output formats required by the tools. Genotator currently runs five different gene-finding programs, three homology searches, and searches for promoters, splice sites, and ORFs. The results of the analyses run by Genotator can be viewed with the interactive graphical browser. The browser displays color-coded sequence annotations on a canvas that can be scrolled and zoomed, allowing the annotated sequence to be explored at multiple levels of detail. The user can view the actual DNA sequence in a separate window; when a region is selected in the map display, it is highlighted automatically in the sequence display, and vice versa. By displaying the output of all of the sequence analyses, Genotator provides an intuitive way to identify the significant regions (for example, probable exons) in a sequence. Users can interactively add personal annotations to label regions of interest. Additional capabilities of Genotator include primer design and pattern searching.
[Further details for obtaining Genotator are available at http://www.cshl.org/gr.]
The Need for Automated Annotation
Sequencing centers such as the Human Genome Center at LBNL are producing an ever-increasing flood of genetic data. It is increasingly being accepted that annotation of these sequences can greatly enhance their biological value. In the past, annotation of sequences has been done primarily by hand (e.g., Lewis et al. 1995). This approach to annotation is, and will continue to be, extremely valuable. However, the rate of sequencing has accelerated to the point that it is impossible to have biologists personally annotate every new base. An automated approach to sequence annotation is clearly necessary.
Many researchers are developing tools for analyzing DNA sequences. These tools include programs that look for homologies to sequence in a database, predict possible exons, find repeats, and identify gene signals such as promoters and splice sites. Many of these sequence analysis tools can offer useful insight into the biological significance and possible function of a new sequence; however, they tend to suffer from several shortcomings. First, each sequence analysis program has its own output format (and often its own input format as well). This makes it difficult to compare the results of multiple programs. Second, although the ability to predict the locations of exons and other genetic signals continues to improve, it would still be rash to place absolute faith in the predictions of any one program. If, however, several different programs, with different approaches, make the same prediction on a sequence region, our confidence in the prediction is increased. Another limitation of many sequence analysis programs is that the output is textual rather than graphical, which makes it hard to quickly identify the significant regions of a genomic sequence. Some programs do have graphical displays, but that does not ease the problem of comparing the output of several different programs. Finally, most sequence analysis programs are not a solution to the problem of automated annotation, because they don’t provide many of the features that one would want in such a tool, such as the ability to add personal annotations or to inspect the sequence at an arbitrary level of detail.
We have developed a sequence annotation workbench, Genotator, that addresses these shortcomings. Genotator provides a flexible, transparent system for automatically running a series of sequence analysis programs on genetic sequences. It also has a graphical display that allows users to view all of the annotations and add or delete their own. Genotator’s display allows annotated sequences to be examined at multiple levels of detail, from an overview of the entire sequence down to individual bases.
Background and Related Work
A number of other researchers have developed tools that overlap to some extent with Genotator’s functionality. One of the earliest was ACeDB (Durbin Thierry-Mieg 1991). ACeDB was developed as a database and graphical display tool for storing and analyzing data from the C. elegans sequencing project. It continues to be used by the groups involved with that and other sequencing projects. In a number of ways, ACeDB provides more functionality than Genotator. Its underlying database is much more sophisticated than Genotator’s, and includes types of information (e.g., paper references) that are beyond the scope of Genotator. In other ways, ACeDB lacked the functionality to make it a complete system for sequence annotation. For example, it cannot be run automatically on a set of sequences to find database homologies, possible promoters, and so forth, in these sequences. I initially considered modifying ACeDB to enable it to work as an annotation tool, but found that this was not the best way to approach the problem, both because ACeDB was designed to be a database for sequencing projects rather than an annotation workbench, and because its code style is baroque, sparsely commented, and idiosyncratic.
Genome Topographer (T.G. Marr, unpubl.) is another example of an ACeDB-like program that includes a database to hold genome-related data plus displays to allow various views of the data. Like ACeDB, Genome Topographer was not designed as an interactive annotation tool.
Others have written tools more specifically designed for sequence annotation. These include GeneQuiz, SCAN, the BCM search launcher, and GAIA. GeneQuiz (Scharf et al. 1994), like Genotator, automatically runs a series of sequence analysis tools, including BLAST and FASTA. The results are displayed as structured text. Darrell Ricke’s SCAN program (D.O. Ricke, J.M. Buckingham, A.C. Munk, N. Liu, D.C. Bruce, J.F. Chao, Y. Shi, R. Lobb, E.H. Saunders, H.-C. Chi, J.R. Wu, N.A. Doggett, M.R. Altherr, L.L. Deaven, and R.K. Moyzis, in prep.) has a back end similar in some respects to Genotator, although it concentrates more on database homology searches and less on exon prediction. The displays are mostly structured text, some with hyperlinks. The BCM Search Launcher (Smith et al. 1996) provides a point from which to access various sequence (and structure) analysis tools available on the World Wide Web. The user can request any of a variety of such searches; the results of each search are displayed separately as hyperlinked structured text. GAIA (Genome Annotation and Information Analysis) (L.C. Bailey, J. Schug, S. Fischer, M. Gibson, J. Crabtree, D.B. Searls, and G.C. Overton, in prep.), which is being developed at the University of Pennsylvania, is perhaps the most similar system to Genotator in terms of its goals, organization, and features. Sequences are submitted to ATLAS, the data management portion of GAIA, and then annotated automatically by CARTA. The annotated sequence is displayed with Java applets (based on the bioWidget components). Although GAIA calls only one exon prediction program (GRAIL), rather than several as Genotator does, GAIA includes some types of features (e.g., poly(A) signals) that are not reported by Genotator.
Recently there has been interest in developing Java displays for visualization of sequences and related information. Groups working on such displays include the Berkeley Drosophila Genome group, (G. Helt and G. Rubin, unpubl.), European Molecular Biology Laboratory (EMBL), and the Computational Biology and Informatics Laboratory at the University of Pennsylvania. The bioWidget Consortium (http://www.biowidgets.org/) involves some of the groups interested in collaborative development of Java displays for bioinformatics. Most of this work has focused on graphical displays rather than on back-end software for sequence analysis. Genotator offers a combined system, which runs a sequence through various analysis tools and then displays the results. The next section describes how Genotator is organized.
The Organization of Genotator
Genotator consists of three main portions—a set of sequence analysis programs, a database, and a graphical browser—as well as the “glue” that links the three components (see Fig. 1). These components will be described briefly here and in more detail in subsequent sections.
Figure 1.
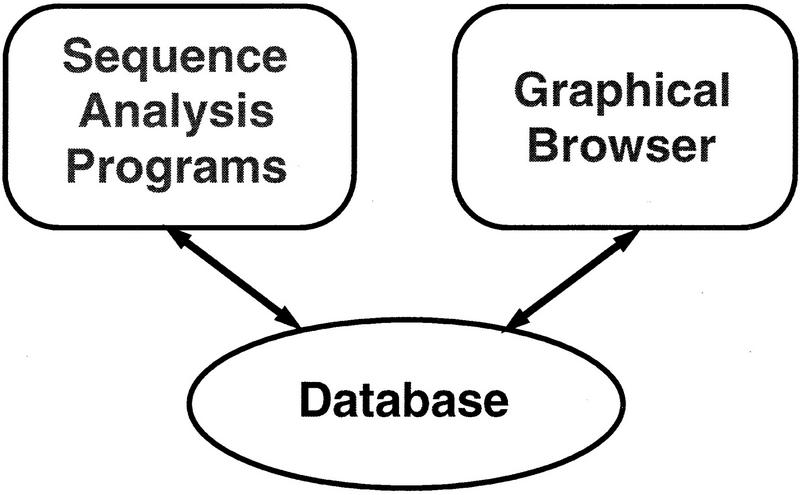
Organization of Genotator.
Genotator’s Database
Genotator’s database currently exists as a Unix directory hierarchy of flat files. Each flat file contains one type of annotation (e.g., GRAIL exons) in a simple tabular format called ACE format (as used by ACeDB databases; Durbin and Thierry-Mieg 1991). ACE format was chosen because it is easy for programs to parse and is also human-readable (unlike some formats such as ASN1 that are difficult for humans to parse). The directory hierarchy is organized as shown in Figure 2.
Figure 2.

Genotator directory hierarchy for sequence annotations.
The Genotator Back End
The Genotator back end runs several gene finders, homology searches (using BLAST) (Altschul et al. 1990), and signal searches, and saves the results in .ace format. Genotator therefore automates the tedious process of running a dozen different sequence analysis programs with a dozen different input and output formats.
Out of the many available sequence analysis tools, I chose a reasonable subset to integrate into Genotator. Exclusion of some tools from Genotator’s collection is not meant to imply that such tools are inferior. Offsite users who set up Genotator at their site (see on-line supplement Appendix A at http://cshl.org/gr for accessing Genotator, system requirements and programs used) are free to modify the code to integrate their favorite sequence analysis tools. Also, various laboratories are sequencing the DNA of various organisms; I set up Genotator to work on human or Drosophila (which are the organisms being sequenced at LBNL). Users can specify from which organism their sequence is (if left unspecified, human is assumed).
The analysis programs called by Genotator fall into three main categories: the gene finders [Genie (Kulp et al. 1996), GRAIL (Xu et al. 1994), GeneFinder (Green 1994), xpound (Thomas and Skolnick 1994), and GeneMark (Borodovsky and McInich 1993)]; the database homology searches [BLASTN (Altschul et al. 1990) on dbEST and database of human or Drosophila repeat sequences; BLASTX on GenPept (Benson et al. 1993)], and sequence feature predictors [start/stop codons, open reading frames (ORFs), promoters (M.G. Reese and F.H. Eeckman, unpubl.), splice sites (M.G. Reese, F.H. Eeckman, D. Kulp, and D. Haussler, unpubl.), and tRNA genes (Lowe and Eddy 1997)]. The promoter and splice site predictors and the Genie gene finder were developed by members of our group at LBNL. Most of the other programs are freely available (see Appendix A). For each analysis program, there is a perl filter that parses the results, filters out the insignificant ones, and saves the significant annotations in .ace files, from which they can be read by the browser.
Figure 3 shows a simplified view of the annotation process used by Genotator. First the incoming sequence is cleaned up (nonstandard characters are converted to Ns; long lines are broken up) and converted to FASTA format, which is used as the input format for many of the sequence analysis tools. The sequence is BLASTed against a database of human (or Drosophila) repeats and the repeats that are found are masked out with xblast. The masked sequence is then BLASTed against databases of expressed sequence tag (EST) sequences and GenPept (translated coding regions from GenBank). The BLAST hits are filtered and stored both in .ace format and in a file for Blixem (a BLAST hit viewer from the Sanger Centre). Issues having to do with BLAST hits are discussed in the next section.
Figure 3.
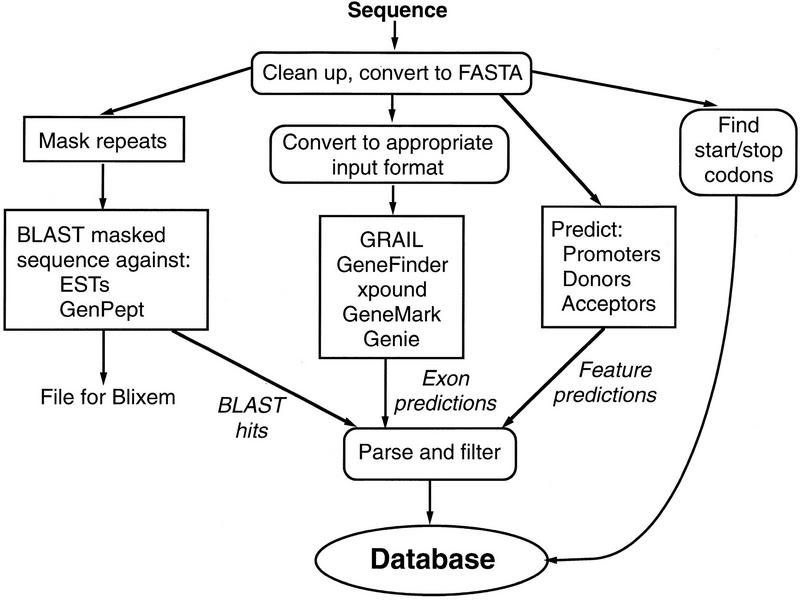
Flowchart showing how sequences are processed by the Genotator back end.
The next phase of processing involves converting the sequence to the appropriate input format for each of five gene prediction tools, running the tools (using parameters appropriate for human or Drosophila sequence), and parsing the results. Stop codons and ORFs are also found and their positions recorded. Martin Reese’s neural network programs are run to find potential promoters and splice sites. tRNAscan-SE is run to look for potential tRNA genes (although these are found so rarely that they are not displayed in the graphical output).
Filtering BLAST Hits
When using BLAST (or any other sequence homology search program) to compare a sequence with a large database of known sequences, one must tackle the issue of identifying the biologically significant hits while minimizing the number of uninteresting hits that must be waded through. The best way to do this is still being debated. We have arrived at some compromise solutions. BLASTX hits against GenPept are run through a BLAST hit postprocessor, MSPcrunch (Sonnhammer and Durbin 1994), which eliminates some of the less significant hits and does some assembly of fragmented hits. Processing the BLASTX hits with MSPcrunch also enables us to browse the hits with Blixem (Sonnhammer and Durbin 1994), a BLAST hit viewer can be invoked from Genotator. A disadvantage of running MSPcrunch on the hits is that the actual alignments of the hits (showing all the bases that matched) are not preserved. Mostly because of this limitation, we chose not to use MSPcrunch on the BLASTN output, but rather to filter out insignificant BLASTN hits by setting a minimum percentage sequence identity (which can be changed by the user when a sequence is run through Genotator).
Another step we take to try to maximize the information content of the reported BLAST hits is to search first for repeat sequences (such as Alu repeats, which are ubiquitous throughout the human genome; there are also repeat sequences found in the genomes of other organisms). The repeat sequences are then masked with xblast (Claverie and States 1993), and the other BLASTs are run on the masked sequence so that the hits that are found do not include repeat sequences.
The Genotator Front End
The front end is described in the next two sections, Running Genotator and The Genotator Browser.
Running Genotator
Genotator can be run via command-line arguments or with the easy-to-use graphical user interface (GUI) shown in Figure 4. The GUI is written in Tkperl.
Figure 4.
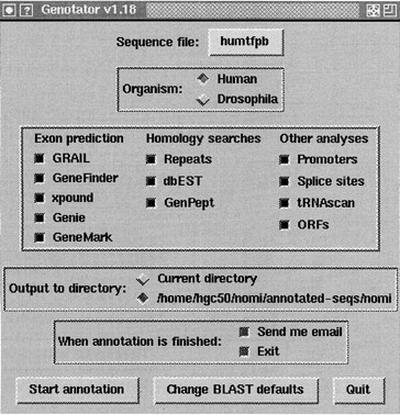
The GUI used to invoke Genotator.
The GUI is designed to minimize the number of choices the user has to make; in most cases, the user can simply click “Start annotation” and everything will proceed automatically.
The command-line interface is useful when the user wants to annotate several sequences at the same time. It can be invoked with no arguments to run the standard analyses, or it can be called with various command-line options to alter its behavior.
We have also developed a Web front end to Genotator that looks much like the GUI. Like the other approaches to running Genotator, the Web interface allows the user to specify a sequence to be annotated and to select which analyses are to be performed. Once a sequence is submitted, the back end runs the analyses as usual and saves the results in the database, where they can be viewed with the Genotator browser.
When Genotator is invoked, its first step is to check the availability of all the sequence analysis programs it knows about. Any that are missing are not offered to the user as choices. Genotator can run with any subset of the suite of sequence analysis programs it is capable of calling. It is written in such a way that new analysis tools can be integrated fairly easily. (Integrating a new tool would involve creating filters to convert the input and output formats, and adding new functions to the back end and front end to run the tool and display the results.)
The Genotator Browser
After a sequence has been run through Genotator, the Genotator browser provides an interactive graphical view of the annotations. The main display in the browser shows a horizontal axis representing the sequence, with forward-strand annotations displayed above the axis and reverse-strand annotations below the axis. Each type of annotation (for example, GRAIL exons) is displayed in its own row, in its own color.
The Genotator browser is built on top of the bioTkperl widgets (G. Helt, unpubl.) developed by Gregg Helt of the UC Berkeley Drosophila Genome Center, [which were in turn inspired by the bioTk widgets developed by David Searls (Searls 1995)]. It can be invoked with the name of an annotated sequence file as an argument. If it is invoked with no arguments, a list of annotated sequences is displayed, with the sequences annotated by the invoking user listed first. Once a sequence has been selected, all of its annotations are loaded and displayed in the map display.
Map Display
As described above, the map display shows color-coded sequence annotations for both strands. The display can be zoomed and scrolled to examine interesting regions in more detail. Clicking on an annotation rectangle displays additional information in the text window at the top of the browser. This includes the start and end positions of the annotation, possibly a score, and other information. For example, if a BLAST hit is clicked, the text window might read, “BLASTX GenPept hit from 864 to 1112 with sequence gp | K01228 | HUMCG1PA1_1 (33% identity).” This concise description identifies the database sequence that was hit (gp | K01228 | HUMCG1PA1_1 is its GenPept ID), the region that was found to be similar to this database sequence (bases 864–1112), and the percentage sequence identity for the hit (33%).
BLAST hits can be double-clicked to view them in more detail. For BLASTN hits (against nucleotide sequences), the complete alignment pops up in a separate window. BLASTX hits against GenPept can be viewed in Blixem.
In Figure 5 the Genotator browser is shown displaying the annotations on HUMTFPB (Mackman et al. 1989), a human tissue factor gene sequence obtained from GenBank. (Splice site predictions and start/stop codons are not displayed until they are explicitly turned on.) (A hyperlinked version of Appendix A and color versions of Figures 5, 6, and 8, below, are available at http://cshl.org/gr.)
Figure 5.
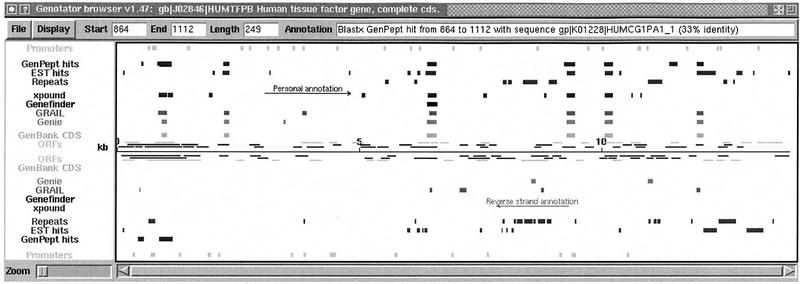
The Genotator browser map display of the annotations on HUMTFPB. The default annotation colors can be seen in the online supplement at http:/cshl.org/gr and are (magenta) NNPP promoter predictions; (red) GenPept hits (using BLASTX). GenPept consists of all the GenBank coding regions translated to amino acids; (orange) EST hits (using BLASTN); (yellow) human repeat sequence hits (using BLASTN); (chartreuse) xpound exon predictions; (green) GeneFinder exon predictions; (turquoise) GRAIL exon predictions; (dark blue) Genie exon predictions; (purple) GenBank CDS (exons); (magenta/red/orange) ORFs (⩾150 bases), colored by frame.
Figure 6.
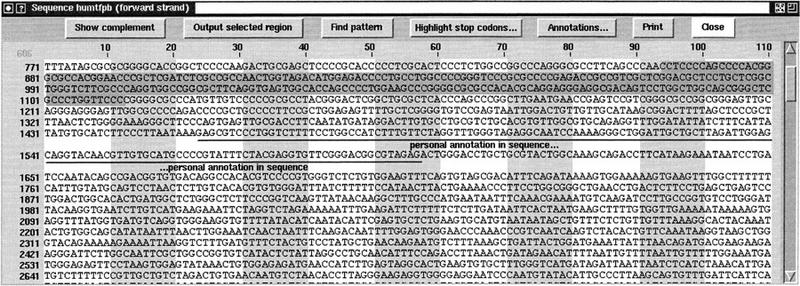
The Genotator browser sequence display showing the sequence of HUMTFPB. The user has clicked on a GenPept BLAST hit in the map display, causing the corresponding sequence region to be highlighted here in gray and red in the sequence display as seen in online suppplement at http://cshl.org/gr.
Figure 8.
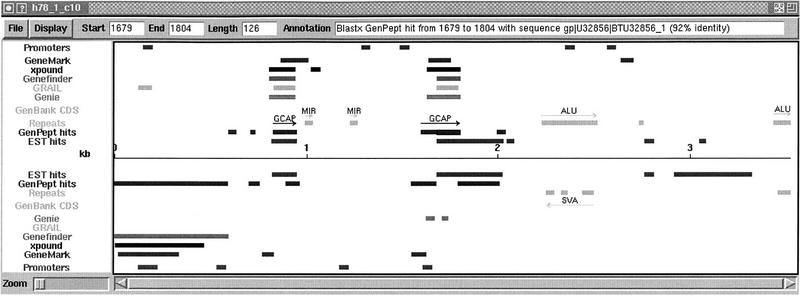
Annotations on h78_1_c10, indicating a possible new gene associated with the photoreceptor membrane. Color on-line supplement available at http://www.cshl.org/gr.
In Figure 5, the user has clicked on one of the red GenPept BLAST hits. The browser put a black frame around the hit and printed information about the hit in the box labeled “Annotation.”
Sequence Display
The Genotator browser can display the actual DNA sequence (or its complement) in a separate window; this is shown in Figure 6. Interaction between the map and sequence displays is bidirectional. When a user selects an annotation in the map display, the corresponding region is highlighted in the appropriate color in the sequence display. Here, for example, the selected GenPept hit is highlighted in red in the sequence display. When a region is selected in the sequence display, it is boxed in the map display.
Genotator’s Display Helps Users Identify Regions of Interest
One of the advantages of Genotator’s graphical display is that it is quickly apparent which sequence regions are likely to be interesting. The arrangement of the display also allows users to assess the relative significance of predictions. For example, if one gene finder predicts an exon in some region, but there are no other exon predictions or BLAST hits in that region, it is unlikely to be a true exon. On the other hand, a sequence region for which all of the gene finders predict an exon, and that contains a BLAST hit to an EST or GenPept sequence, can be judged likely to be a true exon.
The lineup of exon predictions displayed by Genotator was the inspiration for GeneNomi (N.L. Harris, M.G. Reese, and F.H. Eeckman, unpubl.), a method for combining information from several different predictions to make conservative exon predictions. GeneNomi starts with the exons predicted by Genotator’s suite of gene finders, takes the overlapping portions of the predicted exons (which are weighted by the measured accuracy of the gene finding method used to predict each exon), and refines the end points of the consensus exons by looking for splice sites or start/stop codons. GeneNomi was tested on a standardized data set of 305 “clean” gene sequences carefully selected from GenBank (Kulp et al. 1996). By combining several sources of information, GeneNomi was able to come up with slightly better predictions than the best gene finder used by itself. The fact that its predictions were only a slight improvement suggests that we are not yet at the point where a single consensus exon prediction would inspire confidence. It is more useful for a biologist to see the predictions of all of the gene finders lined up (plus the BLAST hits, splice sites, and other supporting features) and to make an informed decision about which exons are most believable. (GeneNomi was developed for research purposes; its predictions are not currently included in the Genotator display.)
After using the Genotator browser to identify probable exons or other interesting features, biologists may choose to confirm these predictions at the bench. (For their convenience, Genotator can also select primers.) By looking at Genotator’s predictions, one may minimize the number of sequence regions that need to be checked.
Other Features of Genotator
Genotator offers several features (besides those already described, such as scrolling and zooming) that enhance the functionality of the map and sequence displays. The user can ask Genotator to generate a text report of all annotations. Any selected region can be written out in FASTA format for further analysis. Other features are discussed in the next four sections. (Graphical illustrations of these features can bee seen in the on-line version of this manuscript at http://www.cshl.org/gr.)
Adding Personal Annotations
The Genotator browser allows users to add new annotations to either the map or the sequence display. These personal annotations are saved along with the precomputed annotations. Figure 7 shows the interface for dealing with personal annotations. To add a personal annotation to the map or sequence display, the user selects some region of the sequence, types the annotation text in the text box, and then clicks “Add Annotation to Map” or “Add Annotation to Sequence.” The color of each personal annotation can be specified independently. Clicking on the button that says “forestgreen” brings up a menu of color choices.
Figure 7.
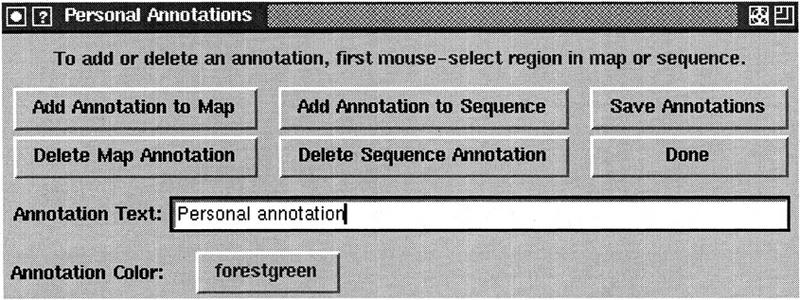
Preparing to add a personal annotation. The user has selected a region to be annotated and a color for the annotation, and has entered text for the annotation. To add the annotation, they will click “Add Annotation to Map” and/or “Add Annotation to Sequence.”
Annotations that refer to a sizable portion of the sequence are generally added to the map; those referring to a small region (such as a primer) are more appropriately added to the sequence. All personal annotations are saved in the database along with the automatically generated annotations. Examples of personal annotations can be seen in the map display in Figure 5 (“Personal annotation” and “Reverse strand annotation”) and the sequence display in Figure 6 (“personal annotation in sequence”).
Exploring ORFs
Genotator shows ORFs in the map display with different offsets and colors for each frame (1, 2, or 3). Additionally, the sequence display can be made to highlight stop codons in one or all frames, in three colors corresponding to their frame.
Primer Selection
To help the user design primers for a region of interest, Genotator can call Primer3, a primer selection program developed at the Whitehead Institute (Rozen and Skaletsky 1996). Genotator users can select a sequence region, select “Design Primers” from the menu, and change any of the default Primer3 options if desired. Once the user is satisfied with the option settings, the best forward and reverse primers are printed to the terminal (so that they can be cut and pasted into a primer order form) and are also indicated in the sequence display.
Searching for Patterns
Another feature lets users look for sequence patterns (such as restriction sites) or regular expressions in a sequence. For example, suppose you wanted to find all instances of an A followed by either or a C or a G followed by one or more Ts followed by an A. The Unix-style regular expression for that pattern is “A[CG]T+A.” Genotator will locate and highlight all subsequences that match the specified pattern.
Genotator Applications
Genotator is being used by several groups at LBNL, as well as off-site at Stanford, Berkeley, and other universities and genome centers. At LBNL, the primary users have included biologists who are looking for genes in newly sequenced regions of the human genome, as well as researchers (including the developers of Genie) who are investigating new methods of gene finding. Genotator provides an intuitive visual way to compare the performance of various gene finders. If the sequence being studied already has known exons, the predictions of the gene finders can easily be checked against these exons.
Figure 8 shows a sequence that a group of biologists at LBNL (C. Collins and T. Cloutier, unpubl.) annotated using Genotator. The sequence, h78_1_c10, is a 3523-bp subclone from human chromosome 7. Personal annotations have been added to indicate regions of interest. The regions marked GCAP indicate where homologies to two retinal guanylyl cyclase activator proteins were found coincident to predicted exons. These predicted exons may therefore belong to some new gene associated in some way with the photoreceptor membrane.
Client-Server Architecture for Genotator
We are working on a client-server version of Genotator that will enable remote users to annotate sequences via a flexible, transparent distributed architecture. This architecture will be described in more detail elsewhere.
Conclusions
As more and more genomic sequence data have become available, interest in sequence annotation has grown. A number of researchers are working on automatic annotation. Genotator is one approach to sequence annotation. Its back end automates the tedious process of running multiple sequence analysis programs, and its front end is an interactive graphical annotation browser that offers insight into the possible significance of a new sequence. Genotator is being tested by biologists and computer scientists at LBNL and elsewhere, and it has been found to be a useful tool both for annotating sequences and for studying gene-finding methods.
Acknowledgments
I am grateful for the assistance of Martin Reese, who wrote several of the sequence analysis programs called by Genotator, helped me debug earlier versions of Genotator, and offered insightful suggestions on this paper; Gregg Helt, who wrote the bioTkperl widgets as well as a graphical browser (AnnotP1) that inspired many of the features in the Genotator browser; Frank Eeckman, who supported this work as group leader of the Human Genome Informatics group and also commented on a draft of this paper; Tom Cloutier and Kelly Frazer, who as active Genotator users have offered many useful suggestions about features and helped me shake out some bugs; Colin Collins, who enthusiastically supported the use of Genotator in his group and allowed me to use his data in my example; David Kulp, who co-authored Genie and also helped test Genotator; Suzanna Lewis, director of the Berkeley Drosophila Genome Project informatics group; and Judith R. Harris, who suggested the name Genotator.
Genotator is available free of charge to non-profit institutions only. For information on obtaining it, please write to the author (nlharris@lbl.gov). See Appendix A at http://cshl.org/gr for system requirements.
Footnotes
E-MAIL nlharris@lbl.gov; FAX (510) 486-4711.
REFERENCES
- Altschul SF, Gish W, Miller W, Myers EW, Lipman DJ. Basic local alignment search tool. J Mol Biol. 1990;215:403–410. doi: 10.1016/S0022-2836(05)80360-2. [DOI] [PubMed] [Google Scholar]
- Benson D, Lipman DJ, Ostell J. GenBank. Nucleic Acids Res. 1993;21:2963–2965. doi: 10.1093/nar/21.13.2963. [DOI] [PMC free article] [PubMed] [Google Scholar]
- Borodovsky M, McIninch JD. GENEMARK: Parallel gene recognition for both DNA strands. Comput & Chem. 1993;17:123–133. [Google Scholar]
- Claverie JM, States DJ. Information enhancement methods for large scale sequence analysis. Comput & Chem. 1993;17:191–201. [Google Scholar]
- Durbin, R. and J. Thierry-Mieg. 1991. A C. elegans database. Documentation, code, and data available from anonymous FTP servers at lirmm.lirmm.fr, cele.mrc-lmb.cam.ac.uk and ncbi.nlm.nih.gov.
- Green P. Ancient conserved regions in gene sequences. Curr Opin Struc Biol. 1994;4:404–412. [Google Scholar]
- Helt, G. 1996. bioTkperl: Graphics widgets for genomics. http://fruitfly.berkeley.edu/BDGP/informatics/bioTkperl.html.
- Kulp D, Haussler D, Reese MG, Eeckman FH. Proceedings of the Conference on Intelligent Systems in Molecular Biology. St. Louis, MO: AAAI/MIT Press; 1996. A generalized hidden Markov model for the recognition of human genes in DNA. . (Set of 305 genes is available at ftp://www-hgc.lbl.gov/pub/genesets.) [PubMed] [Google Scholar]
- Lewis EB, Knafels JD, Mathog DR, Celniker SE. Sequence analysis of the cis-regulatory regions of the bithorax complex of Drosophila. Proc Natl Acad Sci. 1995;92:8403–8407. doi: 10.1073/pnas.92.18.8403. [DOI] [PMC free article] [PubMed] [Google Scholar]
- Lowe TM, Eddy SR. tRNAscan-SE: A program for improved detection of transfer RNA genes in genomic sequence. Nucleic Acids Res. 1997;25:955–964. doi: 10.1093/nar/25.5.955. [DOI] [PMC free article] [PubMed] [Google Scholar]
- Mackman N, Morrissey JH, Fowler B, Edgington TS. Complete sequence of the human tissue factor gene, a highly regulated cellular receptor that initiates the coagulation protease cascade [humtfpb] Biochemistry. 1989;28:1755–1762. doi: 10.1021/bi00430a050. [DOI] [PubMed] [Google Scholar]
- Reese, M.G. and F.H. Eeckman. 1994. New neural network algorithms for improved eukaryotic promoter site recognition. The Seventh International Genome Sequencing and Analysis Conference, Hilton Head Island, SC. September 16–20, 1995.
- Reese, M.G., F.H. Eeckman, D. Kulp, and D. Haussler. 1997. Improved splice site detection in Genie. RECOMB. First Annual International Conference on Computational Molecular Biology, 1997. (ed. M. Waterman), Santa Fe, NM. [DOI] [PubMed]
- Rozen, S. and H.J. Skaletsky. 1996. Primer3. Code available at http://www-genome.wi.mit.edu/genome_software/other/primer3.html.
- Scharf M, Schneider R, Casari G, Bork P, Valencia A, Ouzounis C, Sander C. GeneQuiz: A workbench for sequence analysis. In: Altman R, Brutlag D, Karp P, Lathrop R, Searls D, editors. Proceedings of the second international conference on intelligent systems for molecular biology. Menlo Park, CA: AAAI Press; 1994. pp. 348–353. [PubMed] [Google Scholar]
- Searls, D.B. 1995. bioTk: Componentry for genome informatics graphical user interfaces. COMBIS. http://www.cbil.upenn.edu/dsearls/bioTk_paper/paper.html [DOI] [PubMed]
- Smith RF, Wiese BA, Wojzynski MK, Davison DB, Worley KC. BCM search launcher—An integrated interface to molecular biology data base search and analysis services available on the World Wide Web. Genome Res. 1996;6:454–462. doi: 10.1101/gr.6.5.454. [DOI] [PubMed] [Google Scholar]
- Sonnhammer ELL, Durbin R. A workbench for large scale sequence homology analysis. Comput Applic Biosci. 1994;10:301–307. doi: 10.1093/bioinformatics/10.3.301. [DOI] [PubMed] [Google Scholar]
- Thomas A, Skolnick MH. A probabilistic model for detecting coding regions in DNA sequences. IMA J Math Appl Med Biol. 1994;11:149–160. doi: 10.1093/imammb/11.3.149. [DOI] [PubMed] [Google Scholar]
- Xu Y, Mural RJ, Shah MB, Uberbacher EC. Recognizing exons in genomic sequence using GRAIL II. In: Setlow Jane., editor. Genetic engineering: Principles and methods. Vol. 15. New York, NY: Plenum Press; 1994. [PubMed] [Google Scholar]


