

Abstract
Detailed restriction maps of microbial genomes are a valuable resource in genome sequencing studies but are toilsome to construct by contig construction of maps derived from cloned DNA. Analysis of genomic DNA enables large stretches of the genome to be mapped and circumvents library construction and associated cloning artifacts. We used pulsed-field gel electrophoresis purified Plasmodium falciparum chromosome 2 DNA as the starting material for optical mapping, a system for making ordered restriction maps from ensembles of individual DNA molecules. DNA molecules were bound to derivatized glass surfaces, cleaved with NheI or BamHI, and imaged by digital fluorescence microscopy. Large pieces of the chromosome containing ordered DNA restriction fragments were mapped. Maps were assembled from 50 molecules producing an average contig depth of 15 molecules and high-resolution restriction maps covering the entire chromosome. Chromosome 2 was found to be 976 kb by optical mapping with NheI, and 946 kb with BamHI, which compares closely to the published size of 947 kb from large-scale sequencing. The maps were used to further verify assemblies from the plasmid library used for sequencing. Maps generated in silico from the sequence data were compared to the optical mapping data, and good correspondence was found. Such high-resolution restriction maps may become an indispensable resource for large-scale genome sequencing projects.
Optical mapping is a system for the construction of ordered restriction maps from single molecules (Schwartz et al. 1993; Anantharaman et al. 1997). Individual DNA molecules bound to derivatized glass surfaces and cleaved with restriction enzymes are imaged by digital fluorescence microscopy. Resulting cut sites are visualized as gaps between cleaved DNA fragments, which retain their original order (Cai et al. 1995, 1998). Optical mapping has been used to prepare maps of a number of large insert clone types such as bacterial artificial chromosomes (Cai et al. 1998) and most recently genomic DNA (J. Lin, R. Qi, C. Aston, J. Jing, T.S. Anantharam, B. Mishra, D. White, J.C. Venter, and D.C. Schwartz, in prep). A shotgun mapping strategy was developed in parallel for several microorganisms using large fragments of randomly sheared DNA that were mapped with high cutting efficiencies. The numerous overlapping restriction site landmarks and a measurable cutting efficiency combined together to enable accurate contig assembly without the use of cloned DNA (Anathraman et al. 1998). Because library construction was obviated, it was possible to map large Plasmodium falciparum (P. falciparum) DNA fragments, which are AT-rich and notoriously difficult to clone because of deletion and rearrangement in Escherchia coli (Gardner et al. 1998). Because cloning artifacts were precluded, this enabled accurate maps to be generated. Furthermore, small amounts of starting material were used, facilitating the mapping of this and potentially other parasites that are problematic to culture or clone.
Sequencing of chromosome 2 of P. falciparum was completed recently by Gardner and colleagues (Gardner et al. 1998), as part of an international consortium sequencing the whole P. falciparum genome (Foster and Thompson 1995; Dame et al. 1996). Existing physical maps of P. falciparum chromosomes [chromosome 3; (Thompson and Cowman 1997) and chromosome 4 (Sinnis and Wellems 1988; Watanabe and Inselberg, 1994)], prepared by restriction digestion, gel fingerprinting, and hybridization of probes are of moderate resolution and not ideally suited for systematic sequence verification. To assess the feasibility of optically mapping a whole eukaryotic chromosome, we constructed high-resolution, ordered restriction maps of P. falciparum chromosome 2 using genomic DNA and later compared these maps with those generated in silico from the sequence data. Such restriction maps reveal the architecture of large spans of the genome and have value in shotgun sequencing efforts because they provide ideal scaffolds for sequence assembly, finishing, and verification. Gaps that form between contigs can be characterized in terms of location and breadth, thereby facilitating closure techniques.
RESULTS
P. falciparum Chromosome 2 DNA Sample
A chromosome 2 gel slice was used as starting material. Despite the AT-rich nature of the P. falciparum genome (80–85%), melting of low-gelling-temperature agarose inserts did not affect the integrity of the DNA and the chromosomal DNA was competent for optical mapping. Previously, we mounted DNA molecules by sandwiching the sample between an optical mapping surface and a microscope slide, followed by peeling the surface from the slide. DNA molecules were stretched and fixed onto the surface. This method works very well with clone types such as bacteriophage, cosmid, and BAC (Cai et al. 1995, 1998); however, larger genomic DNA molecules tend to form crossed molecules. We improved this approach by adding the sample to the edge formed by the placement of a surface onto a slide. The liquid DNA sample spreads into the space between the surface and the slide by capillary action. Consequently, DNA breakage was minimized, molecules tended to elongate in the same direction, and crossed molecules were also minimized (see Fig. 1).
Figure 1.
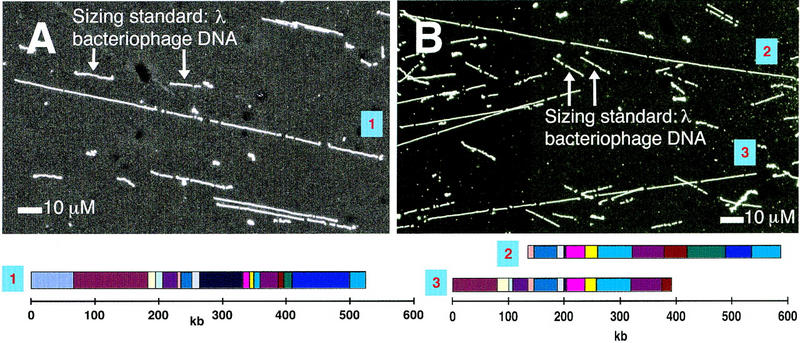
Typical P. falciparum chromosome 2 molecules and their corresponding optical maps. (A) digested with NheI (B) digested with BamHI. Maps derived from the two BamHI-digested molecules in (B) can be aligned.
NheI and BamHI Maps for P. falciparum Chromosome 2
The genomic DNA was mapped with either NheI (Fig. 1A) or BamHI (Fig. 1B). Fragment sizes were calculated by comparison with comounted λ bacteriophage DNA (48.5 kb). P. falciparum DNA has an AT content of 80–85% and λ bacteriophage DNA has an AT content of 50%. The YOYO-1 fluorochrome used for DNA staining intercalates preferentially between GC pairs with increased emission quantum yield (Netzel et al. 1995). A correction factor was therefore applied to each fragment size to correct for this massively different fluorochrome incorporation. λ bacteriophage DNA was used also to determine areas on the surface where cutting efficiency was highest. Cutting efficiencies were > 80%. Maps were obtained from individual molecules of ∼350 kb. Consensus maps were assembled from 50 molecules generating an average contig depth of 15 molecules. Chromosome 2 was found to be 976 kb by optical mapping with NheI, and 946 kb by optical mapping with BamHI (average size 961 kb). There were 40 fragments in the NheI map, ranging from 1.5–115 kb, with average fragment size 24 kb (Fig. 2). There were 30 fragments in the BamHI map ranging from 0.5–80 kb, with average fragment size 32 kb (Fig. 2). Each fragment size in the consensus map was averaged from 10 to 15 fragments. Although P. falciparum chromosome 2 migrates as a distinct band by PFGE, we found the gel slice to contain only 60% chromosome 2-specific DNA. The remaining optical mapping data was rejected.
Figure 2.

High-resolution optical mapping of P. falciparum chromosome 2 using NheI (A) and BamHI (B). The underlying contig used to generate the consensus map is shown. The map predicted from sequence information is shown for comparison.
Integration of Optical Maps and Sequence Data
The chromosome 2 sequence assembled by Gardner and colleagues shows chromosome 2 to be 947 kb (Gardner et al. 1998) versus 976 kb by optical mapping with NheI and 946 kb with BamHI. The optical restriction maps were compared to restriction maps predicted from the sequence, and there was very good correspondence between the two, indicating that there were no major rearrangements or errors in the assembled sequence (Table 1). The optical map included all fragments above 500 bp predicted from sequence. The overall agreement between these maps and the sequence was therefore excellent, with the average fragment size difference below 600 bp (relative error 4.3%) for the NheI map. The average fragment size difference for the BamHI map was 1.2 kb (relative error 5.8%). However, there were several notable differences. Large differences in size for the fragments at each end of the chromosome were noted (Tables 1 and 2). This is because the sequence for these subtelomeric regions is still under construction. PCR products spanning subtelomeric gaps are being sequenced currently. The optical map sizes were larger than those predicted from sequence for certain other fragments (Tables 1 and 2). These differences were due to large fluorescence intensity measurements falsely caused by crossed molecules. Currently, we combine length measurements with fluorescence intensity measurements to improve on our sizing of these fragments. Chromosome 2 maps using these new measurements show no exceptional errors (not shown; Jing et al., in prep). The map was used to facilitate sequence verification. Optical maps can also be used at the earlier sequence-assembly stage to form a scaffold for assembly of contigs formed from sequencing. Linking of single-enzyme maps produces a much higher resolution multi-enzyme map that is rich in information. Smaller contigs can be placed confidently on a multi-enzyme map. Nowadays, mapping is rarely done in the absence of sequencing. Figure 3 shows a comparison of a multi-enzyme map generated by optical mapping with that predicted from sequence. The maps are in complete agreement across the whole length of the chromosome. Given even small amounts of sequence (∼100 kb), maps can be linked and verified readily.
Table 1.
Comparison of NheI Optical Map with Restriction Map Predicted from Sequence
| Optical map (kb) | Map predicted from sequence (kb) | Difference (kb) | Relative difference (%) | Hybridizing probe |
|---|---|---|---|---|
| 71.8 | 66.597 | 5.24 | ||
| 114.5 | 115.147 | 0.63 | 0.6 | |
| 10.3 | 10.226 | 0.02 | 0.2 | |
| 3.4 | 3.359 | 0.07 | 2.1 | |
| 7.9 | 7.856 | 0.05 | 0.6 | |
| 24.7 | 23.684 | 1.03 | 4.4 | |
| 6.8 | 4.933 | 1.88 | 38.0 | |
| 16.5 | 14.553 | 1.97 | 13.6 | |
| 3.2 | 2.875 | 0.30 | 10.3 | |
| 0.177 | ||||
| 11.5 | 11.425 | 0.10 | 0.9 | |
| 4.1 | 3.768 | 0.30 | 7.9 | |
| 63.8 | 63.252 | 0.50 | 0.8 | |
| 10.0 | 10.018 | 0.01 | 0.1 | |
| 6.7 | 6.431 | 0.27 | 4.2 | |
| 8.9 | 9.248 | 0.31 | 3.3 | |
| 28.7 | 27.327 | 1.34 | 4.9 | |
| 4.3 | 4.357 | 0.07 | 1.6 | |
| 7.6 | 7.581 | 0.01 | 0.01 | PF2CM93 |
| 11.0 | 10.588 | 0.44 | 4.2 | |
| 60.5 | 60.324 | 0.21 | 0.4 | |
| 12.3 | 11.935 | 0.40 | 3.3 | |
| 4.1 | 3.964 | 0.12 | 3.0 | |
| 58.2 | 57.925 | 0.25 | 0.4 | |
| 5.5 | 5.381 | 0.07 | 1.3 | |
| 0.363 | ||||
| 1.6 | 1.546 | 0.02 | 1.5 | |
| 23.4 | 22.405 | 0.96 | 4.3 | |
| 35.1 | 34.171 | 0.91 | 2.6 | |
| 18.1 | 17.156 | 0.93 | 5.4 | |
| 3.1 | 2.947 | 0.16 | 5.4 | |
| 24.9 | 25.138 | 0.28 | 1.1 | |
| 40.8 | 40.107 | 0.73 | 1.8 | |
| 20.8 | 20.176 | 0.59 | 2.9 | |
| 25.1 | 24.476 | 0.62 | 2.5 | |
| 77.3 | 75.172 | 2.15 | 2.9 | PF2NA66 |
| 16.6 | 16.637 | 0.07 | 0.4 | |
| 48.0 | 45.683 | 2.30 | 5.0 | |
| 9.4 | 8.546 | 0.88 | 10.3 | |
| 20.1 | 18.986 | 1.15 | 6.0 | |
| 23.9 | 23.192 | 0.75 | 3.2 | |
| 32.1 | 14.897 | 5.65 | ||
| 976.5 | 934.513 | 0.60 | 4.3 |
Table 2.
Comparison of BamHI Optical Map with Restriction Map Predicted from Sequence
| Optical map (kb) | Map predicted from sequence (kb) | Difference (kb) | Relative difference (%) | Hybridizing probe |
|---|---|---|---|---|
| 77.1 | 76.648 | 0.42 | ||
| 19.9 | 20.955 | 1.07 | 5.09 | |
| 7.5 | 6.81 | 0.65 | 9.52 | |
| 26.1 | 27.054 | 0.95 | 3.52 | |
| 9.9 | 9.831 | 0.11 | 1.15 | |
| 41.0 | 43.295 | 2.28 | 5.26 | |
| 12.4 | 13.647 | 1.22 | 8.92 | |
| 3.7 | 3.754 | 0.02 | 0.67 | |
| 34.8 | 35.985 | 1.18 | 3.28 | |
| 21.1 | 20.22 | 0.91 | 4.51 | |
| 63.6 | 61.785 | 1.80 | 2.92 | |
| 55.9 | 55.217 | 0.73 | 1.32 | |
| 41.3 | 40.788 | 0.50 | 1.22 | PF2CM93 |
| 67.3 | 70.318 | 3.05 | 4.33 | |
| 46.7 | 46.943 | 0.23 | 0.49 | |
| 81.2 | 87.327 | 6.14 | 7.03 | |
| 2.0 | 1.786 | 0.20 | 11.35 | |
| 8.9 | 11.633 | 2.68 | 23.07 | |
| 18.6 | 17.953 | 0.69 | 3.85 | |
| 80.8 | 83.96 | 3.16 | 3.77 | |
| 19.9 | 20.665 | 0.78 | 3.76 | |
| 31.1 | 30.351 | 0.72 | 2.39 | |
| 17.4 | 17.959 | 0.56 | 3.10 | |
| 28.6 | 30.812 | 2.22 | 7.21 | PF2NA66 |
| 52.2 | 49.95 | 2.26 | 4.52 | |
| 2.0 | 1.813 | 0.18 | 9.70 | |
| 24.9 | 24.79 | 0.07 | 0.28 | |
| 6.0 | 5.315 | 0.65 | 12.28 | |
| 0.5 | 0.621 | 0.12 | 19.48 | |
| 34.8 | 16.346 | 6.93 | ||
| 937.2 | 934.531 | 1.25 | 5.86 |
Figure 3.

The use of sequence information to link single enzyme maps. The top map was generated by normalizing the single enzyme maps to be the same size (961 kb). The resulting multienzyme map was aligned with the map predicted from sequence. The median relative error is 7%. The average absolute error is 1.4 kb. Upper tick marks are NheI sites; lower tick marks are BamHI sites.
Map Confirmation by Southern Blotting
To confirm the optical maps independently of sequence data, pulsed-field gels of total P. falciparum DNA digested with NheI or BamHI were run and blotted. Plasmid clones used as sequencing templates provided the probes to analyze the Southern blots. Restriction fragment sizes of the blots closely compared in size to the fragments determined by optical mapping and those predicted from the preliminary sequence. Probe PF2CM93 hybridized to a 7.5 kb band generated by NheI digestion and PFGE. The fragment size predicted from sequence information was 7.6 kb. The corresponding fragment size from the optical map was also 7.6 kb (Table 1). The same probe hybridized to a 41-kb band generated by BamHI digestion and PFGE. The fragment size predicted from sequence information was 41.3 kb. The corresponding fragment size from the optical map was 40.8 kb (Table 2). Probe PF2NA66 also generated data with fragment sizes that were very similar (Tables 1 and 2). By using the same probe on DNA digested with the two different enzymes, the optical maps were oriented and linked with one another.
DISCUSSION
We have generated a high resolution NheI and the BamHI optical restriction map of P. falciparum chromosome 2, which was used in sequence verification. Despite the fact that chromosome 2 is resolved easily by PFGE, we found the chromosome 2 gel slices to contain only 60% chromosome 2-specific DNA. The balance was contaminated with DNA molecules from other chromosomes. Consequently, a portion of the optical mapping data was rejected. Should we have mapped other chromosomes using the same strategy we could not predict the acquisition of concise data from chromosomes, which are less resolvable by PFGE, such as chromosomes 5–9.
To check the fidelity of the optical maps independently, Southern blotting of chromosome 2 DNA was performed. Sequenced small-insert clones were used as probes, enabling the optical maps to be cross-checked against the sequence. In all, the optical maps were verified against sequence data and Southern blot analysis, and were found to be very accurate. A more directed operation would be to use sequence-templates as probes for hybridizations to generate a series of anchors for sequence assembly. Such templates would be placed precisely onto the optical map, in terms of physical distance (kb) and would be critical for finishing genomic regions of high complexity; namely, tandem or inverted repeats of high homology and short sequence length. This approach would also readily assemble data acquired using different techniques and would allow the placement of very short sequence contigs onto a map. For example, STS markers or ESTs could be assigned to restriction fragments on a whole genome optical map.
Optical maps of entire chromosomes should also find utility at the sequence-assembly stage in which numerous large contigs are formed, but have unknown order along a chromosome. Traditional approaches to establish contig order rely, in part, on combinatorial PCR, or sequence alignment with physical landmarks, which are usually well defined in terms of order but not physical distance. This is where optical maps can streamline the final assembly process by reducing the required number of PCR reactions, by providing an easily interpretable physical scaffold with which sequence contigs can be aligned. The alignment process is to simply generate restriction maps in silico from the sequence data and compare this with the optical maps. When multiple enzymes are used independently and resulting maps are aligned properly, the composite map decreases the size of the sequence contig necessary for confident alignment to the final scaffold.
The information content of a multiple restriction enzyme map is greater than the sum of its parts (Lander and Waterman 1988). We used the sequence data to align the NheI and BamHI restriction maps with respect to each other, creating a composite map. We expected to find a number of restriction site reversals in this composite. That is, given our sizing errors, closely spaced fragments in the composite map may not be represented in the correct order, and would possibly shift relative position. To our initial astonishment, we found only one instance of reversal. Given this result, we decided to evaluate its statistical significance.
One way to evaluate the quality of a composite enzyme map is to examine how well it preserves the order of the restriction sites. For instance, if we create two maps, one with a restriction enzyme A and the other with the restriction enzyme B, and combine the two maps in correct order, it is still possible that the sizing error in the individual fragments may create a situation, in which a restriction site of type B appears before A, whereas the correct order (in the sequence) is A followed by B— restriction sites shift. Assume that both enzymes cut at the same rate E, and the genome (or chromosome) length is L. Then the total number of fragments of each type is N = LE. If the sizing error in a fragment is σ (for instance 1 kb), then the maximum sizing error occurs in the middle of the map and is bounded by (√N/2)σ (a rather conservative estimate). Thus, a fragment of length l, and cuts of type A in one end and of type B in the other end, may appear in the computed map as a fragment whose length is a random variable with mean l and standard deviation σ′ = (√N)σ. Thus the probability that this fragment will appear in the reversed order is bounded by Φ(l/σ′), where
 |
Furthermore, the length of the fragment with cuts A and B is distributed as 2Ee−2El. Thus, a random fragment of this kind has a length longer than σ‘ with probability e−2Eσ‘ and a simple estimate shows that the probability of reversal is bounded by
 |
Consider the following values of the parameters L = 980 kb, E = 1/30,000, σ = 1 kb. For these values, σ′ = 5.7 kb and the average fragment length (with two enzymes) is 15 kb. The above estimate indicates that the probability of reversal is bounded by 0.27. A somewhat better estimate can lower this value to 0.17. As the expected number of fragments with cuts A following B (or B following A) is ∼30, one would expect to see fewer than five reversals.
However, the composite map created by optical mapping has only one reversal. The probability of this situation (with fewer than 1 reversal) occurring is ∼1 in 40. More exactly, this probability is (1 − p)30 + 30 p (1 − p)29 = 0.023. This difference may signal the requirement for more sophisticated analysis, or indicates the presence of a potentially useful physical effect. A closer examination of the data reveals that the error in the fragment sizes in the composite map has a normal distribution with mean, 0.02 kb and standard deviation, 2.01 kb. Surprisingly, the error in the cut locations has a mean, −1.78 kb and a standard deviation, 1.82 kb, indicative of the presence of systematic (e.g., sequence-specific) error and much smaller unsystematic error. A recalculation of the expected number of reversals with the observed values (σ′ = 1.82 kb) results in slightly more than two reversals, making the observed number of reversals of only one much more likely (∼1 in 7 as opposed to 1 in 40). Note that as our estimate of σ′ is for the worst-case situation, we believe a more realistic analysis may close the gap. On the other hand, this may be caused by another biochemical effect that we do not account for in our analysis. More experiments and analyses are required to resolve this situation.
Current optical mapping studies of P. falciparum use whole genomic DNA as starting material. The chromosomes are resolved at the level of data rather than as physical entities. The data segregates into 14 deep contigs corresponding to the various chromosomes. Chromosome 2 can be resolved based on size and the near complete correspondence with the data shown in this paper (one 600-bp BamHI fragment is missing on the whole genome map). The success of this project has prompted the Malaria Genome Consortium to recommend support of whole genome mapping to assist in closure of chromosomes, as well as for verification of the final assembly.
In summary, we describe the construction of an ordered restriction map of P. falciparum chromosome 2 using optical mapping of genomic DNA. A combined approach using shotgun sequencing and optical mapping will facilitate sequence assembly and finishing of large and complex genomes.
METHODS
Parasite Preparation
P. falciparum (clone 3D7) was cultivated using standard techniques (Trager and Jensen 1976). To minimize possible alterations of the genome that can occur in continuous culture (Corcoran et al. 1986), parasite aliquots were kept frozen in liquid N2 until needed and then cultivated only as long as necessary. Parasites were cultivated to late trophozoite/early schizont stages and enriched on a Plasmagel gradient. The parasitized red blood cells were washed once with several volumes of 10 mm Tris (pH 8), 0.85% NaCl and the parasites were freed from the erythrocytes by incubation in ice-cold 0.5% acetic acid in dH2O for 5 min, followed by several washes in cold buffer. The parasites were resuspended to a concentration of 2 × 10⁹/ml in buffer and maintained in a 50°C waterbath. An equal volume of 1% InCert agarose (FMC, Rockland, ME) in buffer, prewarmed to 50°C, was mixed with the prewarmed parasites and the mixture was added to a 1 × 1 × 10-cm gel mold, plugged at one end with solidified agarose, and was allowed to cool to 4°C. The agarose-embedded parasites were pushed out of the mold and incubated with 50 ml of proteinase K solution (2 mg/ml proteinase K in 1% Sarkosyl, 0.5 M EDTA) at 50°C for 48 hr with one change of proteinase K solution and were stored in 50 mm EDTA at 4°C (Schwartz and Cantor 1984).
Chromosome 2 Isolation by PFGE
Uniform parasite slices were taken with a glass coverslip using two offset microscope slides as guides. One half to one quarter of a single slice was sufficient per lane. Parasite slices were arranged end to end on the flat side of the gel comb. The parasites were fixed to the comb by a small bead of molten (60°C) agarose. The comb was then placed into the gel mold and molten agarose [1.2% SeaPlaque (FMC) in 0.5× TBE] poured around the parasite-containing slices. Once cooled, the comb was removed and the space filled with molten agarose. A CHEF DRIII apparatus (Bio-Rad, Hercules, CA) was used for all PFGE (Schwartz and Cantor 1984) chromosome separations. Gels were run with 180–250 sec of ramped pulse time at 3.7 V/cm and 120° field angle, for 90 hr at 14°C with recirculating buffer at ∼1 l/min, using Saccharomyces cerevisiae and/or Hansenula wingei PFGE size markers (Bio-Rad). To minimize UV damage to the DNA, gel slices were removed from the ends of the gel, stained with ethidium bromide (5 μg/ml), and visualized by long wave (320 nm) UV light. Notches corresponding to the individual chromosomes were made in the agarose gel and used as guides to cut the chromosome from the gel. The chromosome-containing gel slices were stored in 50 mm EDTA at 4°C until needed. The gel was stained with ethidium bromide to verify the chromosome excision. The genome of P. falciparum is 26–30 Mb in size, consisting of 14 chromosomes ranging in size from 0.6–3.5 Mb (Foote and Kemp 1989). PFGE resolves most of the P. falciparum chromosomes, except 5–9 which are similar sizes and comigrate. The gel band containing Plasmodium falciparum chromosome 2 was resolved easily, cut from the gel, melted at 72°C for 7 min and incubated with agarose at 40°C for 2 hr. The melted agarose band was diluted in TE to a final DNA concentration suitable for optical mapping (∼20 pg/μl.
Mounting and Digestion of DNA on Optical Mapping Surface
Optical mapping surfaces were prepared as described previously (Aston et al. 1999). Briefly, glass coverslips (18 × 18 mm2; FISHER Finest, Pittsburgh, PA) were cleaned by boiling in concentrated nitric, then hydrochloric acid. Surfaces were derivatized with 3-aminopropyldiethoxymethyl silane (APDEMS; Aldrich Chemical, Milwaukee, WI). One surface was placed onto a microscope slide. A DNA sample (10 μl) was added to the edge between the surface and the slide and spread into the space between the surface and the slide. The surface was then peeled off from the slide. Digestion was performed by adding 100 μl of digestion solution [50 mm NaCl, 10 mm Tris-HCl (pH 7.9), 10 mm MgCl2, 0.02% Triton X-100, 20 units of restriction endonuclease; New England Biolabs, Beverly, MA] onto the surface and incubating at 37°C from 15 to 30 min. The buffer was aspirated and the surface washed with water before staining of DNA with YOYO-1 homodimer (Molecular Probes, Eugene, OR), prior to fluorescence microscopy. Comounted λ bacteriophage DNA (New England Biolabs) was used as a sizing standard and also to estimate cutting efficiencies.
Image Acquisition, Processing, and Map Construction
DNA molecules were imaged by digital fluorescence microscopy. The optical mapping surface was scanned by the operator for individual digested DNA molecules of adequate length and quality to be collected for image processing and map making. Images were collected with a cooled charge coupled device (CCD) camera (Princeton Instruments, Trenton, NJ) using Optical Map Maker (OMM) software, as described previously (Jing et al. 1998). Images of DNA fragments were processed using a modified version of NIH Image (Huff 1996) which integrates fluorescence intensity for each fragment. These values were used to assemble an ordered restriction map for each molecule. Fluorescence intensity of λ bacteriophage DNA standards was used to measure the size of the P. falciparum restriction fragments on a per image basis. Cutting efficiences (on a per image basis) were determined from scoring cut sites on sizing standard molecules contained in the same field as the genomic DNA molecules. Standard molecules were cut once by NheI and five times by BamHI. The map for the entire chromosome 2 was manually assembled into contigs by aligning overlapping regions of congruent cut sites. If there were no overlapping regions, the molecules were considered to be from a contaminating P. falciparum chromosome and were discarded. Consensus maps for chromosome 2 were assembled by averaging the fragment sizes from the individual maps derived from maps underlying the contigs.
Southern Blotting of P. falciparum Genomic DNA
P. falciparum genomic DNA (10 μg) was digested with NheI or BamHI, resolved by PFGE (POE apparatus, 1% gel in 0.5 × TBE, pulse time, 1 sec, 2 sec; switch time, 12 sec, 150 V, for 24 hr) (Schwartz and Koval 1989), blotted, and hybridized with probes derived from small insert clones used for sequencing (PF2CM93 and PF2NA66). Probes were labeled by random priming.
Acknowledgments
This work was supported by the Burroughs Wellcome Fund and the Naval Medical Research and Development Command work unit STEP C611102A0101BCX. The opinions and assertions herein are those of the authors and are not to be construed as official or as reflecting the views of the U.S. Navy or naval service at large.
The publication costs of this article were defrayed in part by payment of page charges. This article must therefore be hereby marked “advertisement” in accordance with 18 USC section 1734 solely to indicate this fact.
Footnotes
E-MAIL schwad01@mcrcr.med.nyu.edu; FAX (212) 995-8487.
REFERENCES
- Ananthraman TS, Mishra B, Schwartz DC. Genomics via optical mapping II: Restriction maps. J Comput Bio. 1997;4:91–118. doi: 10.1089/cmb.1997.4.91. [DOI] [PubMed] [Google Scholar]
- Anantharaman TS, Mishra B, Schwartz DC. Genomics via optical mapping III: Contiging genomic DNA and variations. Courant Technical Report #760. New York: Courant Institute; 1998. [Google Scholar]
- Aston, C., C. Hiort, and D.C. Schwartz. 1999. Optical mapping: An approach for fine mapping. Methods Enzymol. 303: (in press). [DOI] [PubMed]
- Cai W, Aburatani H, Housman D, Wang Y, Schwartz DC. Ordered restriction endonuclease maps of yeast artificial chromosomes created by optical mapping on surfaces. Proc Natl Acad Sci. 1995;92:5164–5168. doi: 10.1073/pnas.92.11.5164. [DOI] [PMC free article] [PubMed] [Google Scholar]
- Cai W, Jing J, Irvin B, Ohler L, Rose E, Kim U, Simon M, Schwartz DC. High resolution restriction maps of bacterial artificial chromosomes constructed by optical mapping. Proc Natl Acad Sci. 1998;95:3390–3395. doi: 10.1073/pnas.95.7.3390. [DOI] [PMC free article] [PubMed] [Google Scholar]
- Corcoran LM, Forsyth KP, Bianco AE, Brown GV, Kemp DJ. Chromosome size polymorphism in plasmodium falciparum can involve deletions and are frequent in nature parasite populations. Cell. 1986;44:87–95. doi: 10.1016/0092-8674(86)90487-3. [DOI] [PubMed] [Google Scholar]
- Dame JB, Arnot DE, Bourke PF, Chakrabarti D, Christodoulou Z, Coppel RL, Cowman F, Craig AG, Fischer K, Foster J, et al. Current status of the Plasmodium falciparum genome project. Mol Biochem Parasitol. 1996;79:1–12. doi: 10.1016/0166-6851(96)02641-2. [DOI] [PubMed] [Google Scholar]
- Foote SJ, Kemp DJ. Chromosomes of malaria parasites. Trends Genet. 1989;5:337–342. doi: 10.1016/0168-9525(89)90139-x. [DOI] [PubMed] [Google Scholar]
- Foster J, Thompson J. The Plasmodium falciparum genome project: A resource for researchers. The Wellcome Trust Malaria Genome Collaboration. Parasitol Today. 1995;11:1–4. [Google Scholar]
- Gardner MJ, Tettelin H, Carucci DJ, Cummings LM, Aravind L, Koonin EV, Shallom S, Mason T, Yu K, Fujii C, et al. Chromosome 2 sequence of the human malaria parasite Plasmodium falciparum. Science. 1998;282:1126–1132. doi: 10.1126/science.282.5391.1126. [DOI] [PubMed] [Google Scholar]
- Huff E. Ph.D. thesis. New York, NY: Department of Chemisty, New York University; 1996. [Google Scholar]
- Jing J, Reed J, Huang J, Hu X, Clarke V, Edington J, Housman D, Anantharaman T, Huff E, Mishra B, et al. Automated high resolution optical mapping using arrayed, fluid fixed, DNA molecules. Proc Natl Acad Sci. 1998;95:8046–8051. doi: 10.1073/pnas.95.14.8046. [DOI] [PMC free article] [PubMed] [Google Scholar]
- Lander ES, Waterman MS. Genomic mapping by fingerprinting random clones: A mathematical analysis. Genomics. 1988;2:231–239. doi: 10.1016/0888-7543(88)90007-9. [DOI] [PubMed] [Google Scholar]
- Lin, J., R. Qi, C. Aston, J. Jing, T.S. Anantharaman, B. Mishra, O. White, J.C. Venter, and D.C. Schwartz. 1998. Complete shotgun optical mapping of Deinococcus radiodurans and Escherichia coli K12 using genomic DNA molecules. Submitted. [DOI] [PubMed]
- Netzel TL, Nafisi K, Zhao M, Lenhard JR, Johnson I. Base-content dependence of emission enhancements, quantum yields, and lifetimes for cyanine dyes bound to double-strand DNA: Photophysical properties of monomeric and bichromophoric DNA stains. J Phys Chem. 1995;99:17936–17947. [Google Scholar]
- Schwartz DC, Cantor CR. Separation of yeast chromosome-sized DNAs by pulsed field gradient gel electrophoresis. Cell. 1984;37:67–75. doi: 10.1016/0092-8674(84)90301-5. [DOI] [PubMed] [Google Scholar]
- Schwartz DC, Koval M. Conformational dynamics of individual DNA molecules during gel electrophoresis. Nature. 1989;338:520–522. doi: 10.1038/338520a0. [DOI] [PubMed] [Google Scholar]
- Schwartz DC, Li X, Hernandez L, Ramnarain S, Huff E, Wang Y. Ordered restriction maps of Saccharomyces cerevisae chromosomes constructed by optical mapping. Science. 1993;262:110–114. doi: 10.1126/science.8211116. [DOI] [PubMed] [Google Scholar]
- Sinnis P, Wellems TE. Long-range restriction maps of Plasmodium falciparum chromosomes: Crossingover and size variation among geographically distant isolates. Genomics. 1988;3:287–295. doi: 10.1016/0888-7543(88)90117-6. [DOI] [PubMed] [Google Scholar]
- Trager W, Jensen JB. Human malaria parasites in continuous culture. Science. 1976;193:673–675. doi: 10.1126/science.781840. [DOI] [PubMed] [Google Scholar]
- Thompson JK, Cowman AF. A YAC contig and high resolution map of chromosome 3 from Plasmodium falciparum. Mol Biochem Parasitol. 1997;90:537–542. doi: 10.1016/s0166-6851(97)00203-x. [DOI] [PubMed] [Google Scholar]
- Watanabe J, Inselburg J. Establishing a physical map of chromosome No. 4 of Plasmodium falciparum. Mol Biochem Parasitol. 1994;65:189–199. doi: 10.1016/0166-6851(94)90071-x. [DOI] [PubMed] [Google Scholar]