

Abstract
Whether mitotic structures like the centrosome can self-organize from the regulated mobility of their dynamic protein components remains unclear. Here, we combine fluorescence spectroscopy and chemical genetics to study in living cells the diffusion of polo-like kinase 1 (PLK1), an enzyme critical for centrosome maturation at the onset of mitosis. The cytoplasmic diffusion of a functional EGFP-PLK1 fusion correlates inversely with known changes in its enzymatic activity during the cell cycle. Specific EGFP-PLK1 inhibition using chemical genetics enhances mobility, as do point mutations inactivating the polo-box or kinase domains responsible for substrate recognition and catalysis. Spatial mapping of EGFP-PLK1 diffusion across living cells, using raster image correlation spectroscopy and line scanning, detects regions of low mobility in centrosomes. These regions exhibit characteristics of increased transient recursive EGFP-PLK1 binding, distinct from the diffusion of stable EGFP-PLK1–containing complexes in the cytoplasm. Chemical genetic suppression of mitotic EGFP-PLK1 activity, even after centrosome maturation, causes defects in centrosome structure, which recover when activity is restored. Our findings imply that continuous PLK1 activity during mitosis maintains centrosome self-organization by a mechanism dependent on its reaction and diffusion, suggesting a model for the formation of stable mitotic structures using dynamic protein kinases.
Keywords: mitotic kinase, macromolecular assembly, reaction-diffusion mechanism
The centrosome, the major microtubule-organizing center in the cell, consists of two centrioles surrounded by a protein matrix termed the pericentriolar material (PCM). Unusually among cytoplasmic organelles the centrosome is not membrane bound. Instead, it assembles from protein components present in the cytoplasm, exemplifying a major unresolved question concerning whether mitotic structures can self-organize from diffusing components (1–3). Fluorescence recovery after photobleaching (FRAP) studies indicate that centrosomal proteins freely exchange in a dynamic manner with the surrounding cytoplasm (4–6) and, furthermore, that the rate of association may affect centrosome structure (7). Centrioles and the PCM can form de novo under certain conditions (8, 9). These observations suggest that centrosomes may self-organize as a steady-state assembly from the transient residence of diffusible proteins. A centrosomal enzyme, the mitotic serine/threonine kinase polo-like kinase 1 (PLK1), is essential for the enrichment of multiple components including γ-tubulin (10–12), pericentrin (PCNT), and NEDD1 (13) in the centrosome at the onset of mitosis (a process termed centrosome maturation; reviewed in ref. 14). It has been suggested that the dynamic exchange of centrosomal PLK1 with a freely diffusing cytoplasmic pool is important for normal mitotic progression (6). However, it is not clear how PLK1’s diffusional mobility is controlled inside cells or how this may contribute to the role of PLK1 in centrosome self-organization. Here, we have addressed these problems by combining in vivo fluorescence fluctuation spectroscopy with chemical genetics.
Results
Cell Cycle-Dependent Changes in EGFP-PLK1 Mobility in the Centrosome and Cytoplasm.
We used a previously described (15) retinal pigment epithelium cell line immortalized using human telomerase (hTERT-RPE1), which expresses an EGFP-PLK1 fusion protein that functionally replaces endogenous PLK1 (EGFP-PLK1/PLK1−/−). We first measured the exchange between cytoplasmic and centrosomal EGFP-PLK1 during different cell-cycle stages using FRAP (16). Centrosomal EGFP-PLK1 exchanged almost completely within seconds after photobleaching during all cell-cycle stages, as shown by a FRAP recovery curve plateau at ∼85–95% after ∼40 s (Fig. 1A). Our findings imply that, on this timescale, centrosomal populations of EGFP-PLK1 freely exchange with molecules in the cytoplasm and that little (∼5–15%) of the protein is fixed within the structure, after image correction for photobleaching. Interestingly, the dynamic exchange between centrosomal and cytoplasmic EGFP-PLK1 is cell-cycle dependent. Fluorescence recovery was significantly slower during prophase and metaphase (time taken for half-maximal recovery, t1/2 = 5.6 ± 0.3 s and 6.4 ± 0.7 s) than during either interphase or cytokinesis (t1/2 = 4.2 ± 0.5 s and 2.4 ± 0.7 s, t test, P < 0.01) (Fig. 1A). Notably, the slowed exchange rate during prophase and metaphase coincides with the known peak in PLK1 kinase activity (17, 18) marked by phosphorylation (18, 19) of PLK1 on threonine 210 (Fig. S1).
Fig. 1.

Cell cycle-dependent changes in EGFP-PLK1 mobility in the centrosome and cytoplasm. (A) FRAP analysis in EGFP-PLK1 PLK1−/− cells. EGFP-PLK1 in the centrosome was bleached for 1.2 s and recovery monitored at 0.5-s intervals. t1/2 values represent the time taken for 50% maximal recovery, visible as the gradient of the graph. Images show cell-cycle stages in representative fixed cells; white arrowheads denote centrosomes. (Scale bars, 5 μm.) Data show the mean ± SEM (n = 20 cells) from two independent experiments. (B) Diagram of FCS methodology, showing how temporal analysis of fluorescence fluctuations (i) is converted into the autocorrelation function (ACF) (ii), which is related to diffusion time (iii). (C) FCS measurements of EGFP-PLK1 (red) are right shifted compared with free EGFP (black). Readings were taken in the cytoplasm of interphase EGFP-PLK1 PLK1−/− cells (crosshair in image) or RPE cells expressing EGFP. FCS curves (circles) are overlaid with the fits (solid lines) from which diffusion coefficients were determined. Values show the mean ± SEM from ≥20 measurements taken in 20 different cells. Data are representative of three independent experiments. (D) Cell cycle-dependent EGFP-PLK1 mobility in the cytoplasm. EGFP-PLK1 diffusion coefficient values were calculated from FCS measurements derived as described in B and C. Each point of the dot plot represents the measurement from a single cell, produced from 10 × 5-s readings. The crosshairs in the images mark where the confocal volume was positioned for FCS analysis. Data are representative of three independent experiments.
The relatively low expression of EGFP-PLK1 in our experimental system, and rapid fluorescence recovery in the cytoplasm, precluded analysis of cytoplasmic diffusion using FRAP. We therefore measured cytoplasmic EGFP-PLK1 mobility using fluorescence correlation spectroscopy (FCS), which is well suited to the analysis of fast-diffusing species present in low concentrations (20). FCS records fluorescence intensity fluctuations in a small confocal volume (∼0.25 fL in our instrument) as a function of time, enabling inferences concerning physical properties including the rate of effective diffusion within the crowded and heterogeneous cellular environment (21) (Fig. 1B).
Using a previously described experimental setup (22), we find that EGFP-PLK1 fluorescence fluctuations exhibit a clear FCS autocorrelation function (ACF), whereas autofluorescence in wild-type RPE cells does not. As expected, the ACF for EGFP-PLK1 was significantly shifted to longer times compared with that for free EGFP alone, indicative of slower diffusion (Fig. 1C). The ACF for free EGFP could be fitted to a one-component model of 3D diffusion (23, 24) to give an effective diffusion coefficient, D, of 31.1 μm2/s, consistent with values previously reported using FCS and other methods (16, 25, 26). In contrast, fitting of the EGFP-PLK1 ACF with acceptable residuals required the addition of an anomaly parameter (Eq. S3 in SI Methods; see SI Discussion for discussion of FCS fitting and Fig. S2), yielding a D value for EGFP-PLK1 of 6.6 ± 0.6 μm2/s. Interestingly, FCS measurements of cytoplasmic EGFP-PLK1 diffusion at different cell-cycle stages closely paralleled our FRAP results interrogating its dynamic exchange at the centrosome (compare Fig. 1A and 1D—colors are consistent). Thus, cytoplasmic EGFP-PLK1 mobility was slower during prophase and metaphase (D = 4.8 ± 0.4, 3.4 ± 0.2 μm2/s) than in interphase or cytokinesis (D = 6.6 ± 0.6, 5.5 ± 0.3 μm2/s). The data in Fig. 1 show with two independent techniques that cell-cycle progression regulates both the dynamic exchange between cytoplasmic and centrosomal EGFP-PLK1 and its diffusional mobility in the cytoplasm.
Inhibition of EGFP-PLK1 Catalytic Activity Increases Mobility.
The inverse correlation between EGFP-PLK1 diffusion and variations in PLK1 activity at different cell-cycle stages prompted us to predict that a reduction in PLK1 enzymatic activity should increase its mobility. To test this hypothesis, we exploited a previously established chemical genetic strategy (15), wherein endogenous PLK1 has been replaced with EGFP-PLK1(as), a form of the enzyme in which the catalytic pocket has been engineered to accommodate a nonnatural ATP analog, 3-MB-PP1, which serves as a rapid and specific inhibitor without detectable effects on normal protein function (27). Indeed, we confirmed that the introduction of EGFP-PLK1(as) itself had no effect on dynamics in the absence of inhibitor, nor did the addition of 3-MB-PP1 have any effect on EGFP-PLK1 WT in PLK1−/− cells (Fig. S3 A and B).
We treated cells expressing EGFP-PLK1(as) with 20 μM 3-MB-PP1 for 2.5 h. As expected from previous studies using this system (15), this treatment caused a modest increase in the percentage of cells with 4N DNA content in the G2/M phases of the cell cycle compared with DMSO mock-treated cells, as well as the appearance of cells arrested in prometaphase (Fig. S3 C and D). Notably, the rapid and specific inhibition of EGFP-PLK1(as) activity by this chemical genetic strategy was accompanied by an increase in its cytoplasmic diffusion measured by FCS (Fig. 2A). Thus, during prophase, the diffusion coefficient of EGFP-PLK1(as) increases to 9.9 ± 1 μm2/s after 3-MB-PP1 treatment compared with 5.4 ± 0.5 μm2/s in DMSO mock-treated cells (t test, P < 0.01).
Fig. 2.

Inhibition of EGFP-PLK1 catalytic activity increases mobility. (A) Chemical genetic inhibition of EGFP-PLK1(as) kinase activity increases cytoplasmic mobility. FCS analysis was performed as described in Fig. 1 in EGFP-PLK1(as) PLK1−/− cells treated for 2.5 h with 20 μM 3MB-PP1 (blue) or with DMSO (black). (B) Genetic inactivation of EGFP-PLK1 kinase activity increases cytoplasmic mobility. RPE cells transiently expressing either EGFP-PLK1 wild type (black) or the kinase-dead mutant, K82M (red) were analyzed by FCS in the cytoplasm during interphase as described in Fig. 1. (C) Genetic inactivation of PBD–substrate interactions increases the cytoplasmic mobility of EGFP-PLK1. Cells stably expressing EGFP-PLK1 wild type (black) or the PBD mutant, HK538/540 AM (red), were analyzed by FCS. In A–C, the horizontal bars show the mean ± SEM; each dot represents the measurement in a single cell, produced from 10 × 5-s readings. Data represent two independent experiments.
For further confirmation that PLK1 kinase activity can affect its mobility, we studied the diffusion of a catalytically inactive mutant form of EGFP-PLK1, K82M, in which a lysine residue involved in ATP binding has been substituted with methionine (28). In interphase cells transiently expressing the mutant enzyme, analysis of cytoplasmic diffusion using FCS reveals that the D value for the cytoplasmic ATP-binding mutant is significantly increased in comparison with the wild-type enzyme (D = 8.6 ± 0.5, 5.7 ± 0.3 μm2/s, t test, P < 0.01). Therefore, results from two independent systems support the notion that cytoplasmic EGFP-PLK1 diffusion is inversely correlated with catalytic activity (Fig. 2B).
In addition to its kinase catalytic domain, PLK1 contains a phosphopeptide-binding domain [the Polo box domain (PBD)] that mediates substrate recognition (29). We used a well-characterized mutant form of PLK1 PBD mutant in which two amino acids (histidine/lysine 538/540) in the PBD are mutated to alanine and methionine, respectively, reducing the strength and duration of phosphopeptide–substrate binding (29). It has previously been reported using FRAP that an EGFP-PLK1 HK538/540 AM mutant exhibits increased dynamic exchange in the centrosome of transiently transfected interphase cells (30). Therefore, we first extended these studies to compare the FRAP curves of EGFP-PLK1 and the EGFP-PLK1 HK538/540 AM mutant at the centrosomes of stably expressing EGFP-PLK1 RPE cells at different cell-cycle stages. The difference in the dynamic exchange of the wild-type and mutant proteins peaked during prophase, when t1/2 values were 3.27 ± 0.3 s and 0.9 ± 0.1 s, respectively (Fig. S4). Notably, the cytoplasmic diffusion of mutant EGFP-PLK1 HK538/540 AM measured by FCS was also increased during late G2/prophase compared with the wild-type enzyme (Fig. 2C), with effective diffusion enhanced to 7.44 ± 0.44 μm2/s. Taken together, our results demonstrate that disruption of the substrate-binding PBD domain of EGFP-PLK1 increases diffusional mobility both at the centrosome and in the cytoplasm, as does the specific inhibition of EGFP-PLK1 catalytic activity.
Raster Image Correlation Spectroscopy (RICS) Reveals a Region of Low EGFP-PLK1 Mobility at the Centrosome with Characteristics of Transient Binding.
We explored the role of PLK1 mobility in the maintenance of centrosomal structure by simultaneously mapping EGFP-PLK1 diffusion in the cytoplasm and centrosomes of living cells, using RICS. RICS is a confocal laser scanning image analysis technique (31) that detects fluctuations between many focal points in the sample to determine the diffusion coefficient in different cellular locales (Fig. 3 A and B). We validated this technique in our experimental system using numerous control measurements in vitro and in vivo to minimize possible artifacts before taking EGFP-PLK1 measurements (summarized in SI Discussion and Fig. S5).
Fig. 3.

Raster image correlation spectroscopy (RICS) reveals a region of low EGFP-PLK1 mobility at the centrosome with characteristics of transient binding. (A) Schematic representation of RICS methodology. (A, i) Particle movement (blue arrow) can be detected in raster scanning image time series from a confocal microscope (black lines). (A, ii) Fluctuations between pixels in different locations are detected and represented with the RICS autocorrelation function (rACF), GRICS, the shape of which reveals diffusion time. GRICS(0, 0) is plotted at the center of the grid. (B) RICS data collection area, denoted by the white box, at the centrosome and surrounding cytoplasm of a single EGFP-PLK1 PLK1−/− cell. (Scale bar, 5 μm.) (C) RICS analysis in the subcellular area shown in b, using a pixel dwell time of 12.61 μs and 125 frames. (C, i) A single frame of the time series, pseudocolored relative to fluorescence intensity. (Scale bar, 1.4 μm.) (C, ii) rACF calculated inside the subregions indicated in C, i, using a moving average of eight frames, pseudocolored relative to GRICS(x, y). (C, iii) rACF fits in 3D, using Eq. S7 in SI Methods to obtain the diffusion coefficients shown. Fit residuals are shown above the data. (D) EGFP-PLK1 diffusion is corralled at the centrosome. A diffusion map of the subcellular area indicated in B is shown, created by iteratively applying the RICS analysis to 64 × 64 pixel subregions. D, i shows a single frame of the time series for reference and D, ii shows the same area pseudocolored according to diffusion coefficient. (Scale bar, 1.4 μm.) (E) An increased proportion of centrosome rACFs show characteristics of transient binding compared with the cytoplasm. (E, i) Schematic representation of slowing through either “stop–start” binding or diffusion in massive complexes. (E, ii) The bar graph illustrates the average percentage of measurements classified as either binding or diffusion on the basis of analysis of the rACF shape relative to the point spread function (PSF) and after moving average length titration (described further in ref. 32 and SI Discussion). Data in B–D show a single cell representative of five independent experiments, whereas E, ii is representative of 30 individual cells analyzed in two independent experiments. Experimental averages are given in the main text.
We found that the shapes of the RICS ACF curves (rACFs) were markedly different in the centrosome versus the cytoplasm. A representative analysis in a single cell (Fig. 3C) shows that the rACF at the centrosome was more extended in the vertical scanning direction at short pixel shifts, engendering a rounder overall shape, suggestive of slower diffusion. Indeed, fitting of the rACFs generated from multiple cells with a one-component model of anomalous diffusion (Eq. S3 in SI Methods) showed that the centrosomal EGFP-PLK1 pool consistently had a slower diffusion coefficient compared with the cytoplasmic pool (0.9 ± 0.3 μm2/s versus 5.9 ± 0.4 μm2/s, mean ± SEM, five independent experiments). Mapping back the diffusion coefficients onto a confocal slice area of the cell strikingly highlights how EGFP-PLK1 mobility is corralled at the centrosome, but relatively unimpeded in the cytoplasm (Fig. 3D). This difference does not simply reflect differences in the physical properties of the two environments or a general property of other proteins, because an inert tracer, free mCherry, expressed in the same cells exhibited no centrosomal corralling (Fig. S6).
We therefore surmised that the diffusion of EGFP-PLK1 might be slowed in the centrosome through its interaction with other molecules in this environment. As reported in previous studies of protein diffusion within cells (32, 33), two modes of intermolecular interaction can be envisioned. Centrosomal EGFP-PLK1 could be slowed either through transient binding interactions that induce a “stop–start” motion or, instead, through stable assembly into massive multiprotein complexes that exhibit a continuous random walk (Fig. 3E, i). We used a previously described analysis of the shape of the rACFs to distinguish between these two possibilities (32). Whereas the slow diffusion of massive stable complexes broadens the rACF at long pixel shifts because particle movements between pixels are detected, rapid particle binding and unbinding in the microsecond–millisecond timescale conversely causes the rACF to narrow at long pixel shifts. We quantified the frequency of these characteristics in the RICS readings taken in the centrosome and cytoplasm (SI Methods and Fig. S7). Centrosomal rACFs frequently showed characteristics of transient binding (in 74% of 31 cells from two independent experiments) compared with cytoplasmic measurements (only 26%) (Fig. 3E, ii). Our data are therefore consistent with the interpretation that transient recursive binding contributes to the slowing of EGFP-PLK1 mobility in the centrosome.
Line Scanning Reveals a Region of Restricted EGFP-PLK1 Mobility at the Centrosome.
RICS has limited spatial resolution (31, 34), which in our system we found to be an area of size ∼3.5 × 3.5 μm in control measurements (these areas are depicted in Fig. 3C, i). Therefore, to investigate PLK1 centrosomal corralling further at higher spatial resolution, we used line-scanning FCS as described previously (31, 35, 36). A single line of 64 pixels encompassing the centrosome and surrounding cytoplasm was scanned rapidly (5-μs dwell time on each pixel) and repeatedly (100,000 lines) to sample many locations simultaneously (Fig. 4A). The scanned line is represented as a “carpet diagram” of fluorescence intensity, with time plotted on the y axis and pixel position along the scan line on the x axis (Fig. 4 B and C). The temporal ACF calculated down each column as in FCS (Eq. S1 in SI Methods) represents the fluorescence fluctuations in a diffraction-limited spot that has a volume of ∼0.8 fL in our experimental system.
Fig. 4.

Line scanning reveals a region of restricted EGFP-PLK1 mobility at the centrosome. (A) Line-scanning data collection line (white arrow) passing across the centrosome (red arrow), in an EGFP-PLK1(wt) cell undergoing metaphase of mitosis. (B) Schematic of line-scanning data collection and analysis, showing how a time series along a single line is represented as an intensity carpet whereby the x axis represents the pixel position in space along the line and the y axis represents time. The FCS ACF, G(τ) (Eq. S2 in SI Methods), is calculated down each x-axis column and fitted to a model to obtain a diffusion coefficient for that pixel. (C) Line-scanning intensity carpet diagram of EGFP-PLK1 collected along the line denoted by the white arrow in A. A total of 100,000 lines were collected with a pixel dwell time of 5 μs. The diagram is pseudocolored relative to fluorescence intensity; note the accumulation of EGFP-PLK1 in the centrosome. (D) A larger time segment of the carpet diagram collected in C, displayed by averaging the y axis to show ∼12 s of time in total, and corrected for whole organelle movements. (E) The ACF, G(τ), calculated down each column of the line scan, colored according to the amplitude of G(τ). Note the longer decay along the time axis in columns corresponding in position to the centrosome. (F) EGFP-PLK1 diffusion is corralled at the centrosome. The line graph shows diffusion coefficient value versus pixel position. Diffusion coefficients were calculated by fitting the ACFs in E with a one-component anomalous diffusion model (Eq. S3 in SI Methods). A section of the intensity carpet diagram indicating the position of the centrosome is at the top of the graph. Shown are measurements from a single cell representative of two independent experiments on 30 cells in total.
Line-scanning FCS analysis of EGFP-PLK1 diffusion supported the conclusions drawn from RICS. The timescale of ACF decay at the centrosome was much longer than in the adjacent cytoplasm (Fig. 4E, compare approximately column 30 with approximately column 50), indicative of the slower mobility of EGFP-PLK1 in this location, consistent with RICS analysis (Fig. 3). Notably, a plot of the diffusion coefficient in square micrometers per second versus pixel position along the scanning line shows a relatively sharp decay in diffusion coefficient at the position corresponding to the centrosome (Fig. 4F, compare the line graph with the intensity carpet). Thus, collectively, our observations using line-scanning FCS also suggest EGFP-PLK1 is corralled in the centrosome through transient recursive binding interactions.
Continuous PLK1 Activity Is Required During Mitosis to Maintain PCM Structure Even After Centrosome Maturation.
The data in Figs. 3 and 4 collectively identify two unrecognized features of EGFP-PLK1 mobility in living cells. First, EGFP-PLK1 exhibits considerable heterogeneity of effective diffusional motion within the cellular environment, evident in the marked slowing of its mobility in the centrosome compared with the cytosol. Second, the slowing of EGFP-PLK1 diffusion in the centrosome is accompanied by characteristics of continuous, but transient, recursive binding within this organelle. Together with our data demonstrating an inverse correlation between EGFP-PLK1 activity and mobility (Figs. 1 and 2), these features suggest that EGFP-PLK1 is organized into centrosomes by a mechanism that depends on its reaction and diffusion. We therefore reasoned that continuous EGFP-PLK1 activity during mitosis would be required to maintain centrosome structure by such a mechanism. To test this idea, we exploited chemical genetics to rapidly and specifically inactivate or restore PLK1 activity, using 3MB-PP1 in EGFP-PLK1(as) cells synchronized in prometaphase with nocodazole (Nz). Nz-induced mitotic arrest occurs after centrosome maturation in early mitosis, and therefore, as expected, Nz-arrested cells contained two centrosomes that were enriched in PCM relative to interphase. Strikingly, exposure to 10 μM 3MB-PP1 induced a marked dissolution in centrosome structure compared with the control, with a significant decrease in multiple PCM components, including γ-tubulin, NEDD1, and PCNT (Fig. 5 A and B; t test, P < 0.01). PCM dissolution occurred rapidly after 3MB-PP1 treatment; changes were visible in 30 min, which became significant at 2 h (Fig. S8). This effect could be reversed when 3MB-PP1 was removed from Nz-arrested cell cultures (Fig. 5 A and B). Four hours after 3MB-PP1 withdrawal, the levels of γ-tubulin, PCNT, and NEDD1 in the centrosome had recovered to control levels. Thus, continuous PLK1 activity is required during mitosis even after centrosome maturation to sustain centrosome self-organization.
Fig. 5.

Continuous PLK1 activity is required during mitosis to maintain PCM structure even after centrosome maturation. (A) Nocodazole (Nz)-arrested EGFP-PLK1(as) cells were treated with the EGFP-PLK1(as) inhibitor 3MB-PP1 or mock treated with DMSO, before either fixation or washout of 3MB-PP1 and recovery in media containing Nz. Representative maximum intensity z-stack confocal projections typical of three experiments are shown. Note the decrease in intensity of the pericentriolar (PCM) components PCNT, γ-tubulin, and NEDD1 after PLK1 inhibition and recovery after inhibitor washout. (Scale bar, 4 μm.) (B) Dot plot quantification of average fluorescence intensity of the PCM staining performed in A, whereby each dot represents a single cell (≥27 cells per sample), and horizontal lines show mean ± SEM. Data are representative of three independent experiments. (C) Model for the regulation of centrosome self-organization by PLK1 mobility. Black dots represent PLK, and red dots show putative substrates. (C, 1) PLK1 mobility is controlled by activity (indicated by ATP) in both the cytoplasmic and centrosomal pools. (C, 2) Mobility is spatially heterogeneous due to transient, recursive interactions. (C, 3) Continuous PLK1 activity enhances transient, recursive interactions required for the maintenance of centrosome structure even after centrosome maturation.
Discussion
We surmise that the behavior of PLK1 is an example of stigmergy, the principle whereby system components influence each other through dynamic interactions that leave traces or marks in their environment (1, 37). Thus, substrate modification by PLK1 may, in turn, stimulate the transient recursive binding interactions that slow its diffusion, and this stigmergic feedback loop may enable self-organization in structures like the centrosome. Interestingly and in support of our proposal, the rate of exchange of a centrosomally localized PLK1 substrate, Cnn, between the PCM and cytosol has recently been shown to affect centrosome structure (7). Thus, our proposal may more generally help to explain why PLK1 phosphorylates several centrosomal proteins whose modification is necessary for centrosomal structure (38, 39) and why artificial tethering of a PLK1 fusion protein within centrosomes triggers abnormalities in structure (6). From this perspective, two fundamental determinants of PLK1 behavior—diffusion and reaction—may be considered interdependent rather than separable. These considerations provide insight into how dynamic enzymes can self-organize in a manner dependent on their catalytic activity into stable cytoplasmic organelles (1–3).
Consistent with this model, a simple in silico simulation incorporating the diffusion and binding parameters we have measured for EGFP-PLK1 suggests that recursive binding interactions may allow the steady-state localization of PLK1 into a region of high substrate concentration (Fig. S9 and SI Discussion). Which of the >300 predicted PLK1 substrates is responsible for this behavior remains to be determined, although several are reported to concentrate in the centrosome (e.g., ref. 7), raising the possibility that multiple enzyme–substrate reactions may contribute.
In conclusion, we present in this work three key observations that together suggest a model wherein centrosome PCM self-organization is sustained by the continuous activity of the PLK1 kinase through a reaction–diffusion mechanism. We first show using FRAP and FCS that EGFP-PLK1 substrate binding and catalytic activity regulate its cytoplasmic mobility, with decreased activity increasing the mobility of the enzyme. Second, RICS and line-scanning FCS reveal that a region of restricted EGFP-PLK1 diffusion in the centrosome correlates with characteristics of transient recursive interactions of the enzyme in this structure. Finally, a specific chemical genetic strategy confirms that ablation of EGFP-PLK1 activity even after centrosome maturation triggers defects in centrosome structure that can be reversed by the restoration of enzyme activity. Thus, our observations exemplify a reaction–diffusion mechanism (1) whereby the activity of a mitotic kinase contributes to the self-organization of diffusing mitotic proteins into a key mitotic organelle.
Methods
FCS.
One focus FCS was performed with the Zeiss Confocor2 system and a C-Apochromat 40× numerical aperture 1.2 water immersion objective as previously described (22). Samples were excited using a 488-nm laser operating at 0.8% and imaging over the 505- to 550-nm spectral band. The size of the lateral radius (w0) and the structural parameter (S) were determined using a 10-nM rhodamine 6G (Rh6G) solution in water at 25 °C 100 μm above the coverslip, assuming a diffusion coefficient of 400 μm2/s. We thus obtained values of 0.2 μm and 5 for w0 and S, respectively, which were kept constant during fitting. The normalized ACF G(τ) of fluorescence fluctuations was calculated using Zeiss ConfoCor2 software,
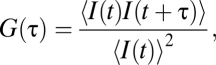 |
where I(t) is the fluorescence intensity, τ is the lag time, and 〈 〉 represents a temporal average. Models used to fit the autocorrelation function are given in SI Methods. Diffusion coefficients (D) were calculated with
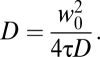 |
For cellular readings each measurement consisted of repeating 10 readings, each 5 s in length. The first reading was always discarded to exclude any contributions from immobile molecules being bleached at the start of the reading (22). Readings showing obvious large deviations in count rate characteristic of cell movement were discarded.
RICS Data Collection and Analysis.
RICS has been described previously (31), and the theoretical basis is given in SI Methods. A Zeiss LSM 710 laser scanning microscope with an incubation chamber and a 40× 1.2 NA water immersion lens was used. Data acquisition parameters were optimized using control measurements in vitro of Rhodamine R110 and EGFP and in vivo of EGFP (Fig. S5 and SI Discussion). The 488-nm laser was used with 1% of transmission power and the signal was detected using a long-pass emission filter (505 nm). The pinhole was set to 1 airy unit, detector gain was set to 800 V, and offset was optimized to 0. Images were taken at 256 × 256 and 12 bits, using an optimized pixel dwell time of 12.61 μs for EGFP-PLK1, collecting 125 frames in total. The excitation volume was measured by taking a z-stack of a subresolution 175-nm diameter fluorescent bead and fitting with a Gaussian in Origin software. Pixel size was 55 nm to ensure sufficient oversampling within the size of the excitation volume. The diffusion and binding analysis is detailed in SI Methods.
FCS Line Scanning.
FCS line scanning was as described previously (31, 35). Line-scanning data were obtained on a Zeiss LSM 710 commercial laser scanning microscope as described for RICS, except for the following differences. Excitation was with 0.2% of the 488-nm laser power to minimize bleaching. A line of length 64 pixels was scanned 100,000 times, with a pixel size of 83 nm and a pixel dwell time of 5.09 μs. These values were determined on the basis of pilot measurements of 175-nm diameter fluorescent beads, known to have a similar D value to that of EGFP-PLK1 on the basis of our FCS and RICS results. Data analysis was in simFCS software (Laboratory for Fluorescence Dynamics, University of California, Irvine, CA). The autocorrelation function was calculated down each column (Eq. S1 in SI Methods) and then fitted using a one-component anomalous diffusion model (Eq. S3 in SI Methods) to obtain a diffusion coefficient value. Before fitting the ACFs, rows were binned into sets of five, and the smooth surface button was used twice in simFCS software. Readings were analyzed to ensure that only particle fluctuations rather than gross organelle movements were measured; occasional gross movements of the centrosome visible as intensity changes across >20 pixels along the scan line were discarded. Intensity drifts in Z due to movement or bleaching were corrected for using a previously described correction (35), which divides the time trace from one column in segments of 20 s each and adds random uncorrelated counts in each segment to match the intensity of the segment with the most counts.
Supplementary Material
Acknowledgments
We thank Dr. Prasad Jallepalli for providing the EGFP-PLK1(wt) and EGFP-PLK1(as) cells, Dr. Enrico Gratton for advice on RICS data analysis and training at the “Laboratory for Fluorescence Dynamics, Irvine workshop on advanced fluorescence dynamics,” Dr. Melina Schuh for instrument access, and Dr. Miyoung Lee for careful reading of the manuscript. R.M. and A.D.J. were, respectively, supported in A.R.V.’s laboratory by a Wellcome Trust PhD studentship and a Medical Research Council career development fellowship. The Medical Research Council supports work in A.R.V.’s laboratory.
Footnotes
The authors declare no conflict of interest.
*This Direct Submission article had a prearranged editor.
This article contains supporting information online at www.pnas.org/lookup/suppl/doi:10.1073/pnas.1101112108/-/DCSupplemental.
References
- 1.Dehmelt L, Bastiaens PI. Spatial organization of intracellular communication: Insights from imaging. Nat Rev Mol Cell Biol. 2010;11:440–452. doi: 10.1038/nrm2903. [DOI] [PubMed] [Google Scholar]
- 2.Karsenti E. Self-organization in cell biology: A brief history. Nat Rev Mol Cell Biol. 2008;9:255–262. doi: 10.1038/nrm2357. [DOI] [PubMed] [Google Scholar]
- 3.Misteli T. The concept of self-organization in cellular architecture. J Cell Biol. 2001;155:181–185. doi: 10.1083/jcb.200108110. [DOI] [PMC free article] [PubMed] [Google Scholar]
- 4.Barr AR, Gergely F. MCAK-independent functions of ch-Tog/XMAP215 in microtubule plus-end dynamics. Mol Cell Biol. 2008;28:7199–7211. doi: 10.1128/MCB.01040-08. [DOI] [PMC free article] [PubMed] [Google Scholar]
- 5.Hames RS, et al. Dynamic recruitment of Nek2 kinase to the centrosome involves microtubules, PCM-1, and localized proteasomal degradation. Mol Biol Cell. 2005;16:1711–1724. doi: 10.1091/mbc.E04-08-0688. [DOI] [PMC free article] [PubMed] [Google Scholar]
- 6.Kishi K, van Vugt MA, Okamoto K, Hayashi Y, Yaffe MB. Functional dynamics of Polo-like kinase 1 at the centrosome. Mol Cell Biol. 2009;29:3134–3150. doi: 10.1128/MCB.01663-08. [DOI] [PMC free article] [PubMed] [Google Scholar]
- 7.Conduit PT, et al. Centrioles regulate centrosome size by controlling the rate of Cnn incorporation into the PCM. Curr Biol. 2010;20:2178–2186. doi: 10.1016/j.cub.2010.11.011. [DOI] [PubMed] [Google Scholar]
- 8.Dzhindzhev NS, et al. Asterless is a scaffold for the onset of centriole assembly. Nature. 2010;467:714–718. doi: 10.1038/nature09445. [DOI] [PubMed] [Google Scholar]
- 9.Khodjakov A, et al. De novo formation of centrosomes in vertebrate cells arrested during S phase. J Cell Biol. 2002;158:1171–1181. doi: 10.1083/jcb.200205102. [DOI] [PMC free article] [PubMed] [Google Scholar]
- 10.Lane HA, Nigg EA. Antibody microinjection reveals an essential role for human polo-like kinase 1 (Plk1) in the functional maturation of mitotic centrosomes. J Cell Biol. 1996;135:1701–1713. doi: 10.1083/jcb.135.6.1701. [DOI] [PMC free article] [PubMed] [Google Scholar]
- 11.Sunkel CE, Glover DM. polo, a mitotic mutant of Drosophila displaying abnormal spindle poles. J Cell Sci. 1988;89:25–38. doi: 10.1242/jcs.89.1.25. [DOI] [PubMed] [Google Scholar]
- 12.Sumara I, et al. Roles of polo-like kinase 1 in the assembly of functional mitotic spindles. Curr Biol. 2004;14:1712–1722. doi: 10.1016/j.cub.2004.09.049. [DOI] [PubMed] [Google Scholar]
- 13.Haren L, Stearns T, Lüders J. Plk1-dependent recruitment of gamma-tubulin complexes to mitotic centrosomes involves multiple PCM components. PLoS ONE. 2009;4:e5976. doi: 10.1371/journal.pone.0005976. [DOI] [PMC free article] [PubMed] [Google Scholar]
- 14.Blagden SP, Glover DM. Polar expeditions—provisioning the centrosome for mitosis. Nat Cell Biol. 2003;5:505–511. doi: 10.1038/ncb0603-505. [DOI] [PubMed] [Google Scholar]
- 15.Burkard ME, et al. Chemical genetics reveals the requirement for Polo-like kinase 1 activity in positioning RhoA and triggering cytokinesis in human cells. Proc Natl Acad Sci USA. 2007;104:4383–4388. doi: 10.1073/pnas.0701140104. [DOI] [PMC free article] [PubMed] [Google Scholar]
- 16.Lippincott-Schwartz J, Snapp E, Kenworthy A. Studying protein dynamics in living cells. Nat Rev Mol Cell Biol. 2001;2:444–456. doi: 10.1038/35073068. [DOI] [PubMed] [Google Scholar]
- 17.Golsteyn RM, Mundt KE, Fry AM, Nigg EA. Cell cycle regulation of the activity and subcellular localization of Plk1, a human protein kinase implicated in mitotic spindle function. J Cell Biol. 1995;129:1617–1628. doi: 10.1083/jcb.129.6.1617. [DOI] [PMC free article] [PubMed] [Google Scholar]
- 18.Macůrek L, et al. Polo-like kinase-1 is activated by aurora A to promote checkpoint recovery. Nature. 2008;455:119–123. doi: 10.1038/nature07185. [DOI] [PubMed] [Google Scholar]
- 19.Jang YJ, Ma S, Terada Y, Erikson RL. Phosphorylation of threonine 210 and the role of serine 137 in the regulation of mammalian polo-like kinase. J Biol Chem. 2002;277:44115–44120. doi: 10.1074/jbc.M202172200. [DOI] [PubMed] [Google Scholar]
- 20.Magde D, Elson EL, Webb WW. Fluorescence correlation spectroscopy. II. An experimental realization. Biopolymers. 1974;13:29–61. doi: 10.1002/bip.1974.360130103. [DOI] [PubMed] [Google Scholar]
- 21.Kim SA, Heinze KG, Schwille P. Fluorescence correlation spectroscopy in living cells. Nat Methods. 2007;4:963–973. doi: 10.1038/nmeth1104. [DOI] [PubMed] [Google Scholar]
- 22.Jeyasekharan AD, et al. DNA damage regulates the mobility of Brca2 within the nucleoplasm of living cells. Proc Natl Acad Sci USA. 2010;107:21937–21942. doi: 10.1073/pnas.1009577107. [DOI] [PMC free article] [PubMed] [Google Scholar]
- 23.Schwille P, Haupts U, Maiti S, Webb WW. Molecular dynamics in living cells observed by fluorescence correlation spectroscopy with one- and two-photon excitation. Biophys J. 1999;77:2251–2265. doi: 10.1016/S0006-3495(99)77065-7. [DOI] [PMC free article] [PubMed] [Google Scholar]
- 24.Pack C, Saito K, Tamura M, Kinjo M. Microenvironment and effect of energy depletion in the nucleus analyzed by mobility of multiple oligomeric EGFPs. Biophys J. 2006;91:3921–3936. doi: 10.1529/biophysj.105.079467. [DOI] [PMC free article] [PubMed] [Google Scholar]
- 25.Digman MA, et al. Fluctuation correlation spectroscopy with a laser-scanning microscope: Exploiting the hidden time structure. Biophys J. 2005;88:L33–L36. doi: 10.1529/biophysj.105.061788. [DOI] [PMC free article] [PubMed] [Google Scholar]
- 26.Rossow MJ, Sasaki JM, Digman MA, Gratton E. Raster image correlation spectroscopy in live cells. Nat Protoc. 2010;5:1761–1774. doi: 10.1038/nprot.2010.122. [DOI] [PMC free article] [PubMed] [Google Scholar]
- 27.Bishop AC, Buzko O, Shokat KM. Magic bullets for protein kinases. Trends Cell Biol. 2001;11:167–172. doi: 10.1016/s0962-8924(01)01928-6. [DOI] [PubMed] [Google Scholar]
- 28.Lee KS, Erikson RL. Plk is a functional homolog of Saccharomyces cerevisiae Cdc5, and elevated Plk activity induces multiple septation structures. Mol Cell Biol. 1997;17:3408–3417. doi: 10.1128/mcb.17.6.3408. [DOI] [PMC free article] [PubMed] [Google Scholar]
- 29.Elia AEH, et al. The molecular basis for phosphodependent substrate targeting and regulation of Plks by the Polo-box domain. Cell. 2003;115:83–95. doi: 10.1016/s0092-8674(03)00725-6. [DOI] [PubMed] [Google Scholar]
- 30.García-Alvarez B, de Cárcer G, Ibañez S, Bragado-Nilsson E, Montoya G. Molecular and structural basis of polo-like kinase 1 substrate recognition: Implications in centrosomal localization. Proc Natl Acad Sci USA. 2007;104:3107–3112. doi: 10.1073/pnas.0609131104. [DOI] [PMC free article] [PubMed] [Google Scholar]
- 31.Digman MA, et al. Measuring fast dynamics in solutions and cells with a laser scanning microscope. Biophys J. 2005;89:1317–1327. doi: 10.1529/biophysj.105.062836. [DOI] [PMC free article] [PubMed] [Google Scholar]
- 32.Digman MA, Gratton E. Analysis of diffusion and binding in cells using the RICS approach. Microsc Res Tech. 2009;72:323–332. doi: 10.1002/jemt.20655. [DOI] [PMC free article] [PubMed] [Google Scholar]
- 33.Misteli T. Protein dynamics: Implications for nuclear architecture and gene expression. Science. 2001;291:843–847. doi: 10.1126/science.291.5505.843. [DOI] [PubMed] [Google Scholar]
- 34.Brown CM, et al. Raster image correlation spectroscopy (RICS) for measuring fast protein dynamics and concentrations with a commercial laser scanning confocal microscope. J Microsc. 2008;229:78–91. doi: 10.1111/j.1365-2818.2007.01871.x. [DOI] [PMC free article] [PubMed] [Google Scholar]
- 35.Digman MA, Brown CM, Horwitz AR, Mantulin WW, Gratton E. Paxillin dynamics measured during adhesion assembly and disassembly by correlation spectroscopy. Biophys J. 2008;94:2819–2831. doi: 10.1529/biophysj.107.104984. [DOI] [PMC free article] [PubMed] [Google Scholar]
- 36.Hinde E, Cardarelli F, Digman MA, Gratton E. In vivo pair correlation analysis of EGFP intranuclear diffusion reveals DNA-dependent molecular flow. Proc Natl Acad Sci USA. 2010;107:16560–16565. doi: 10.1073/pnas.1006731107. [DOI] [PMC free article] [PubMed] [Google Scholar]
- 37.Camazine S, et al. Self Organization in Biological Systems. Princeton: Princeton Univ Press; 2001. [Google Scholar]
- 38.do Carmo Avides M, Tavares A, Glover DM. Polo kinase and Asp are needed to promote the mitotic organizing activity of centrosomes. Nat Cell Biol. 2001;3:421–424. doi: 10.1038/35070110. [DOI] [PubMed] [Google Scholar]
- 39.Oshimori N, Ohsugi M, Yamamoto T. The Plk1 target Kizuna stabilizes mitotic centrosomes to ensure spindle bipolarity. Nat Cell Biol. 2006;8:1095–1101. doi: 10.1038/ncb1474. [DOI] [PubMed] [Google Scholar]
Associated Data
This section collects any data citations, data availability statements, or supplementary materials included in this article.