

Abstract
Since acute ischemic stroke and transient ischemic attack (TIA) are fundamentally disruptions of brain hemodynamics, neuroimaging of brain perfusion might be expected to be of clinical utility. Recently, a noncontrast method of measuring CBF using arterial spin labeling (ASL) has become feasible in the clinical setting. It has advantages when compared to dynamic susceptibility contrast (DSC) bolus contrast perfusion-weighted imaging (PWI) that include lack of exposure to gadolinium-based contrast materials, improved quantitation, and decreased sensitivity to susceptibility artifacts and motion. Drawbacks of ASL include reduced signal-to-noise (SNR) and high sensitivity to arterial transit delays. While deleterious for quantitative perfusion measurements, the sensitivity of ASL to late arriving blood can be beneficial to visualize collateral flow. This chapter will discuss ASL imaging findings in patients presenting with acute ischemic stroke and TIA, focusing on typical appearances, common artifacts, and comparisons with bolus contrast PWI.
Keywords: arterial spin labeling, perfusion, cerebral blood flow, cerebrovascular disease, stroke, transient ischemic attack
Introduction to ASL
Arterial spin labeling is a noncontrast perfusion imaging method that relies on the magnetic labeling of arterial water (1, 2). This labeling can be performed in a variety of ways; the two major classes of ASL are distinguished from each other based on whether the label is applied during a single short-duration pulse (pulsed ASL or PASL) or during an extended period (continuous ASL or CASL). While CASL techniques typically have higher SNR, they have been limited in clinical practice by high RF energy deposition and more demanding requirements from the scanner hardware (3–5). Primarily for this reason, PASL techniques were the first to enter routine clinical practice (6–10). However, more recently, a hybrid approach known as pulsed continuous or pseudocontinuous ASL (pcASL) has become popular, in which many short duration RF pulses can be used to effectively label arterial water over a longer duration (11, 12). This method combines the high labeling efficiency of CASL with the reduced hardware demands of PASL. Regardless of the labeling approach, images are then acquired with and without labeling after allowing time for the labeled blood to pass from the site of labeling into the tissue of interest. The difference in signal intensity between the two sets of images is roughly proportional to the local cerebral blood flow (CBF) (Figure 1).
Figure 1.

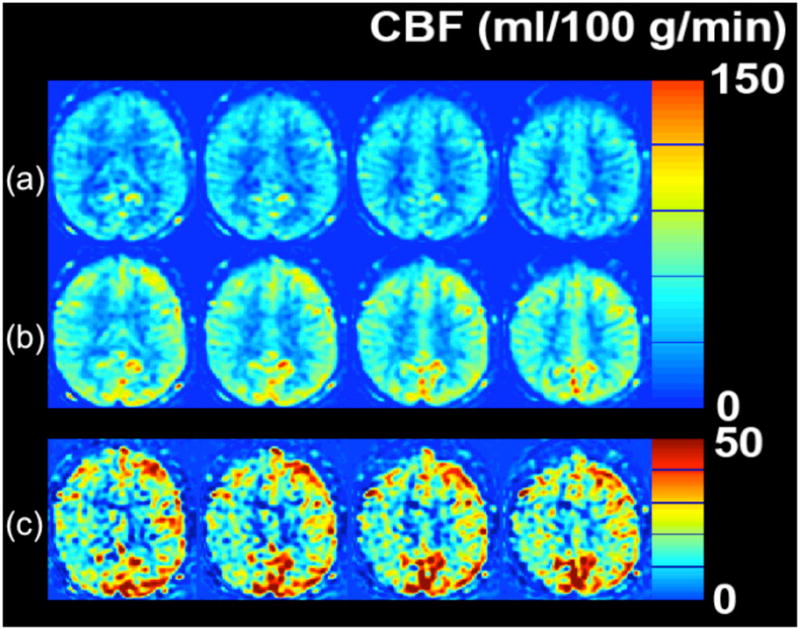
ASL methodology. Images are acquired without (control) and with (label) application of arterial inversion at the site of the labeling plane. In this schematic, the inverted blood in the label image is shown in blue. Proton density images are acquired following the labeling and the post-label delay time. The label image has slightly less signal intensity due to the infusion of inverted magnetization provided by the inflowing labeled blood. When subtracted from the control image, the ASL difference images are roughly proportional to CBF. At the right are CBF images of the central 20 slices of a 32 slice whole-brain 3D-FSE imaging set acquired at 3T requiring 4:30 min to acquire.
ASL images are sensitive to the exact parameters used to acquire the image, several of which are within the user’s control. Choosing the appropriate labeling time for CASL is often a tradeoff between time and SNR; while longer label times lead to a larger buildup of labeled spins in the voxel, the increased time may be better spent on acquiring additional pairs of label and control images for signal averaging (13). Post-label delay (PLD) time, a parameter shared with both PASL and CASL, is critical. It defines the time duration for spins to travel from the labeling plane or volume to the imaged slices, and is typically between 1500 and 2000 ms. Since ischemic stroke is defined by reduced flow via proximal routes, any remaining flow to the tissue is often supplied via collateral routes, which lead to increased delays between the labeling of the spins and the arrival of those spins in the imaged voxel. Alsop et al. (14) demonstrated that longer PLD’s lead to improved CBF quantification, though at the price of a loss in SNR; the longer one delays between the labeling and the imaging, the more SNR penalty is paid due to T1-related decay of the labeled spins. Another approach is to obtain images at multiple PLD’s, effectively mapping the inflow of label into the tissue (15, 16); such approaches offer the potential to quantify arrival times and then fit CBF to kinetic models (17), though the approach is limited by reduced SNR in each of the individual images, challenges with non-linear fitting of the inflow curves, and persistent inaccuracies in regions with severely delayed flow. An example of improved CBF quantitation with longer PLD times is shown as Figure 2 in a patient with bilateral Moyamoya disease.
Figure 2.

CBF quantitation is improved on long post-label delay (PLD) images using pcASL at 3 T in this patient with bilateral Moyamoya disease. On images with relatively short PLD’s, there is less ASL signal in the bilateral MCA territories (arrows). As PLD increases, these regions with arterial arrival delay “fill in,” indicating that CBF in these regions is normal. However, longer PLD images have lower SNR, requiring longer acquisition time. In practice, a compromise must be made between these two competing effects, with most clinical ASL images having PLD’s between 1.5 and 2 s.
Often, on images in which the arterial arrival times are on the same scale or longer than the PLD, labeled spins will be visualized in the arteries feeding the ischemic tissue, a finding that has been termed arterial transit artifact (ATA) (18). This is particularly if no vascular suppression is employed; vascular suppression is a method whereby small diffusion gradients are applied to the ASL images so that spins moving above a certain velocity (presumably vascular) are not imaged (19). ATA, while problematic in terms of quantification, can actually be a useful marker for pathology. ATA in the borderzone regions, often seen bilaterally, is more sensitive than bolus perfusion-weighted imaging (PWI) for identifying subtle perfusion alterations (12). Also, a prior study showed that the presence of ATA in patients with carotid disease was predictive of poor cerebrovascular reactivity following an acetazolamide challenge (18). One prior stroke study suggested that patients with ATA had improved outcomes (20), and suggested that ATA may represent collateral flow (5, 21, 22).
ASL differs from the more widely used bolus-based dynamic susceptibility contrast PWI method in several important ways (Table 1). Because of the lack of the use of contrast agents, ASL can be repeated frequently within the same imaging session, and therefore can be used for challenge-type paradigms (18, 23). It can give some measure of perfusion in patients in whom gadolinium-based contrast agents are contraindicated, due to poor renal function or allergy. As mentioned earlier, ASL is more susceptible to errors in patients with long arterial arrival times, and may overestimate regions of decreased perfusion. Bolus PWI has higher contrast-to-noise per unit time and is an excellent method for measuring cerebral blood volume (CBV), assuming that the blood-brain barrier is intact, but measuring CBF with PWI remains challenging and highly model-dependent (24, 25). Recently, an approach combining ASL and PWI to more accurately measure CBF has been described, which takes advantage of the superior relative perfusion properties of PWI and used ASL to provide a proper scaling factor (26).
Table 1.
Comparison between ASL and Bolus Contrast PWI
| ASL | Bolus PWI |
|---|---|
|
|
While the basic method for measuring CBF with ASL was described over 20 years ago, only recently has ASL entered the clinical arena. The reasons for this are multifactorial. The more widespread use of 3T neuroimaging has led to markedly improved ASL, due to the inherent higher SNR as well as the longer blood T1 at high field. Another important advance was the recognition of the importance of static background tissue signal suppression. In order to image the spatial distribution of the labeled blood, brain images acquired with and without the label (the “control” image) must be subtracted from one another. Typically the difference between the label and control images is about 1% of the signal intensity of either image. This fact means that even small amounts of motion between the label and control scans leads to large errors on subtraction images. By suppressing the static tissue signal using multiple inversion pulses, errors associated with patient motion can be significantly reduced; additionally, any biological or Gaussian noise in the individual label and control images is also reduced using this technique, leading to increased signal-to-noise ratio (SNR) of the final CBF images.
Another advance that has facilitated clinical ASL imaging is the ability to use more optimized readout strategies. Traditionally, single-shot echo-planar imaging (ssEPI) has been used to create the label and control images. This was largely because of the high SNR efficiency of this sequence, since the center of k-space is acquired during each acquisition. Many pairs of label and control ssEPI images are collected, and the subsequent difference images are combined using data averaging to improve SNR. This approach, in theory, also allows the elimination of image pairs with patient motion. However, once SNR improved and the sequences became less sensitive to motion with the advent of robust background suppression as described above, it was possible to use other readout approaches, such as steady-state free precession (SSFP) (27), gradient and spin echo (GRASE) (28), and fast-spin echo (FSE) (11). Compared with ssEPI, these methods are much more robust in regions with high magnetic susceptibility differences, allowing imaging of structures not typically amenable to ssEPI, such as the posterior fossa, midbrain, and inferior temporal and frontal lobes. This also improved performance in patients with aneurysm clips, coils, and blood products. Finally, the use of 3D acquisition methods has entered clinical practice (11, 29); the advantages include the acquisition of isotropic voxels allowing reformatting in different planes, as well as the fact that all slices can be obtained at the same PLD.
Indications for ASL Perfusion Imaging
Given that bolus PWI has gained some level of acceptance in the clinical arena during the past decade, the question arises as to why one would want to perform a perfusion study using an alternative method, particularly one with less SNR. The recent recognition of the relationship between gadolinium-containing contrast agents and nephrogenic systemic fibrosis (NSF) has led to both absolute and relative contraindications to such agents at many institutions. In such patients, ASL is the only option for obtaining information about tissue perfusion. Also, intravenous access is challenging in certain patient groups, particularly children and intravenous drug users. Finally, ASL sequences can be easily repeated during a single clinical examination, which is useful to perform cerebrovascular reserve studies using either acetazolamide or breath-hold paradigms.
Specifically in the patient with cerebrovascular disease, ASL has several potential advantages. While the acquisition time of the study is often a few minutes longer than that of bolus PWI, this is offset by the time savings of not needing to place an IV or hook up a power injector. Additionally, reconstruction times for ASL tend to be shorter than those for bolus PWI, especially since the background-suppressed ASL variants do not typically require motion correction, as do many bolus PWI studies. ASL excels at identifying bilateral disease, which can occur in this patient group, since it can be used in a quantitative rather than qualitative manner. Finally, the ability of ASL to detect perfusion alterations that are more subtle than those seen with bolus PWI make it an ideal methodology to study minor stroke and TIA, where the ability to ascribe the event to a vascular etiology is of paramount importance, since this may affect treatment triage and outcome.
Previous Literature on ASL Findings in TIA and Stroke
Several early studies documented that ASL imaging could be used to image cerebrovascular disease, such as carotid stenosis and occlusion, as well as acute ischemic stroke. Chalela et al. reported on 15 patients imaged within the first 24 hours following acute ischemic stroke (20). Using CASL, they found perfusion changes in the ipsilateral hemisphere consistent with the diffusion and clinical findings. They found that the quantitative CBF levels in the affected hemisphere correlated with National Institute of Health Stroke Scale (NIHSS) and Rankin Scales (RS) at 30-day follow-up. Also, they observed arterial transit artifact (ATA) in approximately half of their patients and suggested that this was a good prognostic sign, perhaps reflecting the presence of collateral flow. Detre et al. examined the role of ASL imaging with acetazolamide challenge in patients with symptomatic intracranial internal carotid artery (ICA) or middle cerebral artery stenosis (18). They showed that the presence of ATA correlated with poor cerebrovascular reactivity following acetazolamide challenge, and suggested that ATA could possibly be used to avoid the risks associated with acetazolamide. ASL has also been applied to large vessel disease, as for example, in a study by Hendrikse et al. in patients with unilateral ICA occlusion (15). They used a PASL method with multiple PLD times, which were then fit to a model to determine CBF in the symptomatic hemispheres of 9 patients and 11 controls. The benefit of their approach was that the results were presumably independent of arrival time, since this is included in the model, though the maximum PLD used (1600 ms) is probably not long enough to ensure that late arriving flow is appropriately counted. They found a 20% CBF decrease in the hemisphere ipsilateral to the carotid occlusion compared with the contralateral hemisphere or normal subjects.
More recently, Deibler et al., in a series of articles, demonstrated a clinically feasible ASL method and further examined various hypoperfusion patterns (8, 9). They described the application of a PASL method called Q2TIPS (7, 30), which is relatively insensitive to errors associated with slow flow in 3000 clinical patients over a 12 month period. They show examples of the expected CBF changes in the core and penumbra of acute ischemic stroke. They also point out that ASL is not well-suited to examine the white matter perfusion in patients with suspected chronic microvascular ischemia, given the low absolute CBF and the prolonged transit times. Chen et al. showed that ASL was useful clinically in 10 pediatric patients with acute ischemic stroke (31). They also noted that ATA was often present surrounding the ischemic core and tended to be associated with lack of progression to infarct and better clinical outcome.
Finally, relatively little has been reported on perfusion in general, and ASL in particular, in TIA patients. A recent study of lacunar syndromes in minor stroke and TIA patients suggested that the presence of a bolus PWI lesion could predict early deterioration (defined as >=3 points on the NIHSS in the first 72 hrs) (32). In the only ASL study specifically focusing on this population, Macintosh et al. describes ASL findings in 4 patients with TIA and 11 with minor stroke (NIHSS<=6) (33). They used a 3D-GRASE-PASL method with multiple PLD’s (500–2500 ms) to characterize the CBF and the arterial arrival time (AAT). This attempt to use ASL to measure arrival times quantitatively in stroke patients is significant, given that bolus arrival time markers, such as the normalized time-to-maximum contrast arrival (Tmax), appear to be useful in bolus PWI stroke studies (34, 35). They proposed an asymmetry index to detect the differences in AAT between hemispheres, and found that AAT was significantly increased in the affected hemisphere. However, such an approach is challenging in these patients, since often they have bilateral carotid disease and are abnormal on both sides to some degree. To evaluate this, Zaharchuk et al. have begun to systematically examine ASL images in TIA patients with the goal of establishing a vascular etiology for the symptomatology (36, 37). They have found that approximately 50% of such patients have abnormalities, which exceeds the published yield of bolus PWI in this population (16%) (38). In particular, in the clinically interesting population of 28 TIA patients without diffusion abnormalities, they found that 46% of patients had ASL abnormalities, compared with 18% on PWI, and that all patients with PWI lesions also had ASL lesions. A common abnormality was a bilateral borderzone sign (12). These findings suggest that ASL alone may be a feasible perfusion method in TIA patients.
Typical Findings on ASL Studies: Stroke
In this section, I will highlight some of the experience at our institution with a 3D-FSE pulsed continuous ASL method at 1.5 T in patients with acute ischemic stroke and TIA. In addition, whenever possible, images from bolus PWI will be included so that the reader may contrast the information gained from each modality.
Figure 3 demonstrates an example of acute ischemic stroke in a 25 year-old woman 6 hrs following repair of aortic coarctation. Hypoperfusion is noted within a large region of the left MCA territory on both ASL and bolus PWI Tmax map. Posterior to this core region, the ASL images show multiple serpiginous high intensity structures compatible with ATA; this region on bolus PWI shows a milder Tmax abnormality than the core. The findings are compatible with collateral flow, and indeed in this patient who did not receive therapy due to her recent surgery, these regions did not convert to infarction based on a 3-day follow-up noncontrast CT scan.
Figure 3.

25 year-old woman 6 hrs following aortic coarctation repair and inability to speak or move her right side. MR angiogram (not shown) demonstrated no flow-related enhancement in the left middle cerebral artery (MCA). Diffusion-weighted images (DWI) confirm acute ischemic stroke in the left MCA territory. ASL CBF images show hypoperfusion in the regions with high DWI signal, with arterial transit artifact (ATA) in the periphery. Bolus contrast normalized time-to-maximum (Tmax) maps show a severe abnormality in the regions corresponding to the DWI lesion, with a milder abnormality in the region of ATA on ASL. The patient received no treatment due to her recent surgery. Coregistered slices from a follow-up noncontrast CT examination 3 days later reveals that there was no increase in the size of the lesion into the region with ATA on ASL. This is consistent with prior reports suggesting that ATA may reflect the beneficial effects of collateral flow and that such tissue has a good prognosis.
Confirmation that this serpiginous high ASL signal is intravascular is shown in Figure 4. This 74 year-old man presented with right facial droop and received both bolus PWI as well as two separate ASL scans, one with and one without vascular suppression employing diffusion gradients (19, 39). The MR angiogram showed distal occlusion of the M1 segment of the right MCA. Here, the diffusion positive region is fairly small, consistent with the mild symptoms. Bolus PWI Tmax maps show a larger area of abnormality suggesting tissue at-risk of infarction. ASL without vessel suppression showed low parenchymal CBF with extensive regions of ATA throughout the affected territory, which was less evident on the vessel-suppressed ASL images. This suggests that the high serpiginous signal is related to slow flow in excellent collateral vessels; in this patient, FLAIR images also showed evidence of slow flow (22). The patient was not treated due to the mild initial symptoms and did not show progression either clinically or on follow-up MR imaging.
Figure 4.
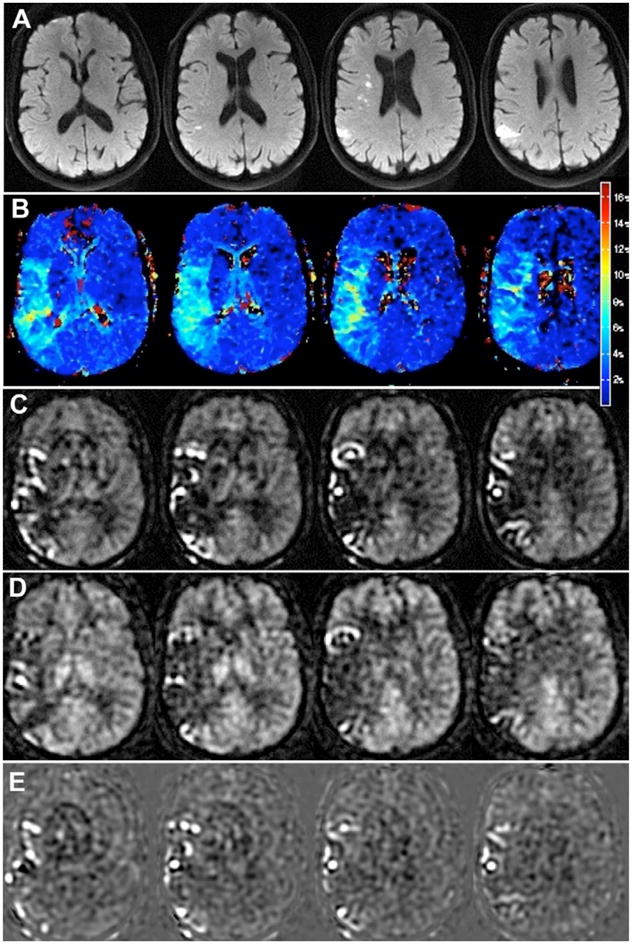
74 year-old man with mild right facial droop. (a) DWI shows small, scattered infarcts in the right MCA territory. (b) Bolus PWI shows a mild Tmax lesion in a larger region. ASL images (c) without and (d) with vessel suppression demonstrate a similar region of abnormality. Serpiginous high ASL signal is seen throughout the affected territory, much of which is removed on the vessel suppressed ASL images, confirming that the high signal is indeed vascular. (e) Difference images between the two ASL images yield an image of the region of collateral flow. The patient was not treated due to his mild symptoms and did not have any worsening of his symptoms and no change in the pattern of infarcts on a 2 day follow-up MRI.
Not all stroke patients show the same pattern of central hypoperfusion with surrounding ATA. Figure 5 demonstrates a case of a right M1 MCA occlusion in an 79 year-old woman with a dense left hemiparesis, who received intra-arterial thrombectomy with removal of the main clot 8 hrs following symptom onset. ASL images obtained 3 days later demonstrate a large right MCA infarct with associated region of hypoperfusion without significant ATA; the lack of ATA may reflect the loss of any collateral circulation at this time.
Figure 5.

79 year-old woman with dense left hemiparesis. (a) Large right MCA diffusion lesion is present. (b) ASL shows hypoperfusion in a region larger than the DWI lesion without significant ATA. Bolus contrast PWI (c) relative CBF and (d) Tmax in the same slices. The ASL lesion appears slightly larger than either of the bolus PWI maps. The lack of ATA suggests that this patient lacks significant collateral flow to the right MCA territory.
The value of repeated quantitative CBF imaging is suggested by the case of a 58 year-old man who underwent elective angioplasty for symptomatic MCA stenosis (Figure 6). His initial ASL images showed ATA in the left MCA territory as would be expected from his severe stenosis. Immediately following the procedure, the patient clinically deteriorated, with aphasia and right hemiparesis. ASL images acquired at this time, showed markedly reduced CBF and ATA in the left MCA territory, which was associated with rapid in-stent restenosis. The patient underwent emergent repeat angioplasty with stenting with resolution of his symptoms. Follow-up imaging 3 days later demonstrated hyperperfusion to the left MCA territory as well as the bilateral posterior cerebral artery (PCA) territories. Subsequent ASL studies over the next several months showed a persistent but less pronounced region of increased CBF in the same distribution.
Figure 6.

Repeat ASL CBF imaging in a 58 year-old man with symptomatic left MCA stenosis. (a) Initial ASL images show ATA in the left MCA territory as expected due to the stenosis of the M1 segment of the left MCA. (b) Immediately following angioplasty, the patient had clinical deterioration, and reduced CBF in the affected territory. This was determined to be related to rapid in-stent restenosis. (c) Imaging following emergent angioplasty and stenting show high CBF in the left MCA and bilateral PCA territories, presumably related to luxury perfusion.
Typical Findings on ASL Studies: TIA
Imaging plays an important role in the work-up of TIA, given that patients are asymptomatic at clinical presentation. While clinical scales, such as the ABCD2 scale (40), have gained acceptance as a way to predict the risk of recurrent stroke, numerous studies have shown that imaging can improve the predictive ability of these scales (41, 42). Since approximately 30% of TIA patients have diffusion changes, it is not unexpected that such patients also may demonstrate perfusion lesions, either with bolus contrast PWI (38) or ASL (Figure 7). However, we have also seen patients without DWI changes who have perfusion abnormalities, which are most evident as ATA on ASL imaging. Figure 8 shows an example in a 79 year-old man presenting with transient left leg weakness. Initial studies were DWI negative, but there was evidence of subtle ATA in the right paramedian frontal lobe, suggesting a vascular etiology for the patient’s symptoms. He was discharged, but returned 2 days later with a new DWI lesion in the right MCA-ACA borderzone region, associated with increased conspicuity of the previously noted ATA. This case highlights the high sensitivity of ASL to minor perfusion alterations, which can be particularly helpful in TIA patients.
Figure 7.
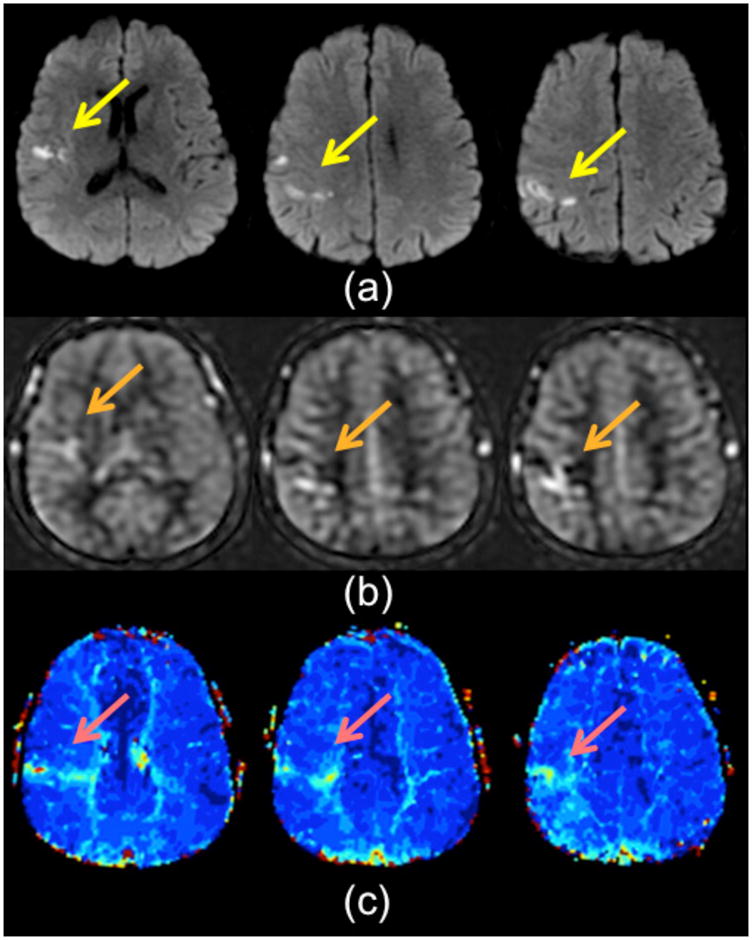
59 year-old man with transient L arm weakness, ABCD 2 score was 5. (a) DWI images show a small infarct in the right frontoparietal region. This is accompanied by a subtle region of ATA on (b) ASL CBF images and (c) mild Tmax prolongation on bolus PWI.
Figure 8.
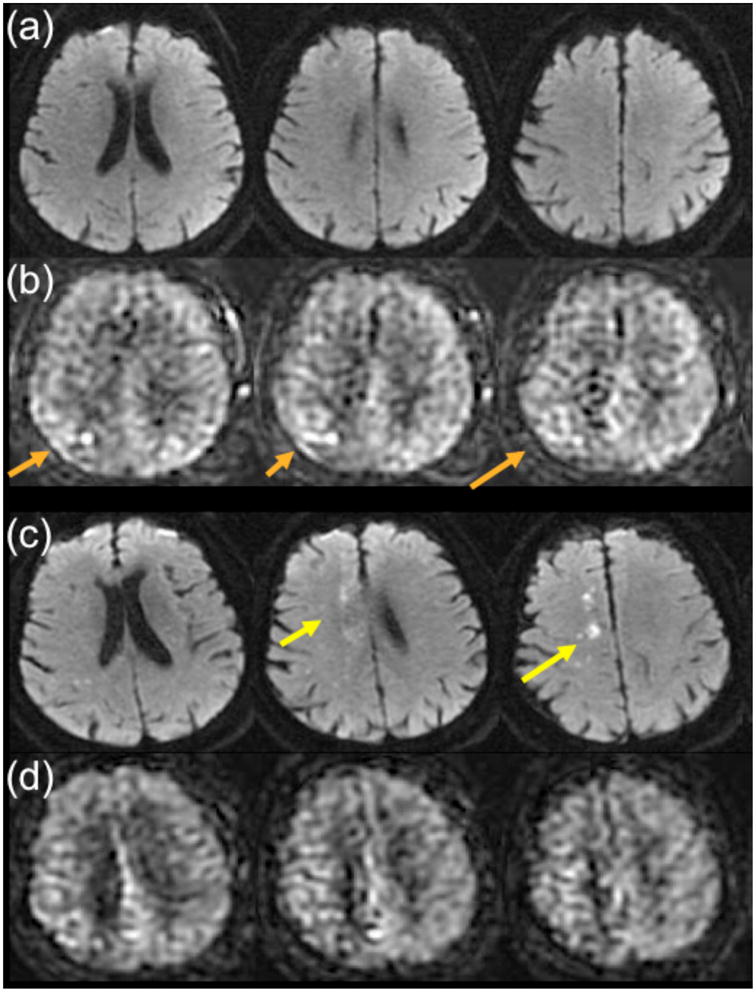
79 year-old man with transient left leg weakness. ABCD2 score was 5. (a) Initial DWI was normal. (b) ASL shows mild ATA in the right paramedian region (orange arrows) suggesting a vascular etiology for the patient’s symptoms. Two days later, the patient returned with new onset of left leg weakness and the DWI study shows new small infarcts in the right paramedian region (yellow arrows) near the prior ATA abnormality from the initial ASL. (d) ASL shows slightly more pronounced ATA in the same territory.
Another finding that can be seen in the setting of TIA is the borderzone sign; this finding, that of ASL signal dropout in the MCA-ACA borderzone regions with associated ATA, is most commonly seen in a bilateral distribution (12). Because of this, it is frequently occult on bolus PWI, since this is usually interpreted in a qualitative fashion in which the two hemispheres are compared with each other. While the etiology of this finding is unclear, given that it is rarely associated with significant large vessel stenosis or occlusion, it may represent overall decreased cardiac output or microvascular disease. Figure 9 shows an example of the bilateral borderzone sign in a 79 year-old man with transient expressive aphasia. In this case, a subtle DWI lesion is present in the left centrum semiovale, suggesting a vascular etiology. While there is some suggestion of bilateral mild Tmax prolongation in the borderzone regions, the ASL images demonstrate a moderate borderzone sign. In our limited experience, the presence of a borderzone sign is a poor prognostic feature.
Figure 9.
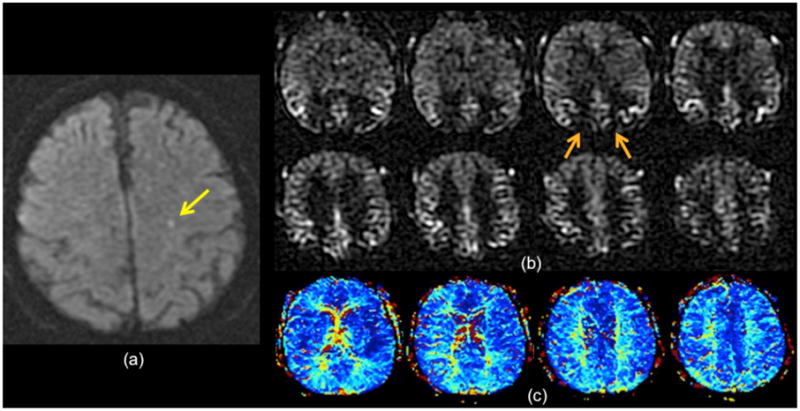
79 year-old man with 10 min of transient expressive aphasia. (a) There is a small subtle DWI lesion in the left centrum semiovale (yellow arrow). (b) ASL imaging shows a moderate bilateral borderzone sign, evidenced by ASL signal dropout in the MCA-ACA and MCA-PCA borderzone regions (e.g., orange arrows). (c) Bolus PWI Tmax maps show mild prolongation bilaterally, but was read as normal. The presence of the borderzone sign suggests a vascular etiology for the patient’s symptoms.
Finally, we have begun to explore whether there is a role for cerebrovascular reserve (CVR) assessment in TIA patients. ASL can be used in this setting, since it can be repeated easily. Also, the relatively mild perfusion abnormalities in TIA lessen the impact of delayed flow in this population. An example of reduced CVR following acetazolamide challenge in the hemisphere thought to be responsible for clinical symptoms is shown as Figure 10. This patient had several hours of transient left lower extremity weakness, and had reduced CVR in the right hemisphere, consistent with her symptoms. We hypothesize that such a finding points to a vascular cause of symptoms and may put her at higher risk for subsequent infarction in this territory.
Figure 10.
Cerebrovascular reserve (CVR) abnormality detected with MRI ASL CBF study in a 51 year-old woman with 3 hours of transient left leg weakness. ABCD2 score was 3. ASL CBF maps obtained (a) before and (b) 20 minutes following 1 g of IV acetazolamide. (c) The pre-post difference image demonstrates that both sides show CBF augmentation, with the left increasing by about 30–50 ml/100 g/min. The right hemisphere also increases, but not as much as the left, with CBF augmentation of about 10–30 ml/100 g/min. The lower CVR localizes to the expected hemisphere of the patient’s symptoms, and may put her at higher risk of future infarct in this territory.
Problems with ASL imaging in Stroke and TIA
While it is likely that ASL will have an important role in the diagnosis or monitoring of stroke and TIA, it is important to recognize its limitations. The most important of these is the sensitivity of ASL to delayed transit times. As mentioned earlier, this is a double-edged sword; the sensitivity allows the recognition of subtle changes based on ATA. However, in severe cases and in the presence of large artery stenosis and occlusion, ASL may overestimate the region of CBF abnormality. This is frequently seen in patients with chronic occlusions, such as Moyamoya disease (Figure 11). Longer PLD sequences mitigate this problem, but it remains a problem for very long transit times. Also, while the borderzone sign is helpful to identify a vascular etiology, in some cases it obscures the presence of a more focal lesion (Figure 12).
Figure 11.

65 year-old man with bilateral Moyamoya disease, as demonstrated on (a) MR angiogram. (b) ASL images show normal signal in the deep gray matter, but no ASL signal in the bilateral MCA cortices. The patient did not have any evidence of low flow in these regions based on xenon CT (not shown), (c) FLAIR, or (d) DWI. This demonstrates that severely delayed flow will be underestimated using ASL with a PLD used for routine clinical work (2 s)
Figure 12.

93 year-old woman with recent cerebrovascular accident and new onset confusion. A small infarct (arrow) is seen on the (a) DWI study. (b) ASL shows bilateral ATA with more prominent signal dropout in the right borderzone region. (c) Bolus PWI Tmax shows asymmetric prolongation in the same region.
Finally, other artifacts that can mimic stroke exist. One of particular concern is that of poor labeling of arterial spins due to magnetic susceptibility inhomogeneities, which can occur if there is a poor shim of the magnet or if the patient has metallic substances in his or her body, such as dental hardware, stents, or surgical clips. In these situations, often the labeling from one artery is affected and can mimic a large artery occlusion. An example of this, in a patient who was scanned for acute ischemic stroke, is shown as Figure 13. In this patient, there was partial reperfusion of the left basal ganglia region, but no ASL signal was seen in the right ICA territory. Given the lack of any clinical symptoms referable to the right MCA territory, it was decided that this represented an artifact related to poor proximal labeling due to susceptibility related to dental hardware in the right neck.
Figure 13.

Poor proximal labeling can mimic large vessel infarct. Patient with small DWI lesion in the left putamen (a). (b) ASL images show a small region in the left hemisphere with low CBF, but a much larger region extending over the entire right ICA territory. Given the lack of symptoms referable to the right MCA territory, it was concluded that this represented a labeling artifact. (c) This is further suggested by the region of signal dropout (arrow) on coronal B0 maps obtained as part of the diffusion study, indicating magnetic susceptibility artifact in this region, possibly due to dental hardware.
Other issues with ASL include the advanced age of most patients with acute stroke and the corresponding reduced CBF levels associated with age. Also, it has been suggested that arterial arrival times are longer in elderly patients (43). Both of these lead to reduced SNR, suggesting the need for increased signal averaging and subsequently longer imaging scans. Since the efficacy of stroke treatment is known to decrease with time, increasing scan time is suboptimal. Longer scan times are more susceptible to artifacts related to patient motion, though motion correction methods can be applied to ASL (44).
Future of ASL in Stroke and TIA
Two newer ASL methods may prove to be useful in the workup of patients with cerebrovascular disease. Velocity-selective ASL (VS-ASL) is a method in which the blood is labeled in or near the voxel of interest rather than at a distant labeling plane, and this may mitigate the errors and artifacts associated with delayed transit (45). Despite theoretical advantages, this technique has not yet been applied in a systematic fashion to patients with long delay times. However, some initial evidence at our institution suggests that VS-ASL images in Moyamoya disease patients with high-grade stenoses and occlusions are less affected by ATA or ASL signal loss in regions known to have normal CBF on stable xenon CT studies (Figure 14). The current drawbacks to routine clinical use of VS-ASL is that currently feasible velocity selective RF pulses saturate rather than invert affected spins, resulting in 2-fold reduction in SNR. Also, it has yet to be integrated into a sequence with background-suppressed 3D imaging readout, limiting its clinical utility.
Figure 14.

Velocity-selective ASL (VS-ASL) mitigates CBF errors due to arterial arrival delays. Co-registered images from pulsed continuous ASL (pcASL) and VS-ASL are shown in a patient with Moyamoya disease and bilateral MCA occlusion. The pcASL images were obtained using a PLD of 2 s, which is too short to image the CBF in the high right frontal lobe. There is preserved ASL signal on the VS-ASL images in this region (arrows), suggesting that the errors associated with conventional ASL are reduced with this technique. Note the lower SNR in the VS-ASL images, which is largely due to the fact that the label images can only saturate rather than invert flowing blood.
Perfusion territory imaging strives to provide separate CBF images that demonstrate how much flow is provided from individual cerebral arteries (46–48). In theory, such information may be helpful to distinguish antegrade from collateral flow (21) and to assess the perfusion territories supplied by bypass grafts (49). As such, it yields a more complete view of the cerebrovasculature, and for this reason is likely to provide clinical value. It is not yet in widespread clinical use, as most implementations require additional time either for the imaging itself or for the planning of which arteries are to be interrogated.
Finally, it should be noted that ASL has not yet been incorporated into a major imaging-based stroke or TIA trial. More clinical experience is necessary to better understand the role of ASL and whether it adds value in this population.
Conclusions
ASL is a promising technique to evaluate patients with cerebrovascular disease. Recent improvements in pulse sequence design, the more widespread use of 3 T neuroimaging, and the recognition of NSF have driven renewed clinical interest in this technique. While prolonged transit times can lead to quantitative errors in ASL CBF maps, the increased sensitivity to minor perfusion alterations may be of clinical value in patients with TIA and minor stroke. Initial experience with ASL in this patient population is encouraging and suggests that the time may be ripe to consider including ASL in imaging-based stroke and TIA protocols to better understand its practical utility.
Acknowledgments
G.Z. would like to acknowledge the funding sources that supported this publication, including a Scholar Award from the American Society of Neuroradiology’s Neuroradiology Education Research Fund (NERF), NIH R01-NS066506-01, and the Richard S. Lucas Center for Imaging at Stanford University.
Footnotes
Publisher's Disclaimer: This is a PDF file of an unedited manuscript that has been accepted for publication. As a service to our customers we are providing this early version of the manuscript. The manuscript will undergo copyediting, typesetting, and review of the resulting proof before it is published in its final citable form. Please note that during the production process errors may be discovered which could affect the content, and all legal disclaimers that apply to the journal pertain.
References
- 1.Dixon WT, Du LN, Faul DD, Gado M, Rossnick S. Projection angiograms of blood labelled by adiabatic fast passage. Magn Reson Med. 1986;3:454–462. doi: 10.1002/mrm.1910030311. [DOI] [PubMed] [Google Scholar]
- 2.Detre JA, Leigh JS, Williams DS, Koretsky AP. Perfusion imaging. Magn Reson Med. 1992;23:37–45. doi: 10.1002/mrm.1910230106. [DOI] [PubMed] [Google Scholar]
- 3.Roberts DA, Detre JA, Bolinger L, Insko EK, Leigh JS. Quantitative magnetic resonance imaging of human brain perfusion at 1.5 T using steady-state inversion of arterial water. Proc Natl Acad Sci. 1994;91:33 – 37. doi: 10.1073/pnas.91.1.33. [DOI] [PMC free article] [PubMed] [Google Scholar]
- 4.Alsop DC, Detre JA. Multisection cerebral blood flow MR imaging with continuous arterial spin labeling. Radiology. 1998;208:410–416. doi: 10.1148/radiology.208.2.9680569. [DOI] [PubMed] [Google Scholar]
- 5.Detre JA, Alsop DC. Perfusion magnetic resonance imaging with continuous arterial spin labeling: methods and clinical applications in the central nervous system. Eur J Radiol. 1999;30:115–124. doi: 10.1016/s0720-048x(99)00050-9. [DOI] [PubMed] [Google Scholar]
- 6.Edelman RR, Siewert B, Darby DG, et al. Qualitative mapping of cerebral blood flow and functional localization with echo-planar MR imaging and signal targeting with alternating radio frequency. Radiology. 1994;192:513–520. doi: 10.1148/radiology.192.2.8029425. [DOI] [PubMed] [Google Scholar]
- 7.Wong EC, Buxton RB, Frank LR. Quantitative imaging of perfusion using a single subtraction (QUIPSS and QUIPSS II) Magn Reson Med. 1998;39:702–708. doi: 10.1002/mrm.1910390506. [DOI] [PubMed] [Google Scholar]
- 8.Deibler AR, Pollock JM, Kraft RA, Tan H, Burdette JH, Maldjian JA. Arterial spin-labeling in routine clinical practice, part 1: technique and artifacts. AJNR Am J Neuroradiol. 2008;29:1228–1234. doi: 10.3174/ajnr.A1030. [DOI] [PMC free article] [PubMed] [Google Scholar]
- 9.Deibler AR, Pollock JM, Kraft RA, Tan H, Burdette JH, Maldjian JA. Arterial spin-labeling in routine clinical practice, part 2: hypoperfusion patterns. AJNR Am J Neuroradiol. 2008;29:1235–1241. doi: 10.3174/ajnr.A1033. [DOI] [PMC free article] [PubMed] [Google Scholar]
- 10.Deibler AR, Pollock JM, Kraft RA, Tan H, Burdette JH, Maldjian JA. Arterial Spin-Labeling in Routine Clinical Practice, Part 3: Hyperperfusion Patterns. AJNR Am J Neuroradiol. 2008 doi: 10.3174/ajnr.A1034. [DOI] [PMC free article] [PubMed] [Google Scholar]
- 11.Dai W, Garcia D, de Bazelaire C, Alsop DC. Continuous flow driven inversion for arterial spin labeling using pulsed radiofrequency and gradient fields. Magn Reson Med. 2008;60:1488–1497. doi: 10.1002/mrm.21790. [DOI] [PMC free article] [PubMed] [Google Scholar]
- 12.Zaharchuk G, Bammer R, Straka M, et al. Arterial spin-label imaging in patients with normal bolus perfusion-weighted MR imaging findings: pilot identification of the borderzone sign. Radiology. 2009;252:797–807. doi: 10.1148/radiol.2523082018. [DOI] [PMC free article] [PubMed] [Google Scholar]
- 13.Wong EC, Buxton RB, Frank LR. A theoretical and experimental comparison of continuous and pulsed arterial spin labeling techniques for quantitative perfusion imaging. Magn Reson Med. 1998;40:348–355. doi: 10.1002/mrm.1910400303. [DOI] [PubMed] [Google Scholar]
- 14.Alsop DC, Detre JA. Reduced transit time sensitivity in noninvasive magnetic resonance imaging of human cerebral blood flow. J Cereb Blood Flow Metab. 1996;16:1236–1249. doi: 10.1097/00004647-199611000-00019. [DOI] [PubMed] [Google Scholar]
- 15.Hendrikse J, van Osch MJ, Rutgers DR, et al. Internal carotid artery occlusion assessed at pulsed arterial spin-labeling perfusion MR imaging at multiple delay times. Radiology. 2004;233:899–904. doi: 10.1148/radiol.2333031276. [DOI] [PubMed] [Google Scholar]
- 16.Petersen ET, Lim T, Golay X. Model–free arterial spin labeling quantification approach for perfusion MRI. Magn Reson Med. 2006;55:219–232. doi: 10.1002/mrm.20784. [DOI] [PubMed] [Google Scholar]
- 17.Buxton RB, Frank LR, Wong EC, Siewert B, Warach S, Edelman RR. A general kinetic model for quantitative perfusion imaging with arterial spin labeling. Magn Reson Med. 1998;40:383–396. doi: 10.1002/mrm.1910400308. [DOI] [PubMed] [Google Scholar]
- 18.Detre JA, Samuels OB, Alsop DC, Gonzalez-At JB, Kasner SE, Raps EC. Noninvasive magnetic resonance imaging evaluation of cerebral blood flow with acetazolamide challenge in patients with cerebrovascular stenosis. J Magn Reson Imaging. 1999;10:870–875. doi: 10.1002/(sici)1522-2586(199911)10:5<870::aid-jmri36>3.0.co;2-d. [DOI] [PubMed] [Google Scholar]
- 19.Wang J, Alsop DC, Song HK, et al. Arterial transit time imaging with flow encoding arterial spin tagging (FEAST) Magn Reson Med. 2003;50:599–607. doi: 10.1002/mrm.10559. [DOI] [PubMed] [Google Scholar]
- 20.Chalela JA, Alsop DC, Gonzalez-Atavales JB, Maldjian JA, Kasner SE, Detre JA. Magnetic resonance perfusion imaging in acute ischemic stroke using continuous arterial spin labeling. Stroke. 2000;31:680–687. doi: 10.1161/01.str.31.3.680. [DOI] [PubMed] [Google Scholar]
- 21.Chng SM, Petersen ET, Zimine I, Sitoh YY, Lim CC, Golay X. Territorial arterial spin labeling in the assessment of collateral circulation: comparison with digital subtraction angiography. Stroke. 2008;39:3248–3254. doi: 10.1161/STROKEAHA.108.520593. [DOI] [PubMed] [Google Scholar]
- 22.Liebeskind DS. Collateral circulation. Stroke. 2003;34:2279–2284. doi: 10.1161/01.STR.0000086465.41263.06. [DOI] [PubMed] [Google Scholar]
- 23.Yen Y-F, Field AS, Martin EM, et al. Test-retest reproducibility of quantitative CBF measurements using FAIR perfusion MRI and acetazolamide challenge. Magn Reson Med. 2002;47:921–928. doi: 10.1002/mrm.10140. [DOI] [PubMed] [Google Scholar]
- 24.Calamante F, Gadian DG, Connelly A. Quantification of perfusion using bolus tracking magnetic resonance imaging in stroke: assumptions, limitations, and potential implications for clinical use. Stroke. 2002;33:1146–1151. doi: 10.1161/01.str.0000014208.05597.33. [DOI] [PubMed] [Google Scholar]
- 25.Calamante F, Vonken EJ, van Osch MJ. Contrast agent concentration measurements affecting quantification of bolus-tracking perfusion MRI. Magn Reson Med. 2007;58:544–553. doi: 10.1002/mrm.21362. [DOI] [PubMed] [Google Scholar]
- 26.Zaharchuk G, Straka M, Marks MP, Albers GW, Moseley ME, Bammer R. Combined arterial spin label and dynamic susceptibility contrast measurement of cerebral blood flow. Magn Reson Med. 2010;63:1548–1556. doi: 10.1002/mrm.22329. [DOI] [PMC free article] [PubMed] [Google Scholar]
- 27.Koktzoglou I, Edelman RR. Fast projective carotid MR angiography using arterial spin-labeled balanced SSFP. J Magn Reson Imaging. 2008;28:778–782. doi: 10.1002/jmri.21476. [DOI] [PubMed] [Google Scholar]
- 28.Guenther M, Oshio K, Feinberg D. Very fast 3D perfusion measurement with high signal-to-noise ratio using single–shot 3D-GRASE: application to improve perfusion quantitation. ISMRM; Kyoto, Japan: 2004. p. 714. [Google Scholar]
- 29.Guenther M, Oshio K, Feinberg DA. Single-shot 3D imaging techniques improve arterial spin labeling perfusion measurements. Magn Reson Med. 2005;54:491–498. doi: 10.1002/mrm.20580. [DOI] [PubMed] [Google Scholar]
- 30.Luh WM, Wong EC, Bandettini PA, Hyde JS. QUIPSS II with thin-slice TI1 periodic saturation: a method for improving accuracy of quantitative perfusion imaging using pulsed arterial spin labeling. Magn Reson Med. 1999;41:1246–1254. doi: 10.1002/(sici)1522-2594(199906)41:6<1246::aid-mrm22>3.0.co;2-n. [DOI] [PubMed] [Google Scholar]
- 31.Chen J, Licht DJ, Smith SE, et al. Arterial spin labeling perfusion MRI in pediatric arterial ischemic stroke: initial experiences. J Magn Reson Imaging. 2009;29:282–290. doi: 10.1002/jmri.21641. [DOI] [PMC free article] [PubMed] [Google Scholar]
- 32.Poppe AY, Coutts SB, Demchuk AM. Transient ischemic attack etiologic subtype and early risk of stroke. Stroke. 2008;39:e108. doi: 10.1161/STROKEAHA.108.514034. author reply e109–110. [DOI] [PubMed] [Google Scholar]
- 33.Macintosh BJ, Lindsay AC, Kylintireas I, et al. Multiple Inflow Pulsed Arterial Spin-Labeling Reveals Delays in the Arterial Arrival Time in Minor Stroke and Transient Ischemic Attack. AJNR Am J Neuroradiol. 2010 doi: 10.3174/ajnr.A2008. [DOI] [PMC free article] [PubMed] [Google Scholar]
- 34.Albers GW, Thijs VN, Wechsler L, et al. Magnetic resonance imaging profiles predict clinical response to early reperfusion: the diffusion and perfusion imaging evaluation for understanding stroke evolution (DEFUSE) study. Ann Neurol. 2006;60:508–517. doi: 10.1002/ana.20976. [DOI] [PubMed] [Google Scholar]
- 35.Davis SM, Donnan GA, Parsons MW, et al. Effects of alteplase beyond 3 h after stroke in the Echoplanar Imaging Thrombolytic Evaluation Trial (EPITHET): a placebo-controlled randomised trial. Lancet Neurol. 2008;7:299–309. doi: 10.1016/S1474-4422(08)70044-9. [DOI] [PubMed] [Google Scholar]
- 36.Zaharchuk G, Olivot JM, Bammer R, et al. Internat Soc Magn Reson Med (ISMRM) Stockholm, Sweden: 2010. Arterial Spin Label Imaging of Transient Ischemic Attack; p. 4418. [Google Scholar]
- 37.Zaharchuk G, Olivot JM, Mlynash M, et al. Am Soc Neuroradiology. Boston, MA: 2010. Yield of Perfusion MR Imaging in Diffusion Negative Transient Ischemic Attack Patients; p. 27. [Google Scholar]
- 38.Mlynash M, Olivot JM, Tong DC, et al. Yield of combined perfusion and diffusion MR imaging in hemispheric TIA. Neurology. 2009;72:1127–1133. doi: 10.1212/01.wnl.0000340983.00152.69. [DOI] [PMC free article] [PubMed] [Google Scholar]
- 39.Zaharchuk G, Shankaranarayanan A, Alsop DC. Removing large vessel contamination from arterial spin label MR perfusion images using T2 preparation. RSNA; Chicago, IL: 2008. pp. VN31–10. [Google Scholar]
- 40.Johnston SC, Rothwell PM, Nguyen-Huynh MN, et al. Validation and refinement of scores to predict very early stroke risk after transient ischaemic attack. Lancet. 2007;369:283–292. doi: 10.1016/S0140-6736(07)60150-0. [DOI] [PubMed] [Google Scholar]
- 41.Ay H, Arsava EM, Johnston SC, et al. Clinical- and imaging-based prediction of stroke risk after transient ischemic attack: the CIP model. Stroke. 2009;40:181–186. doi: 10.1161/STROKEAHA.108.521476. [DOI] [PubMed] [Google Scholar]
- 42.Coutts SB, Eliasziw M, Hill MD, et al. An improved scoring system for identifying patients at high early risk of stroke and functional impairment after an acute transient ischemic attack or minor stroke. Int J Stroke. 2008;3:3–10. doi: 10.1111/j.1747-4949.2008.00182.x. [DOI] [PubMed] [Google Scholar]
- 43.Campbell AM, Beaulieu C. Pulsed arterial spin labeling parameter optimization for an elderly population. J Magn Reson Imaging. 2006;23:398–403. doi: 10.1002/jmri.20503. [DOI] [PubMed] [Google Scholar]
- 44.Zhang J, Zaharchuk G, Moseley M, et al. Internat Soc Magn Reson Med (ISMRM) Stockholm, Sweden: 2010. Pulsed continuous arterial spin labeling (pcASL) with prospective motion correction (PROMO) p. 5034. [Google Scholar]
- 45.Wong EC, Cronin M, Wu W-C, Inglis B, Frank LR, Liu TT. Velocity-selective arterial spin labeling. Magn Reson Med. 2006;55:1334–1341. doi: 10.1002/mrm.20906. [DOI] [PubMed] [Google Scholar]
- 46.Hendrikse J, Hartkamp MJ, Hillen B, Mali WP, van der Grond J. Collateral ability of the circle of Willis in patients with unilateral internal carotid artery occlusion: border zone infarcts and clinical symptoms. Stroke. 2001;32:2768–2773. doi: 10.1161/hs1201.099892. [DOI] [PubMed] [Google Scholar]
- 47.Wong EC. Vessel-encoded arterial spin-labeling using pseudocontinuous tagging. Magn Reson Med. 2007;58:1086–1091. doi: 10.1002/mrm.21293. [DOI] [PubMed] [Google Scholar]
- 48.Zaharchuk G, Ledden P, Kwong K, Reese T, Rosen B, Wald L. Multislice perfusion and perfusion territory imaging in humans with separate label and image coils. Magn Reson Med. 1999;41:1093–1098. doi: 10.1002/(sici)1522-2594(199906)41:6<1093::aid-mrm4>3.0.co;2-0. [DOI] [PubMed] [Google Scholar]
- 49.van Laar PJ, van der Grond J, Hendrikse J. Brain perfusion territory imaging: methods and clinical applications of selective arterial spin-labeling MR imaging. Radiology. 2008;246:354–364. doi: 10.1148/radiol.2462061775. [DOI] [PubMed] [Google Scholar]