

Abstract
The short arm of human chromosome 5 contains ∼48 Mb of DNA and comprises 1.5% of the genome. We have constructed a mega-YAC/ STS map of this region that includes 436 YACs anchored by 216 STSs. By combining and integrating our map with the 5p maps of other groups using the same recombinant DNA library, a comprehensive map was constructed that includes 552 YACs and 504 markers. The YAC map covers >94% of 5p in four YAC contigs, bridges the centromere, and includes an additional 5 Mb of 5q DNA. The average marker density is 95 kb. This integrated 5p map will serve as a resource for the continuing localization of genes on the short arm of human chromosome 5 and as a framework for both generating and aligning the DNA sequence of this region.
One of the primary initial goals of the Human Genome Project was to establish a physical map representing every chromosome of the human genome (Botstein et al. 1990). Advancements toward this end include detailed maps of chromosomes Y (Foote et al. 1992), 3 (Gemmill et al. 1995), 11 (Qin et al. 1996), 12 (Krauter et al. 1995), 16 (Doggett et al. 1995) 19 (Ashworth et al. 1995), 21 (Chumakov et al. 1992; Nizetic et al. 1994), 22 (Bell et al. 1995; Collins et al. 1995), 7 (Bouffard et al. 1997), and X (Crollius et al. 1996; Nagaraja et al. 1997) as well as maps consisting of large segments of the entire genome (Cohen et al.,1993; Chumakov et al. 1995; Hudson et al. 1995, Gyapay et al. 1996; Schuler et al. 1996; Deloukas et al. 1998). These contributions will be critical for correctly aligning future DNA sequences (Venter et al. 1998) and the ultimate understanding of human biology and disease (Collins et al. 1998).
One of the best studied and more common (1:50,000 births; Niebuhr 1978) human deletion syndromes is cri-du-chat (Lejuene et al. 1963; Niebuhr 1978). This syndrome results from a deletion of all or part of the short arm of chromosome 5. Previous efforts have yielded YAC contigs (Goodart et al. 1994; Gersh et al. 1997) covering the gene regions considered to account for some of the primary features of this syndrome (Overhauser et al. 1994; Church et al. 1995; Gersh et al. 1995). Cri-du-chat breakpoints are known to occur throughout most of the 5p region (Overhauser et al. 1994). A detailed physical map of the entire chromosome arm would provide a valuable resource for future studies. In this paper, we describe an integrated chromosome YAC/STS physical map of 5p, which provides nearly complete coverage of this 48-Mb arm.
RESULTS AND DISCUSSION
Overview of the Project
The integrated 5p YAC/STS map was constructed by a multitiered approach as follows: (1) Nucleation was obtained with 84 regionally ordered 5p STS markers generated from flow-sorted chromosomes for this study (Grady et al. 1996; approximately one STS/0.6 Mb). The Genethon physical map of the human genome (Cohen et al. 1993; Chumakov et al. 1995) was examined to identify tier one to three mega-YACs likely to be derived from 5p. All 84 STSs were used to screen this subset of mega-YAC clones producing YAC contigs spanning 40.8 Mb or ∼85% of the short arm of chromosome 5. (2) Direct screening of the entire mega-YAC library (Methods) was then conducted in regions with a limited number of YACs from the initial nucleation, including STSs from the ends of contigs. (3) Next, an additional 132 STSs generated by other genome-wide mapping efforts [Whitehead, Genethon, Stanford, and Cooperative Human Linkage Center (CHLC)] were tested independently by our laboratory against our YAC contigs. Again, STSs from regions of low coverage were used to identify additional YACs by screening the entire mega-YAC library. At this point, 216 STSs and 436 YACs had been unambiguously localized to 5p, covering ∼44 Mb or 92% of the region. (4) Finally, an additional 288 STSs and 116 YACs mapped by other laboratories and not tested independently by our laboratory were incorporated into the overall map with SIGMA (System for Integrated Genome Map Assembly; Doggett et al. 1995). This integration did not significantly improve the YAC coverage, but helped add to and refine marker order. The final 5p map, then, represents an independently constructed YAC/STS map that experimentally extends, integrates, and confirms maps generated by the genome-wide mapping efforts (Chumakov et. al. 1995; Hudson et al. 1995). We believe it is one of the first maps to attempt such an integration.
The Map
The map consists of four separate contigs totaling 45 Mb, crosses the centromere, and extends into the long arm for ∼5 Mb (Figs. 1, 2). The SIGMA depiction of the data was assembled in a manner similar to that described by Doggett et al. (1995). Briefly, all clones, STSs, somatic cell hybrids, etc., are entered into SIGMA as elements in the map and the relationships between these elements (contains, overlaps, left of, and so on), are entered as objectives. Elements are then moved manually in the map to minimize unfulfilled objectives. The SIGMA representation integrates the ideogram for 5p and the genetic map with the STS markers and YACs used to construct the physical map.
Figure 1.
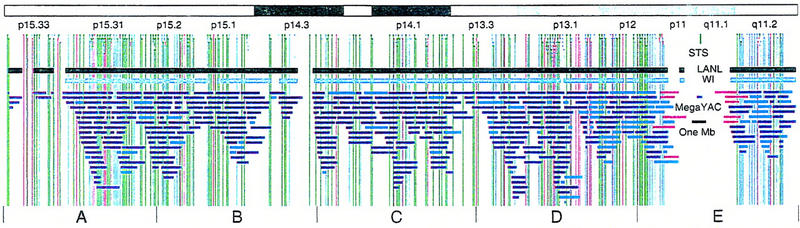
Overview of the physical map of the short arm of human chromosome 5. The overall YAC coverage reported in this study (black bar) and that of the Whitehead Institute (turquoise bar) is summarized with respect to the chromosome 5p ideogram. The narrow black and gray bars represent individual YACs that have been mapped and are shown in detail in Fig. 2. Labels A–E indicate the page of Fig. 2 on which the detailed information for that fraction of the map can be found.
Figure 2.
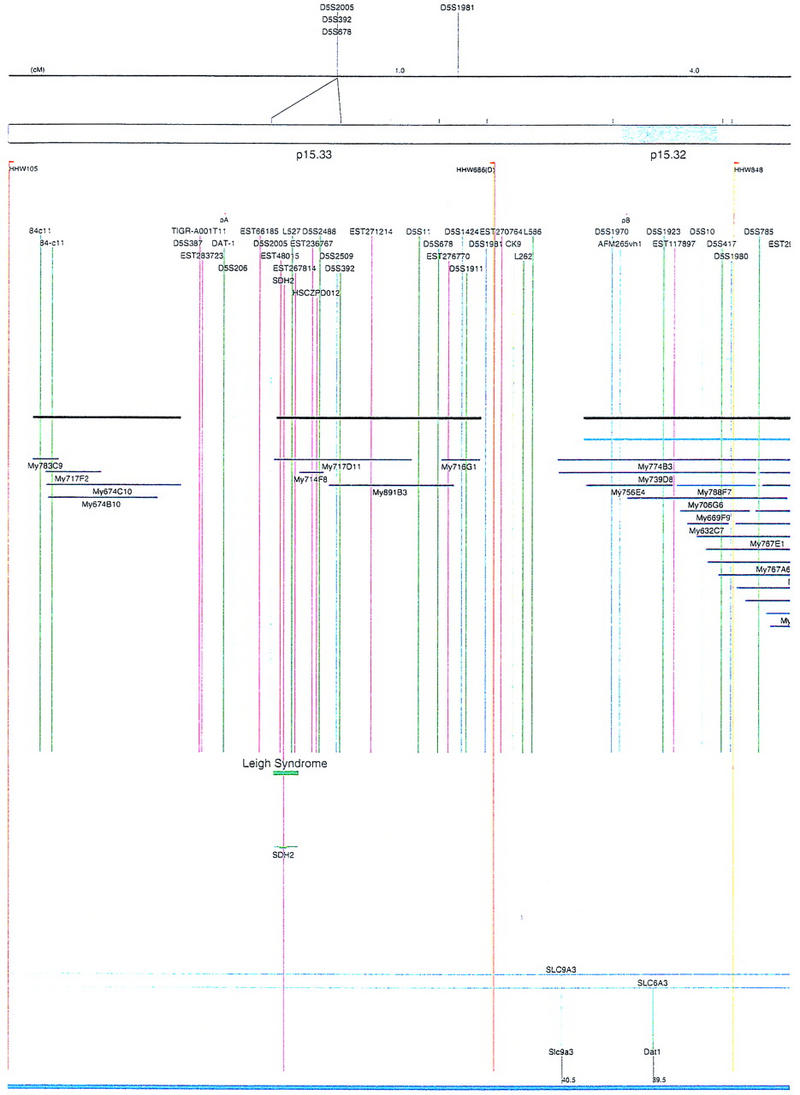
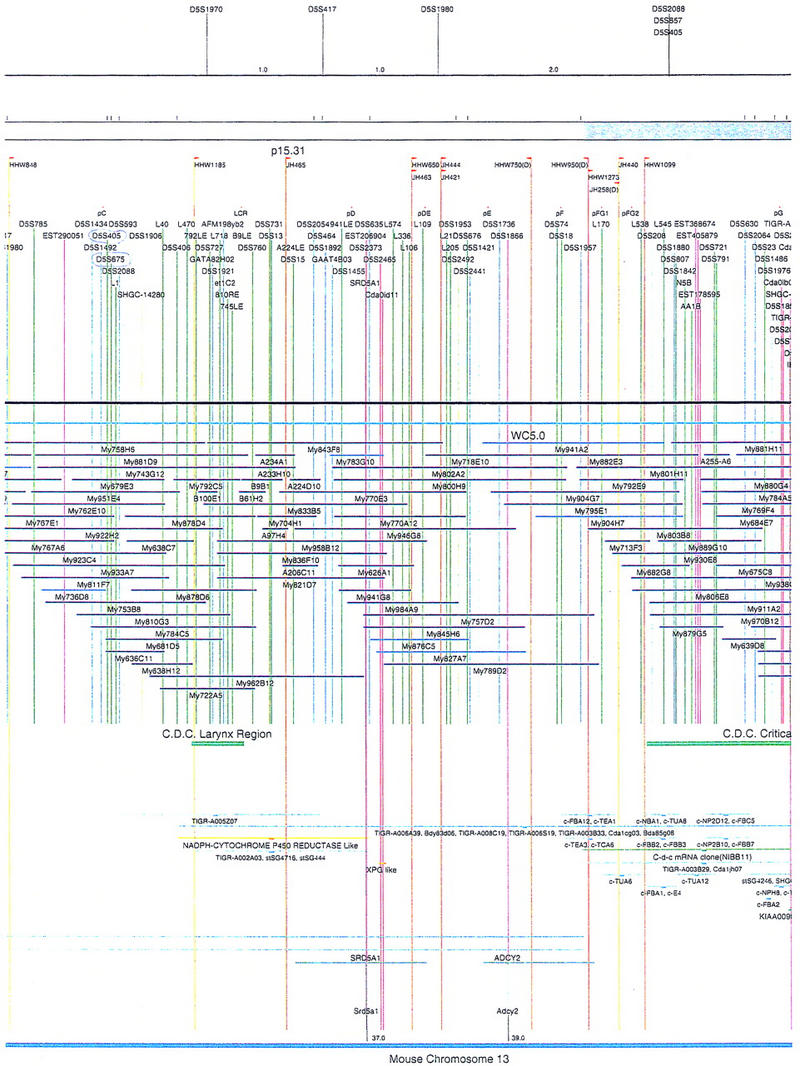
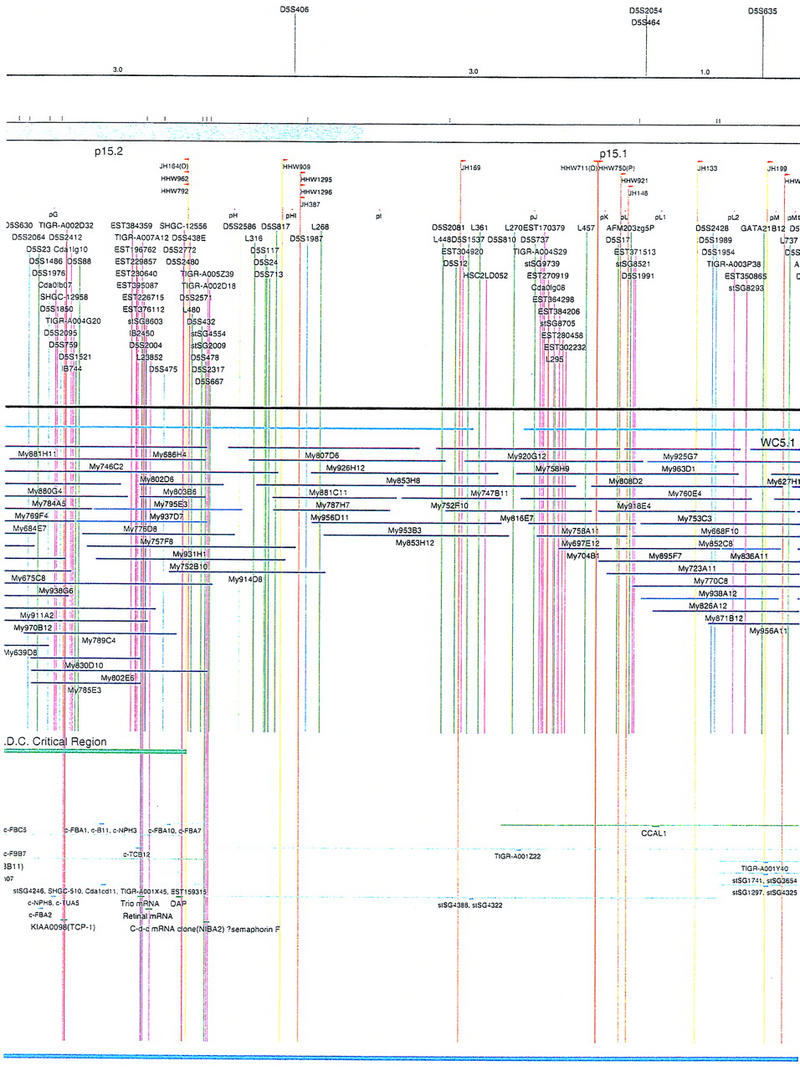
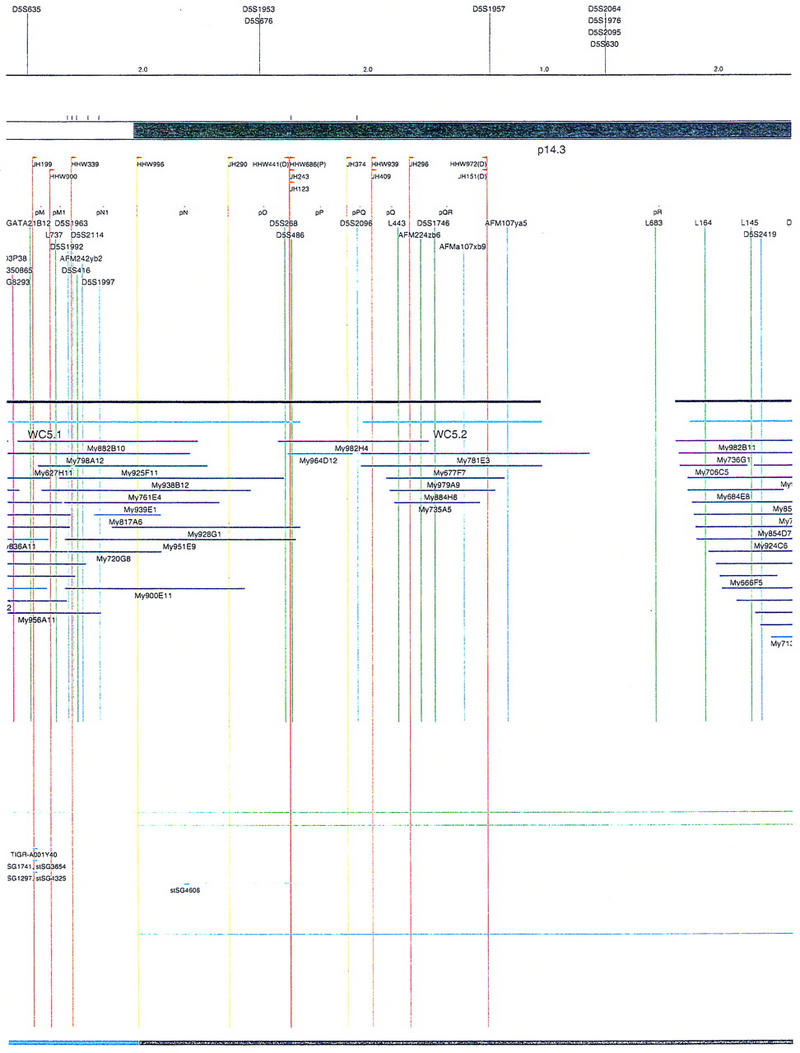
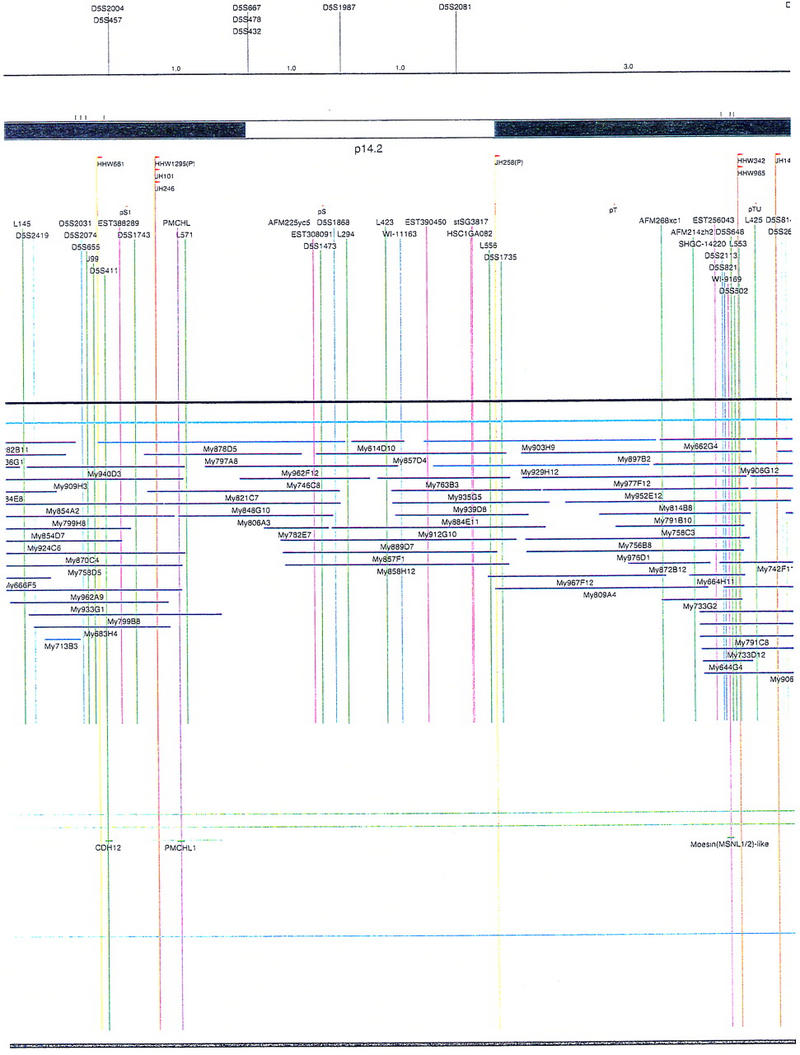
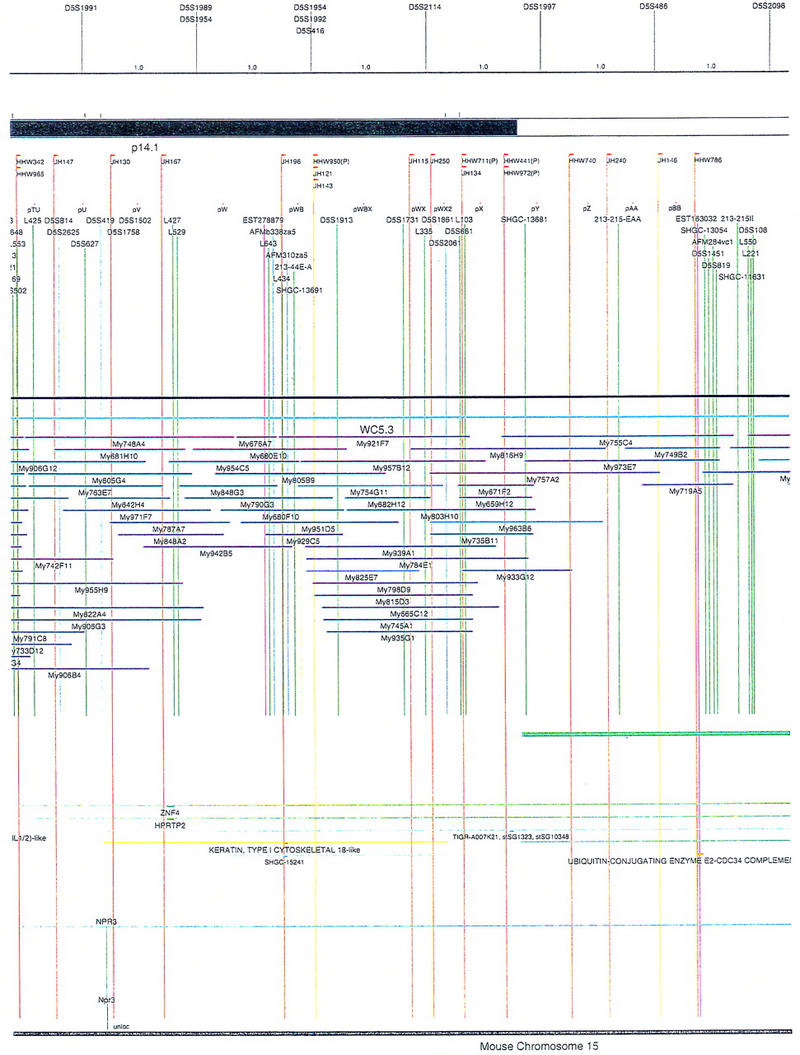
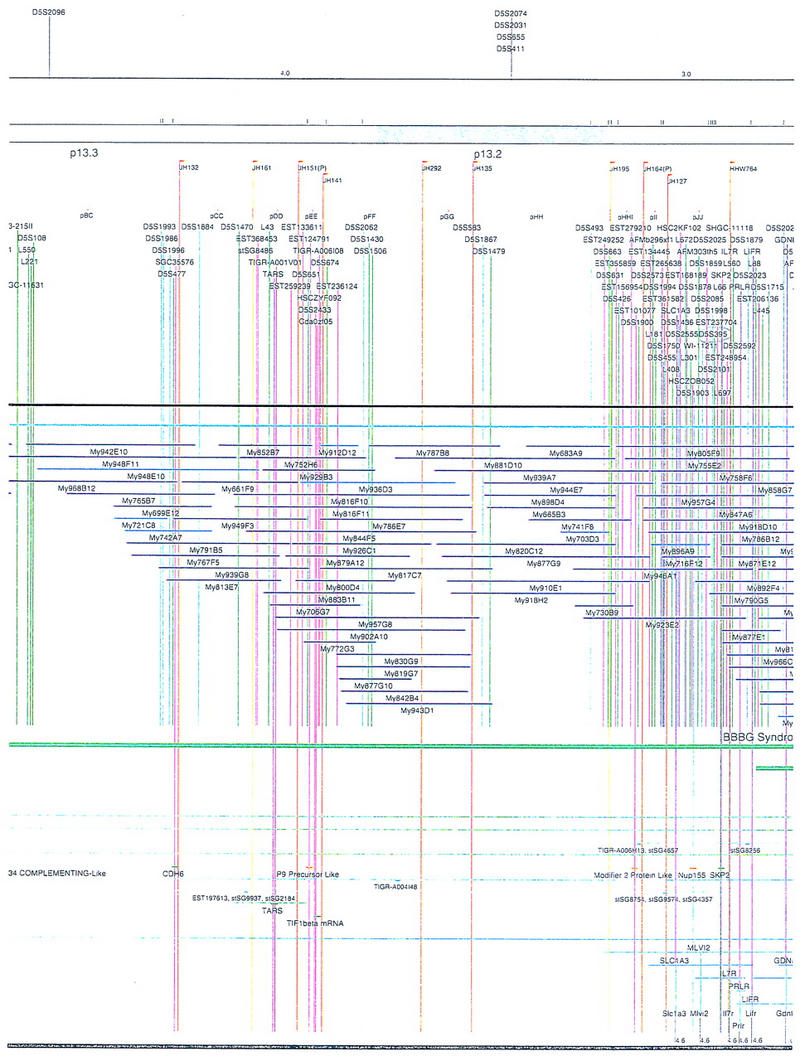
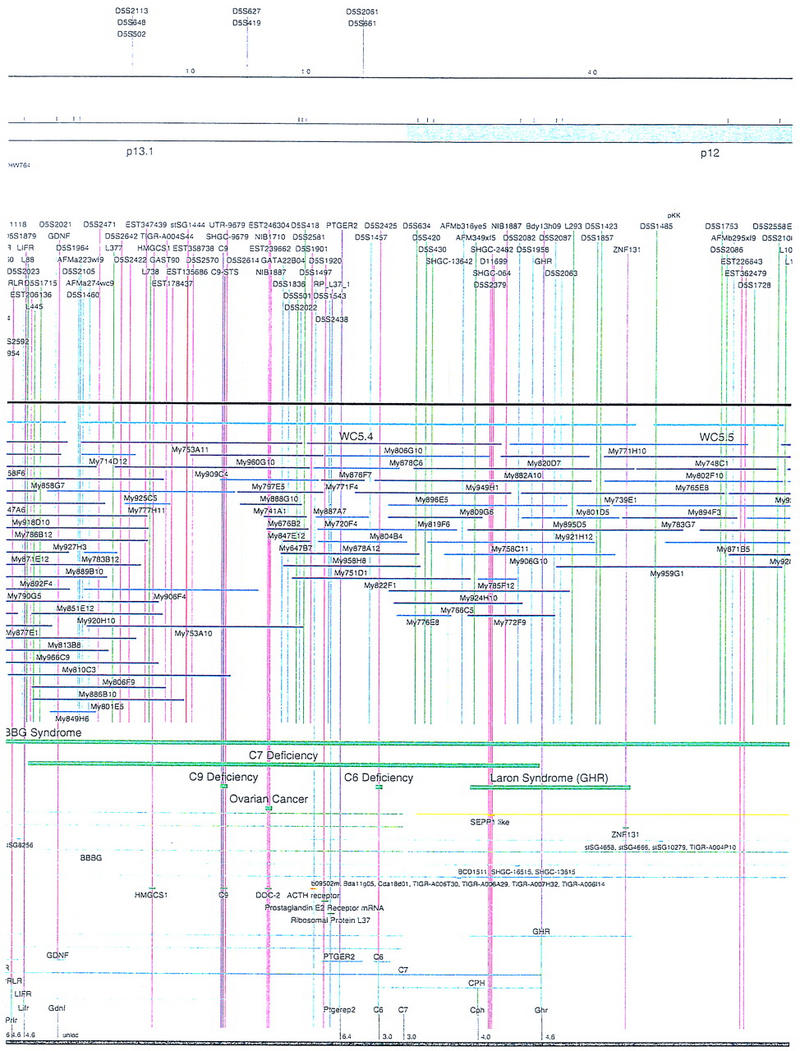
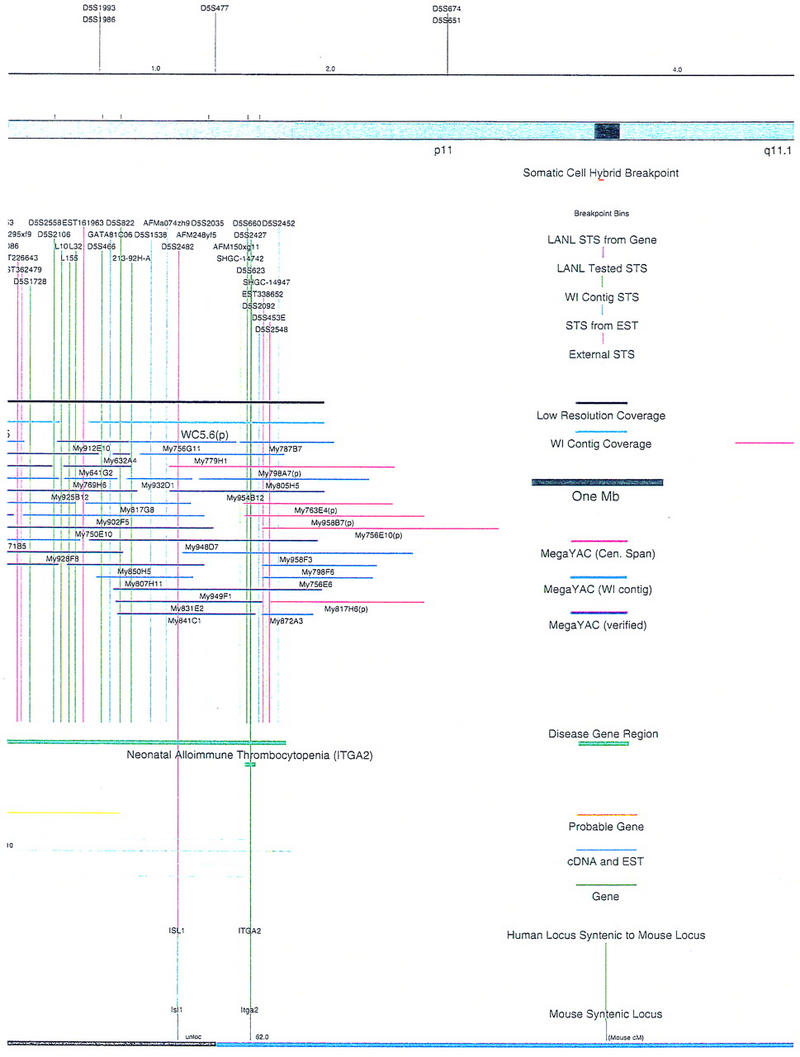
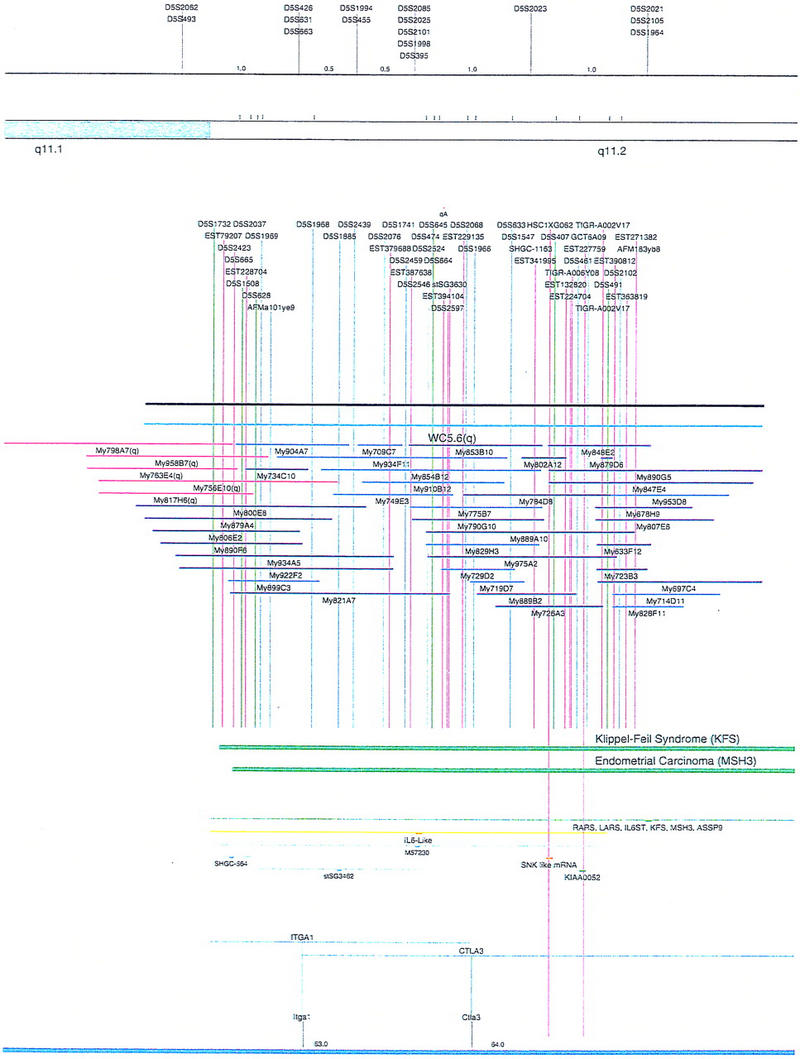
Integrated physical map of human chromosome 5p. The map is represented on 10 consecutive pages and includes all of the short arm (p) of chromosome 5, the centromeric region, and the proximal 4.5 Mb of the long arm (q). The map is arranged from top to bottom in tiers depending on the type of information that is provided. The uppermost tier represents the genetic map of human chromosome 5p, with the genetic markers (D5S no.) indicated along the map in a centimorgan (cM) scale. Lines connecting the genetic positions of the markers and physical positions indicate the correspondence between the two maps. The scale for the physical map is 3 cm = 1 Mb of DNA. The next tier depicts the ideogram of the chromosome. Below the ideogram, the somatic cell hybrid breakpoints are shown with orange vertical lines continuing through the remainder of the map and arrows to indicate the region of the chromosome represented in a given somatic cell hybrid. Breakpoints that have been anchored cytogenetically are indicated by registration lines extending upward to specific cytogenetic bands. The bin names (pA–qA) delineated by the breakpoints are shown in the next tier. The level below depicts the STSs and ESTs found on the chromosome. Registration lines for these markers are color coded to represent anonymous markers (green), ESTs (red), and genes (violet), tested in this study, and integrated STSs tested by the Whitehead Institute (blue). Below the STS tier is a black bar summarizing YAC coverage. Gaps in this bar indicate potential discontinuities in mega-YAC coverage. The turquoise bars below the low resolution coverage are an overlay of the Whitehead YAC contig coverage (Hudson et al. 1995). Beneath the Whitehead contigs are mega YACs (names beginning with My) and a few smaller YACs made by collaborating labs. The CEPH mega YACs are drawn to scale according to their size reported by CEPH or determined by our laboratory. YACs of unknown length were sized according to their STS coverage. Dark blue, light blue, and violet red are used to indicate YACs tested for this study, Whitehead contig YACs untested for this study, but integrated into the SIGMA map, and tested YACs that span the centromere, respectively. The STS content data generated here for each YAC is available from the authors. Reported disease regions and genes located through Online Mendelian Inheritance in Man (OMIM), indicated by lime green bars, are depicted in the level below the YACs. The next tier shows genes (green), psuedo or homologous genes (orange), and cDNAs (turquoise), which have been localized minimally to the cytogenetic map. The horizontal length of the line corresponds to the ambiguity of the element's location; some were localized cytogenetically whereas others were confined to YAC members containing the sequence. Registration lines from markers intersect genes in which they are contained. Those genes we localized more precisely by PCR for this study are indicated by purple registration lines. The next tier depicts those genes that have also been mapped to mouse chromosomes. The corresponding mouse syntenic loci, mouse syntenic chromosome regions, and mouse cM location are shown in the bottom tier of the integrated map.
The map contains 522 YACs and 504 STSs (Fig. 2). There are an average of 4.6 STSs per YAC and 6.5 YACs per STS. Whereas all 522 YACs were used to construct the map, only the positions of 461 YACs (84%), that best represent the contigs, are depicted in Figure 2. In general, YACs known to be chimeric (either by in situ hybridization or STS content from other chromosomes) are not shown on Figure 2 unless they added unique information. As indicated in Figure 2, the SIGMA map includes 382 YACs localized independently by our laboratory and 79 YACs localized by Hudson et al. (1995).
The scale of the map was determined by an estimate of 48 Mb for the short arm of chromosome 5 (194 Mb total, Morton 1991; Grady et al. 1996). The distance between markers and contig length was estimated with the constraints of YAC lengths either reported by Genethon, or for a small subset (∼10%), independently determined by our laboratory. SIGMA and SEGMAP (Green and Green 1991) were then used to optimize marker/clone order/distance as described (Doggett et al. 1995). Chromosome breakpoints for a set of somatic cell hybrids containing 5p deletions were used to define bins such that the physical map could be anchored to the cytogenetic map (Overhauser et al. 1994; Gersh et al. 1995). The position of the centromere was identified by a number of criteria. First, YACs considered to reside close to the centromere were localized by in situ hybridization (Riethman et al. 1989; McCormick et al. 1993). YAC clones 924H10 and 889A10 clearly localized noncentromerically to the p and q arm, respectively. YAC 748C1 hybridized on the p arm close to the centromere (data not shown). The chromosome 5 centromeric region has been estimated to contain ∼3 Mb of α-satellite and satellite II/III DNA (Moyzis et al. 1987; Meyne et al. 1989; Grady et al. 1992; data not shown). This is consistent with the standard cytogenetic ideogram length of the centromere shown in Figures 1 and 2. No YACs isolated for this study contained large blocks of centromeric α-satellite or satellite II/III repeat DNA. Five YACs, however, contained STS markers from both the p and q arms, and hybridized in situ to the centromeric region (Fig. 2). None of these YACs are long enough to bridge the presumed size of the centromere. The independent isolation of 5 different YACs containing both p and q arm proximal markers suggests that rather than being chimeras, either (a) they originated as much larger YACs that deleted portions of centromeric DNA, or (b) there exists a duplication of the pericentric region of chromosome 5 at the p and q junctions. Although it has been reported that both α-satellite and satellite II/III DNA are difficult to maintain in both yeast and Escherichia coli cells (Neil et al. 1990; Peterson et al. 1996), the probability that the pericentric region of chromosome 5 contains duplicated material is high (see below).
The telomeric end of the map is less well defined, because a telomeric half YAC for 5p has not been isolated yet, despite numerous attempts (Riethman et al. 1989; data not shown). The telomeric regions of most human chromosomes are under-represented in the mega-YAC library, presumably due to the well-known end effects inherent in the production of size-selected recombinant DNA libraries, and the GC richness of many of these regions (Doggett et al. 1995). The extensive somatic cell hybrid panel map of 5p, however, allows for a reasonable approximation of the location of the telomere (Figs. 1,2; Overhauser et al. 1994; Gersh et al. 1995).
Map Construction and Integration
The initial STS marker/YAC order was experimentally and computationally determined in our laboratory by analyzing the STS content data for 216 STSs and 436 YACs. These YACs (dark blue) and STSs (green) are indicated in Figures 1 and 2 (see overview of the project, steps 1–3 above). The pictured STS order assumed YAC deletion was minimal and that consistency with the somatic cell hybrid and genetic map order should be maintained (Doggett et al. 1995). In the small number of discrepancies observed, it was assumed that marker order obtained by STS/YAC mapping was correct, and this is the order indicated on the SIGMA map (Fig. 2). Attempts at gap closure by rescreening the entire mega YAC library with STS markers residing at the ends of the contigs yielded no new clones. At this stage of the map, ∼92% (44 Mb) of chromosome 5p was covered in YAC/STS contigs.
To attempt an integration of our experimentally determined physical map with the whole-genome YAC/STS maps generated by other groups (Chumakov et al. 1995; Hudson et al. 1995), SIGMA was used to computationally compare results. Information from the Genethon and Whitehead whole genome projects could be compared directly, because the same recombinant DNA library was used in these studies (Chumakov et al. 1995; Hudson et al. 1995). The Genethon map of 5p, on the basis of genetic markers, contains 338 YACs anchored by 58 STSs in 1 of 29 bins (Chumakov et al 1995). Similar to what was described by Doggett et al. (1995), we were able to confirm much of the Genethon level 1 data obtained by STS content mapping, but found the YACs related by overlaps in levels 2 and above to be less likely to be derived from chromosome 5p. Only 34.3% of the Chumakov et al. (1995) 5p YACs are present on our integrated map (Fig. 2), mostly because of their tier 1 data.
The genome map reported by the Whitehead Institute group on the other hand, is very consistent with our map. No major discrepancies were observed between the two maps. Data in Hudson et al. (1995) (Data Release II) indicate that the part of their whole genome map representing 5p and the proximal portion of 5q includes 7 contigs, comprising 563 YACs and 190 STSs. Most of these clones are the same as those on our map, so a direct integration is possible. By use of SIGMA, YAC clones mapped in this study (dark blue in Fig. 2) that also were mapped by Hudson et al. (1995), have had additional STS data integrated from that study (blue STSs in Fig. 2), without confirmation from our laboratory. Although our contig coverage near the telomere was more complete than the Whitehead mapping effort (Fig. 2), the Whitehead map near the centromere was more extensive (Hudson et al. 1995). Seventy-nine Whitehead-identified YACs, not identified by our study, are integrated in Figure 2 (light blue), using SIGMA to minimize discrepancies between the data sets.
Our initial map of 5p contained 436 YACs anchored with 216 STSs, and represented 92% (44 Mb) of chromosome 5p (Fig. 2). The map of Hudson et al. (1995) contained 563 YACs anchored with 190 STSs, and represented 86% (41 Mb) of 5p. By comparing and combining these independently derived physical maps, a map containing 552 YACs and 504 STSs was obtained (Fig. 2). The four contigs (Fig. 1) span between 1 and 25 Mb of DNA and represent ∼94% of chromosome 5p (Fig. 1). Four gaps, defined as regions not believed to be represented by YAC DNA, appear to exist at the telomeric end, within Bin A, between Bins A and B, and within Bin R. These gaps are estimated to contain <4 Mb of unmapped DNA. An additional contig of ∼5 Mb represents the centromere proximal region of the q arm (Figs. 1,2).
Map Completeness
The localization of 504 STS markers along an estimated 48 Mb of human chromosome 5p DNA, for an average STS spacing of 95 Kb, has met one of the initial goals of the Human Genome Project (Botstein et al. 1990). The completeness of the map can also be assessed by a completeness at resolution graph (Olson and Green 1993; Doggett et al. 1995) (Fig. 3). This measure conveys the fraction of the chromosome that is found within a certain distance of a discernible point on the map, including YAC ends, markers, and breakpoints. Because the SIGMA map contains 504 markers, 922 YAC ends, and 56 breakpoint bins, a total of 1482 discrete elements can be used to position newly derived 5p sequences. The graph indicates that the completeness of the STS/YAC end/breakpoint map, at a resolution of 100 kb, is 0.81, or that 81% of the chromosome is within 50 kb of one of these mapped elements. The completeness of the STS map alone at a resolution of 100 kb is 0.56. The discrepancy between the curves representing the predicted and actual values exists because the markers are not randomly distributed, many being generated by targeted approaches (i.e., Simmons et al. 1995), whereas the predicted curve is based on a random distribution.
Figure 3.
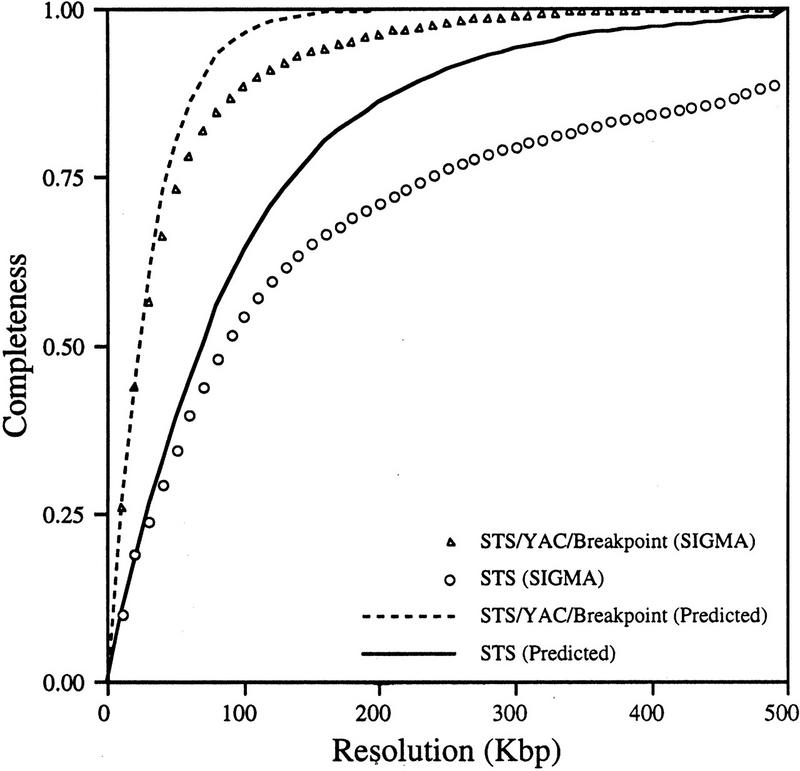
Completeness at resolution graph for the YAC/STS/Hybrid breakpoint (BP) map. The location of each STS, YAC end, and hybrid breakpoint (data points) was extracted from the SIGMA map. A window of given size was moved that distance down the chromosome. For each interval, it was determined whether any data points were contained within the window. The result of different window sizes was evaluated at regular intervals to create the plot. (▴) The curve generated by use of STSs, YAC ends, and BPs; (○) the curve for the STSs alone. The predicted completeness at resolution curves (broken line for STS/YAC/BP and solid line for STS alone) were obtained by randomly placing the same number of sites on the map.
Integration of Genes, ESTs, and Mouse Homologs
From the hundreds of gene markers and ESTs mapped to 5p by other laboratories (Schuler et al. 1996; Deloukas et al. 1998), Figure 2 shows a subset of 53 gene sequences and disease regions useful as landmarks. In most cases, this information was collected from the National Center for Biotechnology Information (NCBI), Genbank, and the Genome Database (GDB). Of the identified genes that had been reported previously to exist on 5p by cytogenetic analysis, 15 have been localized more precisely to YAC members of our contig by PCR with primers directed to the gene sequence (Fig. 2; Methods). Because the mouse homologs for many of the genes found on 5p have been mapped (Mouse Genome Database), the syntenic chromosome information is also displayed in Figure 2. BLAST searches with marker sequences permitted us to identify additional elements, including putative pseudogenes and other regions displaying homology to reported sequences. Markers fitting this description are indicated in Figure 2. Finally, anonymous cDNAs captured from the cri-du-chat critical region (Simmons et al. 1995, 1997) are shown as well.
Comparison with the Genetic and Radiation Hybrid Maps
A direct comparison to the 5p Genetic map can be made, because numerous markers are present on both maps (Gersh et al. 1994; Dib et al. 1996), and SIGMA allows us to estimate physical distances directly. Interestingly, the physical map differs significantly from the genetic map. Whereas the short arm of chromosome 5 is ∼25% of the total chromosome on the basis of its cytogenetic size, it accounts for about one-third of the genetic distance. Therefore, there is more recombination on the short arm than would be expected for its relative size. Furthermore, by plotting genetic versus physical distance over the length of the map (Fig. 4), local recombinationally inert and active regions are revealed. Relatively inactive regions include the 5p telomere, centromere, the portion of 5p immediately proximal to the centromere, and dark band regions including p13.1, p14.1, and p14.3. The remainder of the chromosome, including the mapped material on the other side of the centromere, is fairly recombinationally active.
Figure 4.
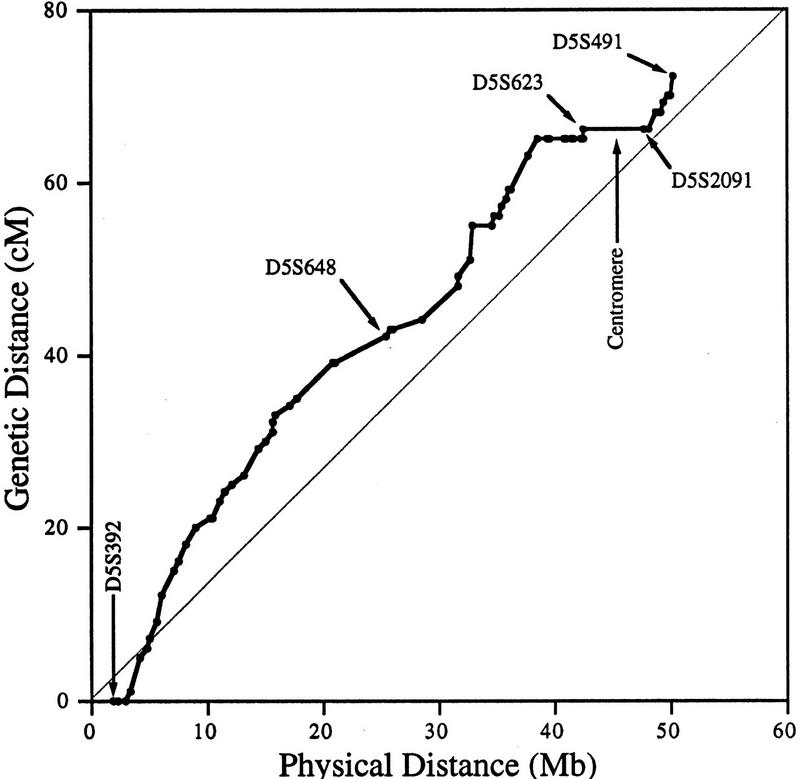
Correlation between genetic and physical distances for genetic markers. Genetic distances between markers, taken from Gersh et al. (1994), Murray et al. (1994), and Dib et al. (1996) for chromosome 5p, are shown in the first tier of Fig. 2. Physical distances between markers were determined from the location of these markers in the SIGMA map. All genetic markers were localized to the mega-YAC contigs, whereas a subset were localized to breakpoint intervals. Genetic markers D5S1996, D5S631, D5S430, and D5S665 were removed from the plot because of ordering discrepancies with respect to the physical map. Selected genetic markers and the location of the centromere are indicated on the graph for reference.
A direct comparison with radiation hybrid maps of 5p is also possible by use of markers shared by both studies (McPherson et al. 1997). Whereas the experimentally determined linear order of markers is, in general, the same between the two maps, the number of markers on the physical map (Fig. 2) is nearly an order of magnitude greater. Like the genetic map, there is a greater than fivefold (14.8–81.5 cR/Mb observed, McPherson et al. 1997) difference in the ratio of cR/Mb between various mapped markers, making direct comparisons imprecise. In the few cases in which radiation hybrid mapping could split markers that physical mapping could not (i.e., 675,405,5pC; 502,648 5pI; 663,426 5pM), this information did not assist in the unambiguous definition of the STS order.
Map Quality
Whereas YACs containing long stretches of contiguous DNA are very useful for generating first-generation physical maps, contributing critical contig information, the integrity of the YAC DNA is not always strictly maintained. It is clear by close examination of the map that some YACs that have STSs missing have likely undergone deletions or contain DNA from noncontiguous regions of the genome. According to available data, ∼90 of the YACs reported on this map have been observed to contain DNA (i.e., STSs) from chromosomes other than 5; this chimera fraction is calculated to be 33%, similar to previous reports (Chumakov et al. 1995; Doggett et al. 1995; Hudson et al. 1995).
The mega-YAC physical map of 5p appears to be nearly complete. It has been estimated that ∼2% of the genome will not be represented among the mega-YAC library (Chumakov et al. 1995). Because 34,560 YAC clones from the Centre d'Etude du Polymorphisme Humain (CEPH) Mark II and mega-YAC libraries (10X coverage) were used to generate the Genethon YAC contig map of the human genome (Chumakov et al. 1995), it is estimated that ∼520 of these YACs (1.5 %) map to 5p. Because our map of 5p, resulting from the collective effort of several laboratories, includes 510 CEPH mega YACs (with an additional 42 on the proximal portion of 5q), nearly all of the Mark II and mega YACs expected to reside on 5p have been tested and most of them have been localized on the integrated map.
Map Peculiarities
There are several notable features of the 5p map that suggest rearrangements have occurred within the DNA close to the centromere. Because one would expect a fairly even distribution of YACs to cover the chromosome, the relatively high number of YACs localized to the proximal region of 5p suggests that this region of the chromosome may represent a tandem duplication. However, in situ hybridization of a small sample of YAC clones from this region to metaphase chromosome spreads gives no indication of a large tandem duplication (data not shown). We have drawn the map assuming this region is not tandemly duplicated, but, it remains a formal possibility that should be considered. Another peculiarity is that some markers found 10–20 Mb apart on opposite sides of the centromere (i.e., L88 and D5S491) appear to be present together on multiple YACs. Furthermore, the order of several genes in this region is rearranged with respect to the homologous genes clustered on mouse chromosome 15. This also suggests that there is duplicated material close to the centromere. Interestingly, two independent laboratories have identified gene sequences (ZNF4–Habeebu et al. 1989, PMCLH–Pedeutour et al. 1994) that hybridize to both sides of the centromere. A duplication and rearrangement scheme close to the centromere has been proposed to occur on chromosome 5 by others (Pedeutour et al. 1994; Sargent et al. 1994) as well as on other chromosomes (Tunnacliffe et al. 1993; Eichler 1999). Only further high-resolution mapping and sequencing will resolve the organization in this region.
The map represented here is our current view of the chromosome, considering all of the available data. Errors in maps this complex are perhaps inevitable, owing to the presence of low abundance repeats, chimeric clones, deleted clones, and chromosomal duplications. We would like to hear of any potential errors in this map and any relevant data that could refine it. Correspondence concerning the integrated 5p map can be sent electronically to dgrady@uci.edu.
METHODS
YAC Contig Construction
DNA from microtiter plates (372) of the CEPH mega-YAC library were pooled into 672 pools from an array of 11X17X2 plates by a row and column-pooling scheme. From adjacent pools of the original 672, 95 primary level pools, each containing 6 columns (column half-plates), or 8 rows (row plates), were created. In this design, a positive for one YAC in the library should result in five positive pools (three rows and two columns) at the primary level of screening. Primary through tertiary level screens with chromosome 5p STSs were conducted as described previously (Doggett et al. 1995).
A sublibrary of YACs (tier 1 to tier 3) previously localized to chromosome 5p (Cohen et al. 1993; Chumakov et al. 1995) was also assembled for STS screening. To provide contig nucleation points, 84 STSs generated from flow-sorted chromosome 5 DNA were tested against this pool. All 84 STSs had been localized previously to 1 of 51 bins (average size 1 Mb) on 5p, by somatic cell breakpoint analysis (Overhauser et al. 1994; Grady et al. 1996; Gersh et al. 1997).
Two primer sets (labeled 84c11 and 84-c11) were derived from the cosmid 84c11 (Overhauser et al. 1994) sequence to generate additional contig information near the telomeric end. These primers are as follows: 84-c11: 5′-TGGTCTAGTAATCGTTCAGGATTTC-3′ and 5′-GGAAATCACTATTTCTCACTTCTG-3′ (product 285 bp); and 84c11: 5′-ACGCATGTGTCAGTACTAATTTTTG-3′ and 5′-GGGTGCAAACTTTGTTTATAAAAG-3′ (product 109 bp). Additional STSs were identified from previously mapped λ-phage clones D5S19, D5S32, D5S712, and D5S730 (Overhauser et al. 1994). Single-copy DNA fragments from each λ-phage clone were sequenced and PCR primers were designed. The PCR primers used are as follows: D5S19 (213-44E-A), 5′-ATGTGACCTGACCTTGGACA-3′ and 5′-GGATCATCAGTCTCAATAGC-3′ (PCR product 340 bp); D5S32 (213-92H-A), 5′-TTGTCAACAGCAGCGACTCA-3′ and 5′-GAGCTGTTGCGTGTTAATTC-3′ (PCR product 270 bp); D5S712 (D5S1521), 5′-AGCAGCAGCCGTTAGTGTAG-3′ and 5′-GGACGATAGACTTAGAAGTC-3′ (PCR product 192 bp); D5S730 (213-215-EAA), 5′-TCAAGAAGACTACCACATGA-3′ and 5′-CTCTCTTATTCCAAGATTC-3′. An additional 132 STSs localized to 5p and generated by other genome-wide mapping efforts (Whitehead, Genethon, Stanford, and CHLC) were synthesized and tested independently by our laboratory against our nucleated YAC contigs. STSs from regions of low coverage were used to identify additional YACs by screening the entire mega-YAC library. YAC/STS maps were constructed as described (Doggett et al. 1995), with SIGMA. SIGMA allows sized DNA segments to be placed on a map with discrete objectives (relationships) to other mapped objects. Once all of the objects are placed on the map and all of the possible objectives are met, a picture of that region will be graphically represented. Because SIGMA uses scaled objects, coverage of the chromosome region is easily calculated. SIGMA was also used to computationally compare our mapping results with the physical maps generated by Hudson et al. (1995) and Chumakov et al. (1995). All STS markers used for map assembly in this study have been published (Overhauser et al. 1994; Grady et al. 1996; Gersh et al. 1997; Dib et al. 1996; Gyapay et al. 1996; Hudson et al. 1995, this work), and most can be accessed from the appropriate website (below).
Gene and mRNA Mapping
The indicated genes, putative genes, and sequence homologies were localized to YAC members of our contig in the following way. Primer sets directed to genes were either found in the literature or designed from the published gene sequence. These primers were synthesized and used to screen the relevant YAC contig region by PCR. The primer sets for retinal mRNA, TARS, HMGCS1, PMCHL1, LIFR, SKP2, IL7R, PTGER2, GLAST1, and ZNF131 were designed for this study and their sequences are as follows: retinal mRNA, 5′-TCAAGGTCAAGCGTTAGTCG-3′ and 5′-CTGTGAGTTTAGTGGGGAAG-3′ (product 99 bp); TARS, 5′-AGGAGGAGTTTGGCAAAGTC-3′ and 5′-CTCCCACATTACACTAAAGC-3′ (product 185 bp); HMGCS1 5′-ATATTCCAAGCCCTGCCAAG-3′ and 5′-TGAAGTCTTGCACCTCACAG-3′ (product 115 bp); PMCHL1, 5′-ATGGTCTGTCACTGAATCTG-3′ and 5′-AGCTGAGTTTTCTTCATCCC-3′ (product 137 bp); LIFR, 5′-TAACAGTGTCACCGTGTCAC-3′ and 5′-ATACTTCACAGGATCCCTCC-3′ (product 103 bp); SKP2, 5′-CAGGGAAAATAGGCAGGAAG-3′ and 5′-TGGGCTCCCTAGTATACTTG-3′ (product 101 bp); IL7R, 5′-TGACCACTCTTCCTGAGTTC-3′ and 5′-AGCTGAATCATTGGGTCACC-3′ (product 105 bp); PTGER2, 5′-GCGAGTAAGAAATCCAGCAC-3′ and 5′-CAGTGGCTGTCGATTTTTGG-3′ (product 115 bp); GLAST1, 5′-CTTTAAAGTGCCCATCCAGG-3′ and 5′-TCAAAGAACTCTCTCAGGGC-3′ (product 222 bp); and ZNF131, 5′-CACTGAGTCATTGCCATCTG-3′ and 5′-TGTACTTTACGGACTGCTTGG-3′ (product 134 bp). Mouse syntenic genes were identified through GDB and NCBI.
Computer Resources
Four computer resources were invaluable to this process, internet resources, relational database processing, laboratory tracking, and SIGMA map assembly. World Wide Web (WWW) access to external laboratories facilitated the collection of large amounts of recently generated data. The primary WWW sites that provided mapping data were the Whitehead Institute, CEPH/Genethon, GDB, and NCBI. A relational database was used to manage, analyze, assimilate, and report on the many available data sets. Laboratory tracking used a 4D database to record all of the experimental results and multiple Excel spread sheets to build an STS/YAC matrix.
Acknowledgments
This paper is dedicated to the memory of Michelle Valdez, who contributed to this work and died tragically before it's completion. We appreciate the technical support of L. Sue Thompson for DNA oligomer synthesis, Lynne Goodwin, Linda Meincke, and Judy Tesmer for library screening, Evelyn Campbell for in situ hybridization, and Norman Doggett for comments on the manuscript and assistance with figure preparation. Funded by the United States Department of Energy under contract W-7405-ENG-36 and Grant DE-FG03-97ER62485.
The publication costs of this article were defrayed in part by payment of page charges. This article must therefore be hereby marked “advertisement” in accordance with 18 USC section 1734 solely to indicate this fact.
Footnotes
E-MAIL dgrady@uci.edu; FAX (949) 824-3403.
REFERENCES
- Ashworth LK, Batzer MA, Brandriff B, Branscomb E, deJong P, Garcia E, Garnes JA, Gordon LA, Lamerdin JE, Lennon G, et al. An integrated metric physical map of human chromosome 19. Nat Genet. 1995;11:422–427. doi: 10.1038/ng1295-422. [DOI] [PubMed] [Google Scholar]
- Bell CJ, Budarf ML, Nieuwenhuijsen BW, Barnoski BL, Buetow KH, Campbell K, Colbert AM, Collins J, Daly M, Desjardins PR, et al. Integration of physical, breakpoint and genetic maps of chromosome 22. Localization of 587 yeast artificial chromosomes with 238 mapped markers. Hum Mol Genet. 1995;4:59–69. doi: 10.1093/hmg/4.1.59. [DOI] [PubMed] [Google Scholar]
- Botstein D, Cantor C, Carbonell J, Carrano A, Caskey T, Collins F, Francke U, Lander E, Lerman L, Moyzis R, et al. Understanding Our Genetic Inheritance. The U.S. Human Genome Project: The First Five Years. FY 1991–1995. 1990. No. DOE/ER–0452P, NIH No. 90–1590. [Google Scholar]
- Bouffard GG, Idol JR, Braden VV, Iyer LM, Cunningham AF, Weintraub LA, Touchman JW, Mohr-Tidwell RM, Peluso DC, Fulton RS, et al. A physical map of human chromosome 7: An integrated YAC contig map with average STS spacing 79 kb. Genome Res. 1997;7:673–692. doi: 10.1101/gr.7.7.673. [DOI] [PubMed] [Google Scholar]
- Centre d'Etude du Polymorphisme Humain (CEPH)-Genethon: http://www.cephb.fr/ceph-genethon-map.html
- Chumakov IM, Le Gall I, Billault A, Ougen P, Soularue P, Guillou S, Rigault P, Bui H, De Tand MF, Barillot E, et al. Isolation of chromosome 21-specific yeast artificial chromosomes from a total human genome library. Nat Genet. 1992;1:222–225. doi: 10.1038/ng0692-222. [DOI] [PubMed] [Google Scholar]
- Chumakov, I.M., P. Rigault, I. Le Gall, C. Bellanne-Chantelot, A. Billault, S. Guillou, P. Soularue, G. Guasconi, E. Poullier, I. Gros et al. 1995. A YAC contig map of the human genome. Nature 377: (Suppl.)175–297. [DOI] [PubMed]
- Church DM, Bengtsson U, Nielsen KV, Wasmuth JJ, Niebuhr E. Molecular definition of deletions of different segments of distal 5p that result in distinct phenotypic features. Am J Hum Genet. 1995;56:1162–1172. [PMC free article] [PubMed] [Google Scholar]
- Cohen D, Chumakov I, Weissenbach J. A first-generation physical map of the human genome. Nature. 1993;366:698–701. doi: 10.1038/366698a0. [DOI] [PubMed] [Google Scholar]
- Collins, J.E., C.G. Cole, L.J. Smink, C.L. Garrett, M.A. Leversha, C.A. Soderlund, G.L. Maslen, L.A. Everett, K.M. Rice, A.J. Coffey et al. 1995. A high-density YAC contig map of human chromosome 22. Nature 377: (Suppl)367–379. [DOI] [PubMed]
- Collins FS, Patrinos A, Jordan E, Chakravarti A, Gesteland R, Walters L members of the DOE and NIH planning groups. New goals for the U.S. Human Genome Project:1998–2003. Science. 1998;282:682–689. doi: 10.1126/science.282.5389.682. [DOI] [PubMed] [Google Scholar]
- Cooperative Human Linkage Center (CHLC): http://www.chlc.org/HomePage.html [DOI] [PubMed]
- Crollius HR, Ross MT, Grigoriev A, Knights CJ, Holloway E, Misfud J, Li K, Playford M, Gregory SG, Humphray SJ, et al. An integrated YAC map of the human X chromosome. Genome Res. 1996;6:943–955. doi: 10.1101/gr.6.10.943. [DOI] [PubMed] [Google Scholar]
- Deloukas P, Schuler GD, Gyapay G, Beasley EM, Soderland G, Rodriguez-Tome P, Hui L, et al. A physical map of 30,000 human genes. Science. 1998;282:744–746. doi: 10.1126/science.282.5389.744. [DOI] [PubMed] [Google Scholar]
- Dib C, Faure S, Fizames C, Samson D, Drouot N, Vignal A, Millasseau P, Marc S, Hazan J, Seboun E, et al. A comprehensive genetic map of the human genome based on 5,264 microsatellites. Nature. 1996;380:152–154. doi: 10.1038/380152a0. [DOI] [PubMed] [Google Scholar]
- Doggett, N.A., L.A. Goodwin, J.G. Tesmer, L.J. Meincke, D.C. Bruce, L.M. Clark, M.R. Altherr, A.A. Ford, H.C. Chi, and B.L. Marrone et al. 1995. An integrated physical map of human chromosome 16. Nature 377: (Suppl)335–365. [DOI] [PubMed]
- Eichler EE. Repetitive conundrums of centromere structure and function. Hum Mol Genet. 1999;8:151–155. doi: 10.1093/hmg/8.2.151. [DOI] [PubMed] [Google Scholar]
- Foote S, Vollrath D, Hilton A, Page DC. The human Y chromosome: Overlapping DNA clones spanning the euchromatic region. Science. 1992;258:60–66. doi: 10.1126/science.1359640. [DOI] [PubMed] [Google Scholar]
- Gemmill, R.M., I. Chumakov, P. Scott, B. Waggoner, P. Rigault, J. Cypser, Q. Chen, J. Weissenbach, K. Gardiner, and H. Wang et al. 1995. A second-generation YAC contig map of human chromosome 3. Nature 377: (Suppl)299–319. [DOI] [PubMed]
- GenBank Database Query Form, National Center for Biotechnology Information, http://www.ncbi.nlm.nih.gov/genbank/query_form.html
- Genome Data Base (GDB), University School of Medicine, Johns Hopkins University, Baltimore, MD, 1996.: http://gdbwww.gdb.org/
- Gersh M, Goodart SA, Overhauser J. Physical mapping of genetic markers on the short arm of chromosome 5. Genomics. 1994;24:577–579. doi: 10.1006/geno.1994.1668. [DOI] [PubMed] [Google Scholar]
- Gersh M, Goodart SA, Pasztor LM, Harris DJ, Weiss L, Overhauser J. Evidence for a distinct region causing a cat-like cry in patients with 5p deletions. Am J Hum Genet. 1995;56:1404–1410. [PMC free article] [PubMed] [Google Scholar]
- Gersh M, Grady D, Rojas K, Lovett M, Moyzis R, Overhauser J. Development of diagnostic tools for the analysis of 5p deletions using interphase FISH. Cytogenet Cell Genet. 1997;77:246–251. doi: 10.1159/000134586. [DOI] [PubMed] [Google Scholar]
- Goodart SA, Simmons AD, Grady D, Rojas K, Moyzis RK, Lovett M, Overhauser J. A yeast artificial chromosome contig of the critical region for cri-du-chat syndrome. Genomics. 1994;24:63–68. doi: 10.1006/geno.1994.1582. [DOI] [PubMed] [Google Scholar]
- Grady DL, Robinson DL, Gersh M, Nickerson E, McPherson J, Wasmuth JJ, Overhauser J, Deaven LL, Moyzis RK. The generation and regional localization of 303 new chromosome 5 sequence-tagged sites. Genomics. 1996;32:91–96. doi: 10.1006/geno.1996.0080. [DOI] [PubMed] [Google Scholar]
- Green ED, Green P. Sequence-tagged site (STS) content mapping of human chromosomes: Theoretical considerations and early experiences. PCR Methods Applic. 1991;1:77–90. doi: 10.1101/gr.1.2.77. [DOI] [PubMed] [Google Scholar]
- Gyapay G, Schmitt K, Fizames C, Jones H, Vega-Czarny N, Spillett D, Muselet D, Prud'Homme JF, Dib C, Auffray C, et al. A radiation hybrid map of the human genome. Hum Mol Gen. 1996;5:339–346. doi: 10.1093/hmg/5.3.339. [DOI] [PubMed] [Google Scholar]
- Habeebu SSM, Gibson JE, Affara NA, Ferguson-Smith MA. Localization of two zinc finger protein genes to (a) two loci on chromosome 5 at 5p13-p14 and 5q12-q13 and to (b) the long arm of the X at Xq13-q21. Cytogenet Cell Genet. 1989;51:1009. [Google Scholar]
- Hudson TJ, Stein LD, Gerety SS, Ma J, Castle AB, Silva J, Slonim DK, Baptista R, Kruglyak L, Xu SH, et al. An STS-based map of the human genome. Science. 1995;270:1945–1954. doi: 10.1126/science.270.5244.1945. . with supplementary data from the Whitehead Institute/MIT Center for Genome Research, Human Genetic Mapping Project, Data Release 11 (October 1996). [DOI] [PubMed] [Google Scholar]
- Krauter, K., K. Montgomery, S.J. Yoon, J. LeBlanc-Straceski, B. Renault, I. Marondel, V. Herdman, L. Cupelli, A. Banks, J. Lieman et al. 1995. A second-generation YAC contig map of human chromosome 12. Nature 377: (Suppl)321–333. [DOI] [PubMed]
- Lejuene J, Lafourcade J, Berger R, Vialatte J, Boeswillwald M, Seringe P, Turpin R. Tois cas de deletion partielle du bras court d'un chromosome 5. CR Acad Sci (Paris) 1963;257:3098–3102. [PubMed] [Google Scholar]
- McCormick MK, Buckler A, Bruno W, Campbell E, Shera K, Torney D, Deaven L, Moyzis R. Construction and characterization of a YAC library with a low frequency of chimeric clones from flow-sorted human chromosome 9. Genomics. 1993;18:5538. doi: 10.1016/s0888-7543(05)80355-6. [DOI] [PubMed] [Google Scholar]
- McPherson JD, Apostol B, Wagner-McPherson CB, Hakim S, Del Mastro R, Aziz N, Baer E, Gonzales G, Krane MC, Markovich R, Masny P, et al. A radiation hybrid map of human chromosome 5 with integration of cytogenetic, genetic and transcript maps. Genome Res. 1997;7:897–909. doi: 10.1101/gr.7.9.897. [DOI] [PubMed] [Google Scholar]
- Meyne J, Littlefield LG, Moyzis RK. Labeling of human centromeres using an alphoid DNA consensus sequence: Application to the scoring of chromosome aberrations. Mut Res. 1989;226:75–79. doi: 10.1016/0165-7992(89)90046-8. [DOI] [PubMed] [Google Scholar]
- Morton NE. Parameters of the human genome. Proc Natl Acad Sci. 1991;88:7474–7476. doi: 10.1073/pnas.88.17.7474. [DOI] [PMC free article] [PubMed] [Google Scholar]
- Mouse Genome Database (MGD), Mouse Genome Informatics, The Jackson Laboratory, Bar Harbor, Maine. World Wide Web (URL:http://www.informatics.jax.org/) (October 1996).
- Moyzis RK, Albright KL, Bartholdi MF, Cram LS, Deaven LL, Hildebrand CE, Joste NG, Longmire JL, Meyne J, Schwartzacher-Robinson T. Human chromosome-specific repetitive DNA sequences: Novel markers for genetic analysis. Chromosoma. 1987;95:375–386. doi: 10.1007/BF00333988. [DOI] [PubMed] [Google Scholar]
- Murray JC, Buetow KH, Weber JL, Ludwigsen S, Scherpbier-Heddema T, Manion F, Quillen J, Sheffield VC, Sunden S, Duyk GM, et al. A comprehensive human linkage map with centimorgan density. Cooperative Human Linkage Center (CHLC) Science. 1994;265:2049–2054. doi: 10.1126/science.8091227. [DOI] [PubMed] [Google Scholar]
- Nagaraja R, MacMillan S, Kere J, Jones C, Griffin S, Schmatz M, Terrell J, Shomaker M, Jermak C, Hott C, et al. X chromosome map at 75-kb STS resolution, revealing extremes of recombination and GC content. Genome Res. 1997;7:210–222. doi: 10.1101/gr.7.3.210. [DOI] [PubMed] [Google Scholar]
- National Center for Biotechnology Information (NCBI), National Library of Medicine, Bethesda, MD, 1996.: http://www.ncbi.nlm.nih.gov/
- Neil D, Villasante A, Fisher R, Vetrie D, Cox B, Tyler-Smith C. Structural instability of human tandemly repeated DNA sequences cloned in yeast artificial chromosome vectors. Nucleic Acids Res. 1990;18:1421–1428. doi: 10.1093/nar/18.6.1421. [DOI] [PMC free article] [PubMed] [Google Scholar]
- Niehbuhr E. The cri du chat syndrome. Hum Genet. 1978;44:227–275. doi: 10.1007/BF00394291. [DOI] [PubMed] [Google Scholar]
- Nizetic D, Gellen L, Hamvas RM, Mott R, Grigoriev A, Vatcheva R, Zehetner G, Yaspo ML, Dutriaux A, Lopes C, et al. An integrated YAC-overlap and “cosmid-pocket” map of the human chromosome 21. Hum Mol Genet. 1994;3:759–770. doi: 10.1093/hmg/3.5.759. [DOI] [PubMed] [Google Scholar]
- Olson MV, Green P. Criterion for the completeness of large-scale physical maps of DNA. Cold Spring Harb Symp Quant Biol. 1993;58:349–355. doi: 10.1101/sqb.1993.058.01.041. [DOI] [PubMed] [Google Scholar]
- Online Mendelian Inheritance in Man (OMIM), Center for Medical Genetics, Johns Hopkins University (Baltimore, MD) and National Center for Biotechnology Information, http://www3.ncbi.nlm.nih.gov/omim/
- Overhauser J, Huang X, Gersh M, Wilson W, McMahon J, Bengtsson U, Rojas K, Meyer M, Wasmuth JJ. Molecular and phenotypic mapping of the short arm of chromosome 5: Sublocalization of the critical region for the cri-du-chat syndrome. Hum Mol Genet. 1994;3:247–252. doi: 10.1093/hmg/3.2.247. [DOI] [PubMed] [Google Scholar]
- Pedeutour F, Szpirer C, Nahon JL. Assignment of the human pro-melanin-concentrating hormone gene (PMCH) to chromosome 12q23-q24 and two variant genes (PMCH1 and PMCHL2) to chromosome 5p14 and 5q12-q13. Genomics. 1994;19:31–37. doi: 10.1006/geno.1994.1008. [DOI] [PubMed] [Google Scholar]
- Peterson ET, Grady DL, Moyzis RK. High frequency of mutational changes during the cloning of a human centromeric repeat. In: Sarma RH, Sarma MH, editors. Biological structure and dynamics, proceedings of the ninth conversation, State University of New York. Albany, NY 1995. Albany, NY: Adenine Press; 1996. pp. 209–215. [Google Scholar]
- Qin S, Nowak NJ, Zhang J, Sait SN, Mayers PG, Higgins MJ, Cheng Y, Li L, Munroe DJ, Gerhard DS, et al. A high-resolution physical map of human chromosome 11. Proc Natl Acad Sci. 1996;93:3149–3154. doi: 10.1073/pnas.93.7.3149. [DOI] [PMC free article] [PubMed] [Google Scholar]
- Riethman HC, Moyzis RK, Meyne J, Burke DT, Olson MV. Cloning human telomeric DNA fragments into Saccharomyces cerevisiae using a yeast-artificial-chromosome vector. Proc Natl Acad Sci. 1989;86:6240–6244. doi: 10.1073/pnas.86.16.6240. [DOI] [PMC free article] [PubMed] [Google Scholar]
- Sargent CA, Chalmers IJ, Leversha M, Affara NA. A rearrangement on chromosome 5 of an expressed human beta-glucuronidase pseudogene. Mamm Genome. 1994;5:791–796. doi: 10.1007/BF00292015. [DOI] [PubMed] [Google Scholar]
- Schuler GD, Boguski MS, Stewart EA, Stein LD, Gyapay G, Rice K, White RE, Rodriguez-Tome P, Aggarwal A, Bajorek E, et al. A gene map of the human genome. Science. 1996;274:540–546. [PubMed] [Google Scholar]
- Simmons AD, Goodart SA, Gallardo TD, Overhauser J, Lovett M. Five novel genes from the cri-du-chat critical region isolated by direct selection. Hum Mol Genet. 1995;4:295–302. doi: 10.1093/hmg/4.2.295. [DOI] [PubMed] [Google Scholar]
- Simmons AD, Overhauser J, Lovett M. Isolation of cDNAs from the cri-du-chat critical region by direct screening of a chromosome 5-specific cDNA library. Genome Res. 1997;7:118–127. doi: 10.1101/gr.7.2.118. [DOI] [PubMed] [Google Scholar]
- Stanford Human Genome Center, Stanford University, Stanford, CA. 1996.: http://www-shgc.stanford.edu/
- Tunnacliffe A, Liu L, Moore JK, Leversha MA, Jackson MS, Papi L, Ferguson-Smith MA, Thiesen HJ, Ponder BA. Duplicated KOX zinc finger gene clusters flank the centromere of human chromosome 10: Evidence for a pericentric inversion during primate evolution. Nucleic Acids Res. 1993;21:1409–1417. doi: 10.1093/nar/21.6.1409. [DOI] [PMC free article] [PubMed] [Google Scholar]
- Venter JG, Adams MD, Sutton GG, Kerlavage AR, Smith HO, Hunka piller M. Shotgun Sequencing of the Human Genome. Science. 1998;280:1540–1542. doi: 10.1126/science.280.5369.1540. [DOI] [PubMed] [Google Scholar]
- Whitehead Institute for Biomedical Research, MIT Center for Genome Research Cambridge, MA, 1996.: http://www-genome.wi.mit.edu/cgi-bin/contig/phys_map