

Abstract
To assess the level of heterozygosity within two commonly used inbred mapping zebrafish strains, C32 and SJD, we genotyped polymorphic CA-repeat markers randomly dispersed throughout the zebrafish genome. (For clarity purposes we will primarily use the term polymorphic to define polymorphism between strains, and the term heterozygous to address heterogeneity within a strain.) Eight male individuals each from C32 and SJD stocks were typed for 235 and 183 markers, respectively. Over 90% of the markers typed were polymorphic between these two strains. We found a limited number of heterozygous markers persisting in clusters within each inbred line. In the SJD strain, these were mainly limited to a few telomeric regions or regions otherwise distant from centromeres. As expected, centromeric regions were homozygous in the SJD strain, consistent with its derivation from a single half-tetrad individual. In contrast, heterozygous clusters were distributed randomly throughout the genome in the C32 strain, and these clusters could be detected with linked polymorphic markers. Nevertheless, most regions of the C32 strain are homozygous for CA-repeat markers in current stocks. This identification of the heterozygous regions within C32 and SJD lines should permit rapid fixation of these remaining regions in future generations of inbreeding. In addition, we established levels of polymorphism between the inbred, C32 and SJD, strains and three other commonly used strains, the *AB, WIK, and Florida wild type (hereafter referred as EKK), with CA-repeat markers as well as SSCP polymorphisms. These data will maximize the use of these strains in mapping experiments.
Genetically uniform animals have proven to be a valuable tool for research involving both fruit flies, worms, and mice (for review, see Quillet et al. 1991). Clonal laboratory strains that have been used in generation of the zebrafish genetic maps are also ideal reagents for performing mutagenesis and maintaining stocks (Postlethwait et al. 1994; Johnson et al. 1996). The C32 clonal strain was established by Streisinger and colleagues in 1978 (Streisinger et al. 1981). In the years prior to 1991, C32 stocks were maintained by mass mating, with gametes from multiple individuals, to produce successive generations. Beginning in 1991, the C32 isolate used in this study was maintained by six generations of sib matings, prior to this analysis. Another inbred line, designated SJD, was established by sequential early pressure (EP) parthenogenesis (Johnson et al. 1996). Following EP generations, SJD stocks were maintained by six generations of full-sib matings, prior to this analysis.
In 1995, Buth et al. assayed the homogeneity of the C32 strain by allozyme expression. Overall, 38 loci were analyzed and only one locus, malate dehydrogenase (sMdh-A), was found to be heterozygous in C32 fish (Buth et al. 1995). Despite the small size of the sample, they concluded that mutation was the likely source of heterogeneity. This implies that the sMdh-A locus or C32, in general, have high mutation rates. Another explanation for the observed variation in the C32 strain is contamination from other zebrafish stocks. Following multiple generation of inbreeding, most introduced polymorphisms would be fixed in stocks. The remaining regions of persistent heterogeneity can be identified by clustering of polymorphic markers.
Here, we analyzed 235 polymorphic CA-repeat markers in fish of the C32 strain and 183 markers in SJD fish. We conclude that the majority of loci in current stocks of C32 and SJD strains are homozygous. The heterozygous markers we did see were confined to distinct clusters in both strains, rather than isolated loci. However, the size of these regions was small, and such regions could be detected with closely linked markers. We also analyzed the degree of polymorphism between inbred strains, C32 and SJD, and other commonly used zebrafish strains, *AB, WIK, and EKK. We found that the SJD strain exhibited the highest degree of polymorphism, >75%, with all other strains genotyped, whereas the C32 strain was found highly polymorphic with the SJD and WIK strains, but not with the *AB and EKK strains.
RESULTS
Analysis of Heterogeneity in the C32 and SJD Strains
Eight male C32 and eight male SJD individuals were selected for genotyping. In total, we used 264 CA-repeat markers for the C32 strain and 203 markers for the SJD strain (Goff et al. 1992; Knapik et al. 1996, 1998; Shimoda et al. 1999), from which we were able to unambiguously score 235 in the C32 strain and 183 in the SJD strain (Fig. 1). If markers were spaced less than a centiMorgan apart according to current genetic maps (Knapik et al. 1998; Shimoda et al. 1999), we considered them as a single locus. Therefore, 235 markers typed in the C32 strain represent 223 loci and 183 markers typed in the SJD strain represent 172 loci. The loci we genotyped were largely dispersed randomly throughout the genome, spaced an average distance of 10 and 13 cM apart for the C32 and SJD strains, respectively. The largest interval between typed markers was 56 cM on linkage group (LG) 21.
Figure 1.
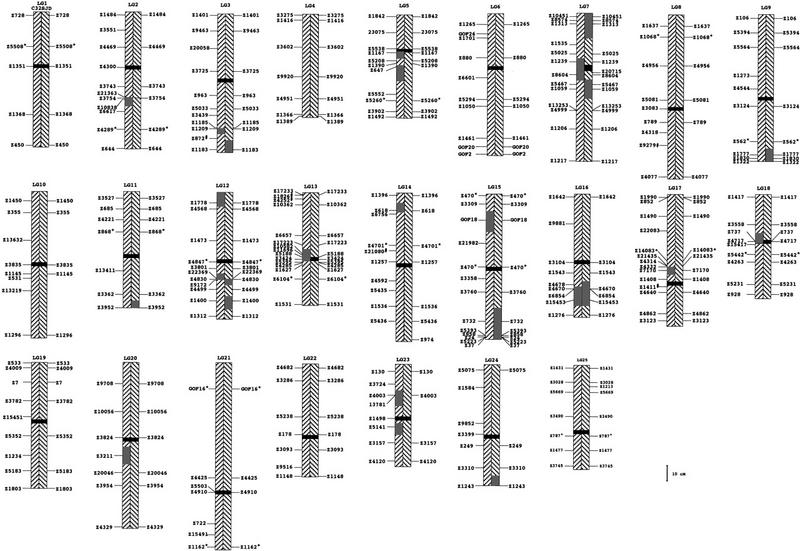
Heterozygosity data for the C32 and SJD strains. Marker positions derived from Knapik et al. (1998) and Shimoda et al. (1999). Centromere positions are from those determined by Johnson et al. (1996), with markers genotyped on both panels. The relationship of markers on LG 4 to its centromere has not been determined. The left forward hatched rectangles indicate homozygous regions in the C32 strain and the right backward hatched regions indicate homozygous regions in the SJD strains. Centromeres are depicted as solid black rectangles. The heterozygous regions in both strains are shown in gray. The extent of these regions is given as a midpoint between a heterozygous marker and the next adjacent tested maker that was not polymorphic. Markers that did not amplify an SJD allele, but amplify in the C32 strain are designated by #. If a C32 allele was equal in size to the SJD allele, the marker is denoted by an asterisk (*). Sizes of bands were estimated from acrylamide and agarose gels (see Table 1).
After an initial screening of 96 markers, we assayed another 168 for the C32 strain and 107 for the SJD strain, most of which were chosen to fill gaps or to test the extent of polymorphism in the heterogeneous regions. The approximate size of the C32 and SJD alleles are displayed in Table 1. The map positions and regions of heterogeneity are shown in Figure 1.
Table 1.
Allele Sizes of Markers Used in the Genotyping of the C32 and SJD Strains
| Marker name | Linkage group | Size of C32 allele | Size of SJD allele | Marker name | Linkage group | Size of C32 allele | Size of SJD allele | Marker name | Linkage group | Size of C32 allele | Size of SJD allele |
|---|---|---|---|---|---|---|---|---|---|---|---|
| Z1351 | 1 | 200 | 180 | Z1273 | 9 | 130 | Z1276 | 16 | 300 | 270, 302 | |
| Z1368 | 1 | 110 | 112 | Z1322 | 9 | 320 | 240, 300 | Z15453 | 16 | 215, 225 | 200, 210 |
| Z450 | 1 | 150 | 158 | Z1777 | 9 | 200 | 218, 222 | Z6854 | 16 | 165 | 180 |
| Z5508 | 1 | 200 | 200 | Z1830 | 9 | 160 | 160, 168 | Z1408 | 17 | 100 | 250 |
| Z728 | 1 | 210 | 208 | Z3124 | 9 | 140 | 150 | Z14083 | 17 | 210 | 210 |
| Z10838 | 2 | 205, 225 | Z4544 | 9 | 160 | Z1411a | 17 | 150 | |||
| Z1484 | 2 | 210, 209 | 196 | Z5394 | 9 | 100 | 140 | Z1490 | 17 | 130 | 120 |
| Z21363 | 2 | 2100 | Z5564 | 9 | 250 | 260 | Z1990 | 17 | 190 | 180 | |
| Z3551 | 2 | 240 | Z562 | 9 | 200 | 200 | Z21435 | 17 | 300 | 310 | |
| Z3743 | 2 | 220 | 216 | Z1145 | 10 | 210 | 199, 204 | Z22083 | 17 | 210 | |
| Z3754 | 2 | 130, 134 | 150 | Z1296 | 10 | 280 | 310 | Z3123 | 17 | 140 | 160 |
| Z4289 | 2 | 250 | 250 | Z13219 | 10 | 190 | Z4314 | 17 | 250 | ||
| Z4300 | 2 | 175 | Z13632 | 10 | 275 | Z4332 | 17 | 190, 210 | |||
| Z4469 | 2 | 140 | 165 | Z1450 | 10 | 260 | 240 | Z4640 | 17 | 170 | 156 |
| Z644 | 2 | 160 | 154 | Z355 | 10 | 255 | 250 | Z4862 | 17 | 200 | 206 |
| Z6617 | 2 | 115 | Z3835 | 10 | 150 | 200 | Z7170 | 17 | 150, 200 | 220 | |
| Z1183 | 3 | 130, 140 | Z531 | 10 | 110 | Z852 | 17 | 250 | 244 | ||
| Z1185 | 3 | 140 | 136 | Z13411 | 11 | 240 | Z1417 | 18 | 160 | 140 | |
| Z1209 | 3 | 152, 160 | 150 | Z3362 | 11 | 160 | 180 | Z15417 | 18 | 110 | |
| Z1401 | 3 | 190 | 150 | Z3527 | 11 | 170 | 200 | Z3558 | 18 | 250 | 230 |
| Z20058 | 3 | 110 | Z3952 | 11 | 145 | 157, 165 | Z4263 | 18 | 320 | 318 | |
| Z3439 | 3 | 100 | Z4221 | 11 | 200 | Z4717 | 18 | 218, 200 | 218 | ||
| Z3725 | 3 | 280 | 300 | Z685 | 11 | 200 | Z5231 | 18 | 180 | 170 | |
| Z5033 | 3 | 260 | 240 | Z868 | 11 | 120 | 120 | Z5442 | 18 | 150 | 150 |
| Z872a | 3 | 220 | Z1312 | 12 | 100 | 115 | Z737 | 18 | 160, 168 | 150 | |
| Z9463 | 3 | 170 | 180 | Z1400 | 12 | 110 | 106, 118 | Z928 | 18 | 120 | 130 |
| Z963 | 3 | 200 | 202 | Z1473 | 12 | 150 | 120 | Z1234 | 19 | 130 | |
| Z1366 | 4 | 130 | 150 | Z1778 | 12 | 170, 200 | 180 | Z15451 | 19 | 120 | 170 |
| Z1389 | 4 | 180 | 150 | Z22369 | 12 | 205 | 200 | Z1803 | 19 | 190 | 200 |
| Z1416 | 4 | 150 | 142 | Z3801 | 12 | 195 | 180 | Z3782 | 19 | 120 | 170 |
| Z3275 | 4 | 290 | 300 | Z4499 | 12 | 250 | 252 | Z4009 | 19 | 300 | 260 |
| Z3602 | 4 | 90 | 110 | Z4568 | 12 | 170 | 180 | Z5183 | 19 | 150 | 154 |
| Z4951 | 4 | 240 | 250 | Z4830 | 12 | 190, 198 | 190, 198 | Z533 | 19 | 200 | 194 |
| Z9920 | 4 | 100 | Z4847 | 12 | 130 | 130 | Z5352 | 19 | 150 | 1154 | |
| Z1167 | 5 | 186, 190 | 184 | Z9172 | 12 | 120 | Z7 | 19 | 144 | 140 | |
| Z1390 | 5 | 150 | 165 | Z10362 | 13 | 180 | 174 | Z10056 | 20 | 195 | 180 |
| Z1492 | 5 | 200 | 192 | Z10582 | 13 | 210, 230 | Z20046 | 20 | 170 | 180 | |
| Z1842 | 5 | 200 | 150 | Z11696 | 13 | 194, 200 | Z3211 | 20 | 120, 135 | ||
| Z23075 | 5 | 188 | 190 | Z1531 | 13 | 200 | 140 | Z3824 | 20 | 230 | 270 |
| Z3902 | 5 | 230 | 215 | Z1627 | 13 | 270 | 240 | Z3954 | 20 | 255 | 175 |
| Z2499 | 5 | 290, 310 | 290, 310 | Z17223 | 13 | 180 | 200 | Z4329 | 20 | 150 | 160 |
| Z5208 | 5 | 350 | 360 | Z17223 | 13 | 150 | 190 | Z9708 | 20 | 230 | 220 |
| Z5260 | 5 | 230 | 230 | Z1826a | 13 | 150 | GOF16 | 21 | 200 | 200 | |
| Z5538 | 5 | 250 | 320 | Z4252a | 13 | 140 | Z1162 | 21 | 130 | 130 | |
| Z5552 | 5 | 180 | Z4285 | 13 | 130 | 140 | Z15491 | 21 | 190 | ||
| Z647 | 5 | 190, 200 | Z5188 | 13 | 120, 130, 210 | 120 | Z4425 | 21 | 150 | 130 | |
| GOF2 | 6 | 185 | 165 | Z5395 | 13 | 200 | 170 | Z4910 | 21 | 180 | 186 |
| GOF20 | 6 | 250 | 270 | Z6104 | 13 | 150 | 150 | Z5503 | 21 | 220 | |
| GOF26 | 6 | 190 | Z6657 | 13 | 180 | 184 | Z722 | 21 | 100 | ||
| Z1050 | 6 | 130 | 150 | ZZ3424 | 13 | 190, 210 | 250 | Z1148 | 22 | 210 | 230 |
| Z1265 | 6 | 110 | 100 | Z1257 | 14 | 150 | 140 | Z178 | 22 | 110 | |
| Z1461 | 6 | 122 | Z1396 | 14 | 150 | 135, 150 | Z3093 | 22 | 150 | 180 | |
| Z1701 | 6 | 1701 | Z1536 | 14 | 220 | 200 | Z3286 | 22 | 104 | 100 | |
| Z5294 | 6 | 350 | 348 | Z21080a | 14 | 250 | Z4682 | 22 | 270 | 268 | |
| Z6601 | 6 | 140 | Z4592 | 14 | 135 | Z5238 | 22 | 220 | 222 | ||
| Z880 | 6 | 150 | 152 | Z4701 | 14 | 250 | 250 | Z9516 | 22 | 200 | |
| Z10451 | 7 | 210 | 218, 232 | Z5435 | 14 | 130 | Z130 | 23 | 100 | 110 | |
| Z1059 | 7 | 180 | 180, 184 | Z5436 | 14 | 100 | 85 | Z13781 | 23 | 270, 290 | |
| Z1206 | 7 | 140 | 160 | Z618 | 14 | 118, 120 | 150 | Z1498 | 23 | 180 | |
| Z1217 | 7 | 208 | 200 | Z6756 | 14 | 200 | Z3157 | 23 | 130 | 110 | |
| Z1239 | 7 | 200, 260 | 240 | Z974 | 14 | 190 | 200 | Z3724 | 23 | 130 | |
| Z1313 | 7 | 160 | 130, 166 | Z21982 | 15 | 200 | Z4003 | 23 | 242, 250, 270 | 242 | |
| Z13253 | 7 | 180 | 176 | Z24 | 15 | 150 | 120, 144 | Z4120 | 23 | 160 | 150 |
| Z1535 | 7 | 110 | Z3309 | 15 | 100 | 150 | Z5141 | 23 | 100, 112 | ||
| Z20715 | 7 | 130 | Z3358 | 15 | 200 | Z1243 | 24 | 210 | 202, 26 | ||
| Z4999 | 7 | 180 | 200 | Z37 | 15 | 110 | 104, 106 | Z1584 | 24 | 190 | |
| Z5025 | 7 | 214, 220 | 214 | Z3760 | 15 | 100 | 160 | Z249 | 24 | 160 | 150 |
| Z5467 | 7 | 290 | 220, 300 | Z470 | 15 | 130 | 130 | Z3310 | 24 | 150 | 170 |
| Z8574 | 7 | 210 | 200, 210 | Z5223 | 15 | 180 | 220, 260 | Z3399 | 24 | 290 | |
| Z8604 | 7 | 140 | Z5393 | 15 | 225 | 211, 215 | Z5075 | 24 | 220 | 200 | |
| Z1068 | 8 | 120 | 120 | Z732 | 15 | 140 | 110, 134 | Z9852 | 24 | 280 | |
| Z1637 | 8 | 160 | 140 | Z858 | 15 | 290 | 310, 330 | Z1213 | 25 | 130 | |
| Z3083 | 8 | 110 | ZGOF18 | 15 | 180, 190 | 170 | Z1431 | 25 | 150 | 200 | |
| Z4077 | 8 | 270 | 270 | Z1543 | 16 | 150 | Z1477 | 25 | 190 | ||
| Z4318 | 8 | 150 | Z1642 | 16 | 220 | 240 | Z3028 | 25 | 250 | 240 | |
| Z4956 | 8 | 260 | 262 | Z3104 | 16 | 230 | 250 | Z3490 | 25 | 120 | 150 |
| Z5081 | 8 | 230 | 210 | Z4670 | 16 | 140, 150 | 140, 150 | Z3745 | 25 | 130, 150, 154 | 130, 154 |
| Z789 | 8 | 205 | Z4678 | 16 | 200 | Z5669 | 25 | 260 | 250 | ||
| Z9279a | 8 | 150 | Z9891 | 16 | 150 | Z787 | 25 | 120 | 120 | ||
| Z106 | 9 | 200 | 202 |
Markers that did not amplify an SJD allele but amplified in the C32 strain.
We found that most regions in the genome were homozygous in both C32 and SJD strains. The heterozygous regions appeared randomly dispersed in the C32 strain and could be found in the centromeric regions as well as in the regions close to the telomeres. For example, two centromeric markers, Z737 and Z4717, were heterozygous on LG 18 (Fig. 1); at the same time, telomeric markers Z618 and GOF18 were heterozygous on linkage groups 14 and 15, respectively (Fig. 1; Table 1). In contrast, we found that heterogeneous regions in the SJD strain were confined to the ends of the chromosomes and regions distant from the centromeres (e.g., see markers Z3952, Z4830, Z732, and 1243 on linkage groups 11, 12, 15, and 24, respectively, Fig. 1; Table 1). This is consistent with the fact that the SJD strain originated from a single half-tetrad animal. An example of heterogeneity and genotype segregation in the SJD strain is shown in Figure 2A and B. Only one SJD heterozygous region, on LG7, was exceptionally close to its centromere (Fig. 1).
Figure 2.
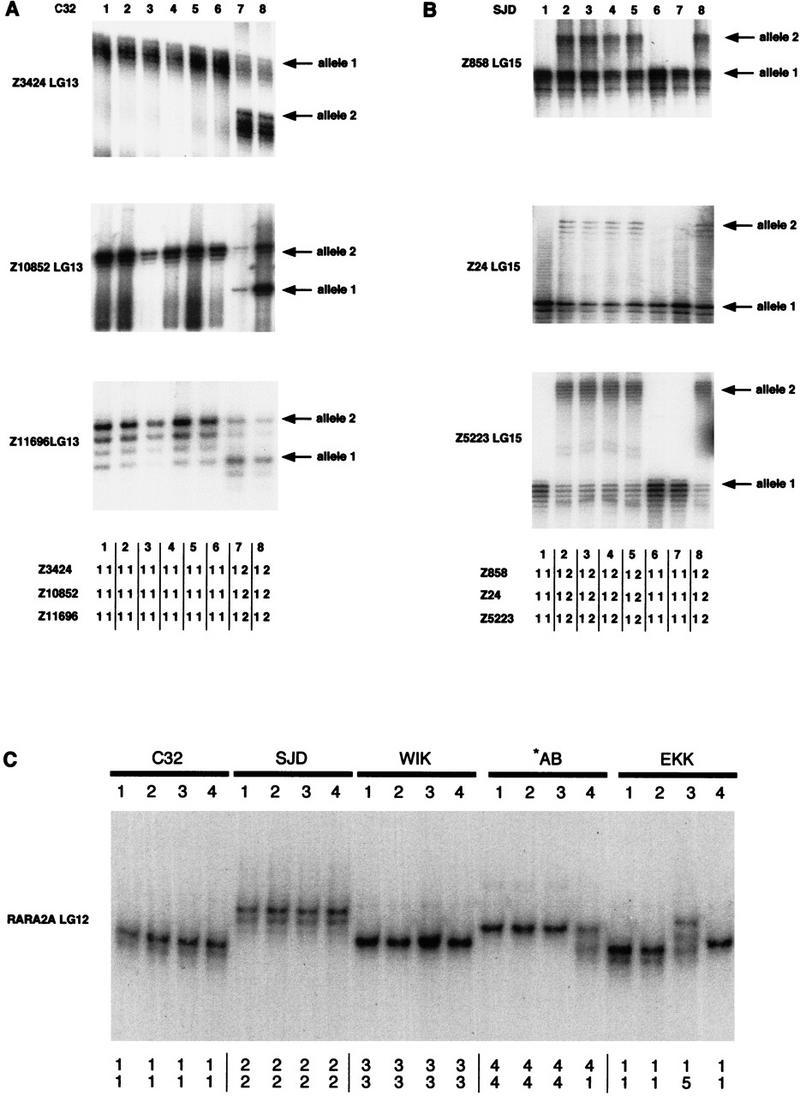
Examples of polymorphisms scored in the C32, SJD, *AB, WIK, and EKK individuals. (A) acrylamide gel data for markers Z3424, Z10852, and Z11696 on LG 13 heterozygous in the C32 strains and reconstructed genotypes for these heterozygous markers; (B) acrylamide gel data for markers Z858, Z24, and Z5223 on LG 15 and reconstructed genotypes for these heterozygous markers; (C) acrylamide gel data for SSCP marker rara2a in the C32, SJD, WIK, *AB, and EKK strains with alleles scored underneath.
For a number of cases, we assayed additional markers in the regions that were heterozygous within both strains. We hypothesized that if such regions in the C32 strain originated from contamination by another stock, then we would find additional linked markers segregating with heterozygous genotypes. Heterozygous markers detected within the C32 strain are clustered in regions on linkage groups 2, 12, 13, 16, 18, and 23. For example, the C32 heterozygous genotypes segregating for markers Z3424, Z10852, and Z11696 (LG 13) are shown in Figure 2A.
Because most of the markers used in this study were randomly dispersed throughout the zebrafish genome (except for a small number of markers that were used to define the extent of the heterozygous regions), the number of heterozygous regions within each strain reflects the heterogeneity of a strain. As the number of loci typed were 223 and 172 in the C32 and SJD strains, respectively, and the number of heterozygous loci are 20 and 18 in the C32 and SJD strains, respectively, we estimate that ∼91% of the genome is homozygous in the C32 strain, whereas the SJD strain is homozygous throughout ∼90% of its genome.
Three heterozygous loci were shared by both strains. One region on LG 12 extends through marker Z4830. Another heterozygous cluster shared by the C32 and SJD strains extends through markers Z4670, Z6854, and Z15453 on LG16. Our findings are well within expectations taken that heterozygous clusters distributed randomly in both strains. In this case, we expect ∼1%, or two loci to be shared by both strains [(20/223 * 18/172) * 100% = 1% or approximately two loci].
Analysis of Polymorphism Between Zebrafish Strains
To compare polymorphism levels between different strains, we genotyped 4 individuals from the C32, SJD, *AB, WIK, and EKK strains with 73 CA-repeat markers and 40 SSCP markers (Gates et al. 1999; Shimoda et al. 1999). Two telomeric and one centromeric CA-repeat markers per chromosome were selected for genotyping. For single-strand conformation polymorphism (SSCP) analysis, we randomly selected 50 markers (2 per each linkage group), of which 40 were scored unambiguously (Fig. 2C). All SSCP markers derived from the 3′-UTR of either known genes or ESTs that were mapped previously (Gates et al. 1999). To quantify levels of polymorphism between strains, we used polymorphism index (PI) (see Methods section for details). We calculated PI for each individual marker, and then averaged PIs for all CA-repeat or SSCP markers in each strain. Polymorphism indices determined from the CA-repeats genotyping data differ significantly from the SSCP genotyping data in 6 of 10 pairwise comparisons (data sets were compared with one-sided two-sample t-test) (Table 2). In these cases, PIs derived from SSCP data were ∼10% lower compared with PIs derived from CA-repeat markers. We suspect that the overall sensitivity of SSCP detection, 50%–90%, could account for these significant differences (Sheffield et al. 1993).
Table 2.
Degree of Polymorphism Between Different Zebrafish Strains
| C32 | SJD | *AB | WIK | |
|---|---|---|---|---|
| 0.97 | ||||
| SJD | t = 1.881 (P < 0.03) | — | — | — |
| 0.87 | ||||
| 0.53 | 0.92 | |||
| *AB | t = 0.354 (P < 0.36) | t = 2.205 (P < 0.02) | — | — |
| 0.51 | 0.80 | |||
| 0.73 | 0.86 | 0.77 | ||
| WIK | t = 0.297 (P < 0.38) | t = 1.565 (P < 0.06) | t = 1.872 (P < 0.03) | — |
| 0.71 | 0.77 | 0.68 | ||
| 0.55 | 0.86 | 0.58 | 0.81 | |
| EKK | t = 0.219 (P < 0.41) | t = 1.843 (P < 0.04) | t = 0.169 (P < 0.43) | t = 3.146 (P < 0.001) |
| 0.54 | 0.77 | 0.57 | 0.71 |
Average polymorphism indices derived from the analysis of CA-repeat markers indicated at the top of each cell. The bottom number in each cell indicates an average polymorphism index derived from the analysis of SSCP markers. Significance of the differences were compared using one-sided two-sample t-test. See methods section for calculations of polymorphism indices.
The SJD strain was found to be the most polymorphic with all other four strains analyzed (PI = at least 0.75 for all strains) (Table 2). We found the SJD strain to be mostly polymorphic with the C32 strain (PI = 0.97 if analyzed with CA-repeat markers, and PI = 0.87 if analyzed with SSCP markers). The C32 strain, on the other hand, was moderately polymorphic with the WIK strain (average PI = 0.73 and PI = 0.71 for the CA-repeats and SSCP markers, respectively). It was only ∼50% polymorphic with the *AB and EKK strains. Among the three noninbred strains, *AB, WIK, and EKK, the most polymorphism was found between WIK and *AB (average PI = 0.77 and PI = 0.68 for the CA-repeats and SSCP markers, respectively), and WIK and EKK (average PI = 0.81 and PI = 0.71 for the CA-repeats and SSCP markers, respectively).
DISCUSSION
After analysis of 223 loci in the C32 strain and 172 loci in the SJD strain randomly dispersed throughout the zebrafish genome, we concluded that C32 and SJD strains each have limited heterogeneity. A total of 91% of the genome is homozygous in the C32 strain, whereas 90% of the genome is homozygous in the SJD strain.
Although the C32 strain was originally constructed by a heat-shock method, which yields fish from single haploid gametes, we identified a number of heterozygous genomic regions. These regions are small and can be detected by tightly linked polymorphic markers. For example, the marker cluster Z10582, Z11696, Z3424, and Z5188 on LG 13 is heterozygous within the C32 strain. This heterozygous region is bounded above by Z17223 and below by Z5395. Thus, the genetic distance of this heterozygous region is ∼7 cM. Because heterozygous C32 markers were grouped in regions rather than randomly distributed throughout the genome, we infer that most heterogeneity in the C32 strain is due to an old strain contamination, rather than random mutations. Subsequent generations of inbreeding presumably fixed the alleles at most loci.
Heterogeneous regions in the SJD strain were confined to the ends of the chromosomes and regions distant to the centromeres, rather then dispersed randomly throughout the genome. This is consistent with the fact that the SJD line was derived by two sequential rounds of parthenogenesis. Because this strategy resulted in a line derived from a single meiotic half-tetrad, alleles near the centromere tend to be fixed more often than at telomeric loci. Subsequent generations of full-sib matings presumably helped fix alleles in more distal regions. By utilizing markers known to be heterozygous in existing strains, we can select for the most homozygous animals in future matings to increase the efficiency of inbreeding. This should maximize the effectiveness of these animals in mapping experiments and stock maintenance.
Another valuable asset of the SJD strain is its high degree of polymorphism with all strains used in this study, most prominently as compared with the C32 strain (PI = 0.97 and 0.87 for the CA-repeat markers and SSCP markers, respectively). In addition, we found that the C32 strain is ∼70% polymorphic with the WIK strain. Among noninbred strains, a high degree of polymorphism was found between the *AB and WIK strains, as well as between the WIK and EKK strains (Table 2). The degree of polymorphism between strains can be inferred from the origin and maintenance of the strains. The original University of Oregon stocks that were used to make the AB line, and its derivatives, *AB and C32, were purchased from United States pet stores, fish were typically acquired from farms in Florida. Presumably, this explains the low degree of polymorphism we observe between *AB, C32, and EKK, a more recent acquisition from the Florida zebrafish trade. In contrast, SJD and WIK are derived from recent acquisitions from the wild (Johnson and Zon 1999). Because the zebrafish is native to numerous watersheds throughout much of India and southeast Asia, it is not surprising that SJD and WIK show a high degree of polymorphism with respect to each other and with respect to *AB, C32, and EKK. Our interstrain polymorphism results are in good agreement with those reported by Knapik et al. (1998). Using CA-repeat markers, they determined 48%, 82%, and 78% heterozygosity rates for AB×EKK, AB×IN, and EKK×IN pairs, respectively (compare with 58%, 77%, and 81% polymorphism rates for *AB×EKK, *AB×WIK, and EKK×WIK, respectively, derived in this study). The differences in the genetic makeup of IN and WIK, and AB and *AB may account for the subtle variations in polymorphism rates determined in this study and by Knapik et al. (1998).
We found significant statistical deviations between the PIs derived from the analysis of CA-repeat markers and those derived from the SSCP markers (Table 2). Overall, we made 10 pairwise comparisons and, in 6 cases, we found significant differences between average PIs (p values range from 0.06 to 0.001). In the remaining four cases, the PIs derived from SSCP analysis were always lower, but the differences were not significant. The above variations may be attributed to the overall sensitivity of the SSCP technique. In 1993, Sheffield et al. reported that the SSCP sensitivity could vary widely from as high as 97% to as low as 3% depending on the size of PCR product. The greatest sensitivity was seen when using ∼150-bp PCR fragments. The sensitivity substantially dropped with either increased or decreased size of PCR products. The average size of SSCP markers used in this study is ∼300 bp. The expected reported sensitivity for this size is ∼50%–75% (Sheffield et al. 1993).
In summary, we found that most regions in both inbred strains, C32 and SJD, are homozygous. Our identification of rare heterozygous regions in these strains will help to increase the efficiency of inbreeding. The C32 and SJD strains were found highly polymorphic compared with other widely used strains, which should maximize usefulness of the C32 and SJD stocks in standard mapping experiments.
METHODS
Fish Stocks
C32 strain is derived from Streisenger's clone (Streisinger et al. 1981). Prior to 1991, C32 strain was passaged generation to generation with gametes from multiple individuals. Presumably, such mass matings may have allowed for a single contaminating individual to contribute heterogeneity to the stock. Since 1991, an isolate has been maintained by inbreeding strategies, typically a single full-sib pair was used to propagate the strain from generation to generation. This mating scheme would tend to restore homozygosity at most loci. SJD strain was derived from the India or Darjeeling line, a recent isolate from wild. The scheme followed to inbreed SJD was two generations of full sib matings, followed by two sequential generations of Early Pressure half-tetrad parthenogenesis. Using two sequential generations of half-tetrads ensures that all subsequent animals in the strain are derived from a single meiotic half-tetrad, homozygous at each centromere. Following the EP generations, stocks were maintained by a further five generations of full-sib mating to further inbreed stocks, before assays of heterozygosity shown here.
*AB and WIK strains were kindly provided by David Grunwald (University of Utah, Salt Lake City) and then further maintained by a random mating within each strain. Origination of these strains were described elsewhere (Johnson and Zon 1999). The Florida wild-type strain or EKK was purchased from EKK Will Waterlife (Gibsonton, FL).
PCR Amplification of CA-Repeat and SSCP Markers
Forward primer of a pair was end-labeled at the 5′ end with [γ-32P]ATP and utilized in PCR reactions according to the published conditions (Knapik et al. 1998). PCR products were separated by electrophoresis through 6% polyacrylamide gels. Gels were dried and exposed to film for 2–24 hr at room temperature.
SSCP PCR reactions were performed as described elsewhere (Gates et al. 1999). PCR products were loaded on 5% (39:1 acrylamide/bisacrylamide) nondenaturing gels and run at 40W at 4°C for 2–3 hr, transferred to Whatman filter paper, dried, and exposed to film overnight. In addition, samples that were not possible to score from the SSCP acrylamide gels were rerun on 10% MDE (FMC Bioproducts) gels overnight at 500–800 volts, depending on the size of the products, transferred to Whatman filter paper, dried, and exposed to film overnight.
Statistical Analysis
To make a quantitative assessment of polymorphism, we introduced polymorphism index (PI). For a particular marker, PI between two strains, A and B, is calculated as follows:
 |
in which i = 1, 2, … , s alleles shared in both strains; qAi is the frequency of the ith allele in strain A; qBi is the frequency of the ith allele in strain B; lAi is the number of alleles i in strain A; lBi is the number of alleles i in strain B; and, finally, n is the total number of individuals analyzed. Because the true allele frequencies for markers used in this study are unknown, we gave equal weight to every allele. Then, the above formula simply reduced to the following:
 |
in which kAi is number of different alleles observed in strain A and kBi is the number of different alleles observed in strain B. For example, the PI for the SSCP marker rara2a (Fig. 2C) between the *AB and EKK strains was calculated as follows:
 |
 |
Average PIs calculated for the same strain from either the CA repeats or SSCP analysis were compared by a one-sided two-sample t-test. The hypothesis tested was as follows: H0: uA = uB and H1: uA ≠ uB, H0 rejected if α>0.05. All calculations were performed in Microsoft Excel 98.
Acknowledgments
We thank Jennifer Sheppard for fish care and maintenance. This work was supported by an award from Bristol-Meyers Squibb (M.T.K), National Institutes of Health (NIH) Developmental Biology Training Grant 5T32 HD07491(A.N.), and NIH DK5379 (S.L J.).
The publication costs of this article were defrayed in part by payment of page charges. This article must therefore be hereby marked “advertisement” in accordance with 18 USC section 1734 solely to indicate this fact.
Footnotes
E-MAIL alexn@howard.genetics.utah.edu; FAX (801) 585-7423.
REFERENCES
- Buth DG, Gordon MS, Plaut I, Drill SL, Adams LG. Genetic heterogeneity in isogenic homozygous clonal zebrafish. Proc Natl Acad Sci. 1995;92:12367–12369. doi: 10.1073/pnas.92.26.12367. [DOI] [PMC free article] [PubMed] [Google Scholar]
- Gates MA, Kim L, Egan ES, Cardozo T, Sirotkin HI, Dougan ST, Lashkari D, Abagyan R, Schier AF, Talbot WS. A genetic linkage map for zebrafish: Comparative analysis and localization of genes and expressed sequences. Genome Res. 1999;9:348–359. [PubMed] [Google Scholar]
- Goff DJ, Galvin K, Katz H, Westerfield M, Lander ES, Tabin CJ. Identification of polymorphic simple sequence repeats in the genome of the zebrafish. Genomics. 1992;14:200–202. doi: 10.1016/s0888-7543(05)80309-x. [DOI] [PubMed] [Google Scholar]
- Johnson SL, Zon LI. Genetic backgrounds and some standard stocks and strains used in zebrafish developmental biology and genetics. Methods Cell Biol. 1999;60:357–359. doi: 10.1016/s0091-679x(08)61910-x. [DOI] [PubMed] [Google Scholar]
- Johnson SL, Gates MA, Johnson M, Talbot WS, Horne S, Baik K, Rude S, Wong JR, Postlethwait JH. Centromere-linkage analysis and consolidation of the zebrafish linkage maps. Genetics. 1996;142:1277–1288. doi: 10.1093/genetics/142.4.1277. [DOI] [PMC free article] [PubMed] [Google Scholar]
- Knapik EW, Goodman A, Atkinson OS, Roberts CT, Shiozawa M, Sim CU, Weksler-Zangen S, Trolliet MR, Futrell C, Innes BA, et al. A reference cross DNA panel for zebrafish (Danio rerio) anchored with simple sequence length polymorphisms. Development. 1996;123:451–460. doi: 10.1242/dev.123.1.451. [DOI] [PubMed] [Google Scholar]
- Knapik EW, Goodman A, Ekker M, Chevrette M, Delgado J, Neuhauss S, Shimoda N, Driever W, Fishman MC, Jacob HJ. A microsattelite linkage map for zebrafish (Danio rerio) Nat Genet. 1998;18:338–343. doi: 10.1038/ng0498-338. [DOI] [PubMed] [Google Scholar]
- Postlethwait JH, Johnson SL, Midson CN, Talbot WS, Gates M, Ballinger EW, Africa D, Andrews R, Carl T, Eisen JS, et al. A genetic linkage map for the zebrafish. Science. 1994;264:699–703. doi: 10.1126/science.8171321. [DOI] [PubMed] [Google Scholar]
- Quillet E, Garcia P, Guyomard R. Analysis of the production of all homozygous lines of rainbow trout by gynogenesis. J Exp Zool. 1991;257:367–374. [Google Scholar]
- Sheffield VC, Beck JS, Kwitek AE, Sandstrom DW, Stone EM. The sensitivity of single-strand conformation polymorphism analysis for the detection of single base substitutions. Genomics. 1993;16:325–332. doi: 10.1006/geno.1993.1193. [DOI] [PubMed] [Google Scholar]
- Shimoda N, Knapik EW, Ziniti J, Sim C, Yamada E, Kaplan S, Jackson D, de Sauvage F, Jacob H, Fishman MC. Zebrafish genetic map with 2000 microsatellite markers. Genomics. 1999;58:219–232. doi: 10.1006/geno.1999.5824. [DOI] [PubMed] [Google Scholar]
- Streisinger G, Walker C, Dower N, Knauber D, Singer F. Production of clones of homozygous diploid zebra fish (Brachydaniorerio) Nature. 1981;291:293–296. doi: 10.1038/291293a0. [DOI] [PubMed] [Google Scholar]