

Abstract
We present an independent comparative analysis of seven recently developed gene-finding programs: FGENES, GeneMark.hmm, Genie, Genscan, HMMgene, Morgan, and MZEF. For evaluation purposes we developed a new, thoroughly filtered, and biologically validated dataset of mammalian genomic sequences that does not overlap with the training sets of the programs analyzed. Our analysis shows that the new generation of programs has substantially better results than the programs analyzed in previous studies. The accuracy of the programs was also examined as a function of various sequence and prediction features, such as G + C content of the sequence, length and type of exons, signal type, and score of the exon prediction. This approach pinpoints the strengths and weaknesses of each individual program as well as those of computational gene-finding in general. The dataset used in this analysis (HMR195) as well as the tables with the complete results are available at http://www.cs.ubc.ca/∼rogic/evaluation/.
Currently, in genome centers around the world, millions of bases of genomic DNA from different organisms are sequenced every day. With the recently assembled draft sequence of the human genome in hand and the completed sequence to follow in a couple of years, we need to re-evaluate our methods for deciphering such an enormous amount of data.
We present here the results of a comprehensive evaluation of recent computer programs used for the identification of protein coding genes in eukaryotic genomic sequences. Because we expect that such an analysis will be of interest to both biologists and computer scientists, we will first provide an overview of gene structure and computational methods for gene-finding.
Gene Structure
The genes of most eukaryotic organisms are neither continuous nor contiguous. They are separated by long stretches of intergenic DNA and their coding sequences are interrupted by noncoding introns. Coding sequences occupy just a small fraction of a typical higher eukaryotic genome; the extreme example is the human genome, where an estimate of that fraction at 3% (Duret et al. 1995) was recently confirmed for chromosome 22 (Dunham et al. 1999). To obtain a continuous coding sequence which will be translated into a protein sequence, genes are transcribed into long pre-mRNA molecules that subsequently undergo complex processing to remove intronic sequences and assemble exons to form mRNA. However, assembly of the gene exons in the mature mRNA is not always the same; Mironov et al. (1999) found that at least 35% of human genes are alternatively spliced—having more than one possible exon assembly. The arrangement of genes in genomes is also prone to exceptions. Although usually separated with an intergenic region, there are examples of genes nested within each other (Dunham et al. 1999); that is, one gene located in an intron of another gene or overlapping genes on the same (Schulz and Butler 1989; Ashburner et al. 1999) or opposite (Cooper et al. 1998) DNA strands. The presence of pseudogenes (nonfunctional sequences resembling real genes) which are distributed in numerous copies throughout the genome further complicates the identification of true protein coding genes.
Regulatory regions play a crucial role in gene expression, and their identification is needed to fully comprehend a gene's function, activity, and role in cellular processes. The location of regulatory regions relative to their target gene is not uniquely determined; the basic regulatory elements, such as the TATA and CAT boxes, are usually found in the upstream proximity of the transcription start site, while the other elements such as enhancers and silencers, can be located in distant upstream and downstream regions of a gene and sometimes even within the introns of the gene.
This brief overview of genome organization and gene architecture highlights the complexity of gene identification in the sequences of uncharacterized DNA.
Computational Methods for Identification of Genes
There are several methods used for the experimental discovery of genes, but they are time-consuming and costly. Accordingly, for the last 15 years researchers have been developing computational methods for gene-finding that can automate, or facilitate, the identification of genes. Two basic approaches have been established for computational gene-finding: the sequence similarity search, or lookup (Fickett 1996), method and the integrated compositional and signal search, or template (Fickett 1996), method. The latter method is also commonly referred to as ab initio gene finding.
Sequence similarity search is a well-established computational method for gene discovery which has been used extensively with considerable success. It is based on sequence conservation due to the functional constraints and is used to search for regions of similarity between an uncharacterized sequence of interest and already characterized sequences in a public sequence database. Significant similarity between two sequences suggests that they are homologous, that is, they have common evolutionary origin. A query sequence can be compared with DNA, protein, or expressed sequence tag (EST) sequences or it can be searched for known sequence motifs. If a query sequence is found to be significantly similar to an already annotated sequence (DNA or protein), we can use the information from the annotated sequence to possibly infer gene structure or function of the query sequence. Comparison with an EST database can provide information if the sequence of interest is transcribed, that is, contains an expressed gene, but will only give incomplete clues about the structure of the whole gene or its function.
Although sequence similarity search has been proven useful in many cases, it has been shown that only a fraction of newly discovered sequences have identifiable homologs in the current databases (Oliver et al. 1992; Wilson et al. 1994; Dunham et al. 1999). Furthermore, Green et al. (1993) suggested that currently known proteins may already include representatives of most ancient conserved regions (ACRs, regions of protein sequences showing highly significant similarity across phyla) and that new sequences not similar to any database sequence are unlikely to contain ACRs. The proportion of vertebrate genes with no detectable similarity in other phyla is estimated to be ∼50% (Claverie 1997). This is supported by a recent analysis of human chromosome 22 (Dunham et al. 1999) where only 50% of the proteins are found to be similar to previously known proteins.
These results suggest that, even today, only one half of all new vertebrate genes may be discovered by sequence similarity search across phyla. Considering that a complete vertebrate genome is still not available and that the most prominent vertebrate organisms in GenBank (Benson et al. 2000), Homo sapiens, and Mus musculus, have only ∼25% and ∼0.6% of their genomes present in finished sequences, respectively (data from September 2000), it is obvious that sequence similarity search within vertebrates is currently limited. When more vertebrate sequences become available in GenBank (such as mouse, zebrafish, or pufferfish), matches within phyla will be more likely and this will facilitate the detection of genes coding for non-ACR-containing proteins.
The second computational approach for the prediction of genes structures in the genomic DNA sequences, termed the template approach, integrates coding statistics with signal detection into one framework. Coding statistics behave differently on coding and noncoding regions and they are measures indicative of protein coding functions. A number of these measures have been evaluated by Fickett and Tung (1992), and it has been concluded that the in-phase hexamer measure, which measures the frequency of occurrence of oligonucleotides of length six in a specific reading frame, is the most effective. Indeed, this measure was used successfully in many recently developed programs such as GeneMark.hmm (Lukashin and Borodovski 1998), Genscan (Burge 1997), and HMMgene (Krogh 1997). This coding statistic is usually implemented as a 5th-order hidden Markov model (HMM) (for a review of the theory of HMMs, see Rabiner 1989).
Signal sensors attempt to mimic closely processes occurring within the cell. They are intended to identify sequence signals, usually just several nucleotides-long subsequences, which are recognized by cell machinery and are initiators of certain processes. The signals that are usually modeled by gene-finding programs are promoter elements, start and stop codons, splice sites, and poly-A sites. Many different pattern recognition methods have been used as signal detectors, including simple consensus sequences, weight matrices, weight arrays, neural networks, and decision trees.
DNA sequence signals have low information content; they are usually degenerate and highly unspecific because it is almost impossible to distinguish the signals truly processed by the cell from those that are apparently nonfunctional. Therefore, signal sensors are not sufficient to elucidate gene structure, and it is necessary to combine them with coding statistics methods in order to obtain satisfactory predictive power.
Both codon statistics and signal models are “learned” from a training set: Frequencies of oligonucleotide occurrence in different regions of the genes are calculated from sequences in the training set, and the signal models are constructed using the alignment of the signal sequences from the training set.
There is also a group of programs that integrate a third component in their systems: similarity with an annotated sequence. Examples of such programs are GeneID+ (Guigo et al. 1992), GeneParser3 (Snyder and Stormo 1995), Procrustes (Gelfand et al. 1996), and AAT (Huang et al. 1997).
Existing gene-finding programs have been designed to identify simpler gene structure and then the intricate structure described above. Most of the programs, especially the older ones, are trained to identify just one gene in a sequence, rarely predicting any promoter elements. Some progress has been made with recently developed programs which are capable of identifying more complex genomic structure: any number of genes with either complete or partial structure. This is the case with Genie (Kulp et al. 1996), GeneMark.hmm, Genscan, and HMMgene. Still, regulatory regions and poly-A sites usually remain unidentified, 5′ and 3′ untranslated regions are not specified, alternative splice variants are not considered, and overlapping or nested genes are not detected. Nevertheless, the prediction of the coding sequence of typical genes is an important first step in deciphering the content of any genome, and the programs for gene-finding are used extensively for this task with considerable success.
An excellent Web resource for computational gene recognition, including the URLs of gene-finding programs and a comprehensive bibliography on gene recognition and related subjects, is maintained by Wentian Li at http://linkage.rockefeller.edu/wli/gene/.
Evaluation of Gene-Finders
Because in many cases there is no additional evidence to support the gene predictions provided by ab initio gene-finding programs, it is very important to know the accuracy level of these programs. The reliability of the programs concerns both users and developers. Lab bench experiments are often based on the gene/exon predictions, and they usually require a substantial investment in time and resources. This is why it is important for a user to know how well a certain algorithm performs, what its strengths and weaknesses are, and how to interpret a particular score given by the program. For developers it is valuable to know the current state of the art, to relate the program's efficiency and reliability to the methods used, and to recognize the weaknesses that need to be addressed.
To evaluate gene-finding programs meaningfully it is necessary to do it uniformly on one test set of sequences. It is also important to avoid using sequences used for the training of programs analyzed, otherwise the accuracy of the programs may be overestimated.
Previous comparative analyses of gene-finding programs have been performed by Snyder and Stormo in 1995 and Burset and Guigo in 1996. Snyder and Stormo (1995) analyzed three gene-finding programs—GeneID, GRAIL (Xu et al. 1994) (two versions), and GeneParser (three versions of the program)—on rather limited test sets containing 28 and 34 sequences. A more comprehensive evaluation of gene structure prediction programs was done by Burset and Guigo (1996). These authors tested nine programs on a test set of 570 sequences and introduced a number of performance metrics to measure the accuracy of prediction on the nucleotide, exon, and gene levels. Some of these measures were known and had been used previously (sensitivity, specificity, and correlation coefficient at the nucleotide level) and some were newly introduced (approximate correlation, sensitivity, and specificity at the exon level). Those authors also investigated the behavior of the programs on sequences with errors (frameshift mutations), sequences with differing G + C content and sequences from different phylogenic groups within the vertebrates. This comprehensive analysis has been a valuable resource for both users and developers of gene prediction programs, and the Burset/Guigo dataset has been used extensively as a benchmark dataset for testing new generations of programs.
In the four years since the Burset/Guigo analysis was published, many new programs have been developed. The accuracy measures for most of them have been reported for the Burset/Guigo dataset. A reason for concern is not just that authors tested their programs themselves, but also in many cases it is not clear how the sequences from a program's training set overlap with the Burset/Guigo test set. It is realistic to assume that, in many cases, the training sets of these programs do overlap with the Burset/Guigo dataset because at one time it contained the vast majority of available vertebrate genomic sequences.
Here we present a new independent comparative analysis of seven recently developed programs that use only coding and signal information for the prediction of gene structure: FGENES (V. Solovyev, unpubl.), GeneMark.hmm, Genie, Genscan, HMMgene, Morgan (Salzberg et al. 1998), and MZEF (Zhang 1997). The programs were tested on genomic sequences containing one single- or multi-exon gene of human, mouse or rat origin. In order to avoid overlap with the training sets of the programs, we selected only sequences entered in GenBank after the programs were developed and trained. The initial dataset was further filtered to exclude any anomalous sequences (e.g., containing atypical start codon or splice site dinucleotide, in-frame stop codon), and then we subjected it to nonredundancy testing to eliminate groups or pairs of very similar sequences. Finally, we kept only sequences for which we could confirm the annotated exon/intron boundaries by aligning them with a corresponding mRNA sequence. The final set consisted of 195 sequences as described below.
For all the programs tested, the basic accuracy measures introduced by Burset and Guigo (1996) were calculated. We chose to compute only nucleotide and exon level accuracy measures, because the prediction of the entire gene structure is still unreliable and seldom used. As an illustration, Dunham et al. (1999) identified 94% at least partially predicted genes on human chromosome 22 using Genscan, but only 20% of genes had all exons predicted exactly. We also examined the programs' accuracy as a function of various sequence or prediction features, such as G + C content of the sequence, length and type of the annotated and predicted exons, signal type of the annotated and predicted exons, and the score/probability of the predicted exon, motivated by a similar detailed analysis done by Burge (1997).
RESULTS
The accuracy measures for five of the seven programs analyzed in this study have already been reported for the Burset/Guigo dataset. However, the results should be considered with some care because it is not clear how this test dataset and the training sets used overlapped. This problem motivated us to build a dataset that does not contain any of the sequences that were part of any training set of these programs. This was accomplished simply by choosing sequences that were entered into GenBank after these programs were trained, but there are no guarantees that there are no similarities between these newly selected sequences and sequences in the programs' training datasets. Our opinion is that an independent dataset should not necessarily exclude the sequences that are similar to the sequences in the training set, because, realistically, the unannotated sequence submitted to the gene-finding program might also be similar to an already known and characterized sequence that has been use in the program's training set. The same approach was advocated by Snyder and Stormo (1995).
Sequences from the test dataset HMR195 were run through the seven gene prediction programs. For each sequence, the exons predicted on the forward strand (predictions for the reverse strand were ignored) were compared to the actual coding exons, as annotated in the GenBank ‘CDS’ feature. Although all of the programs tested, except Morgan, can predict genes and exons on both DNA strands simultaneously, the GenBank records for most of the sequences in HMR195 contain only annotation for the Watson/plus strand, and consequently only prediction for that strand could be confirmed. From this comparison, accuracy measures at the nucleotide and exon levels were computed and then averaged.
We chose to use averaging by sequence, where measures are first calculated for each gene and then averaged over all genes, as opposed to averaging by base, where measures are summed for all sequences and then averaged by nucleotide or by exon, depending on the measure type. The former is thought to give a better indication of the success rate for the individual sequence entry. For a discussion of this topic, see Dong and Searls (1995) and Burset and Guigo (1996).
The measures are averaged only over sequences for which they are defined. This might overestimate the values for sensitivity (Sn), specificity (Sp), approximate correlation (AC), correlation coefficient (CC), exon level sensitivity (ESn), exon level specificity (ESp), and the average of the latter two on the sets that have many sequences without prediction. So, in order to obtain a realistic estimate of the gene-finders' performance, one must also look at the number of sequences where no genes were predicted. The accuracy measures for all of the programs analyzed, averaged for the entire HMR195 dataset, are presented in Table 1.
Table 1.
Nucleotide and Exon Level Accuracy
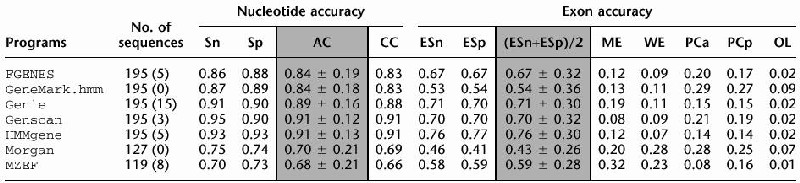 |
For each sequence in the HMR195 dataset, the exons predicted on the forward (+) strand were compared to the annotated exons. The standard measures of predictive accuracy on nucleotide and exon level were calculated for each sequence and averaged over all sequences for which they were defined. This was done separately for each of the programs tested.
(No. of sequences) number of sequences effectively analyzed by each program; in parentheses is the number of sequences where the absence of gene was predicted; (Sn) nucleotide level sensitivity; (Sp) nucleotide level specificity; (AC) approximate correlation; (CC) correlation coefficient; (ESn) exon level sensitivity; (ESp) exon level specificity; (ME) missed exons; (WE) wrong exons; (PCa) proportion of real exons that were partially predicted (only one exon boundary correct); (PCp) proportion of predicted exons that were only partially correct; (OL) proportion of predicted exons that overlap an actual exon. AC and (ESn+ESp)/2 are given with standard deviation.
The next step was to examine accuracy as a function of various sequence or prediction features, such as G + C content of the sequence, length and type of the annotated exons and predicted exons, signal type for both annotated and predicted genes, and the score/probability of the exon prediction. For each of these characteristics, the dataset was divided into the subsets exhibiting different value ranges or types of the characteristic examined. For each subset, the accuracy measures were calculated and averaged over all of the sequences belonging to it. These results are presented in the tables below; the seventh table shows the accuracy results for human and murine sequences separately.
Because of space limitations we show only some of the accuracy measures calculated. The full results for each program can be found at http://www.cs.ubc.ca/∼rogic/evaluation/results.html.
DISCUSSION
Comparing the results presented by Burset and Guigo (1996) with the results obtained in the present study (Table 1), it is apparent that the new generation of programs has, overall, substantially higher prediction accuracy than the programs analyzed by Burset and Guigo in 1996. At that time, the program with the best approximate correlation (among the programs not using any database similarity search) was FGENEH, with AC = 0.78, while the highest AC in 1999 is 0.91, exhibited by both Genscan and HMMgene. On the exon level, (ESn + ESp)/2 has increased from 0.64 for FGENEH to 0.76 for HMMgene. Also, earlier gene-finders were programmed to have low false-positive rates at the expense of losing valid predictions, which resulted in, on average, 20% higher specificity than sensitivity. Programs of the new generation are tuned to have equally high sensitivity and specificity, which is more desirable.
These improvements have come about as a result of the development of more accurate models for gene structure that are capable of recognizing many different gene features in the sequence. Most of the gene-finders analyzed use explicit duration HMM with associated length distribution for each state. These models of genomic structure are hierarchical, with generalized HMM modeling the overall gene structure, where states of the model are independent probabilistic models themselves, such as HMMs and neural networks. Also, new methods have been developed for signal recognition, such as maximal dependence decomposition used for the recognition of donor site in Genscan, neural networks in Genie, and ribosomal binding sites in GeneMark.hmm. The training sets are carefully selected and the average number of training sequences in the dataset has increased, allowing for more diversity in genomic content of the training sequences.
With the accuracy measures at the nucleotide level as high as 0.91 for the AC value for both Genscan and HMMgene, we might conclude that the problem of computational gene-finding is almost solved. However, looking at the results for exon sensitivity and specificity and their average, we see that the goal is still far away. Why is there such a gap between AC and (ESn + ESp)/2? Since ESn and ESp are defined as true exons (TE) divided by annotated exons (AE) and predicted exons (PE), respectively, this means that in calculating these two measures only exons with both boundaries predicted correctly will be considered. An almost perfectly predicted exon, covering the whole sequence of an actual exon but exceeding the splicing site by just a few nucleotides will not be counted in TE. In order to predict the exact boundaries of an exon, a program has to have a strong “search by signal” component — signal sensors for identifying start and stop codons and splicing sites. However, signal detection, especially of start and stop codons, is probably the weakest component of current gene-finding programs, as can be observed in Table 2. Although discrimination among coding and noncoding regions, most often done by measuring the hexamer frequencies in these regions, has shown to be quite successful, signal recognition could still be improved. There has been significant effort to improve the prediction of acceptor and donor splice, and many different methods have been used for this task, such as neural networks and maximal dependence decomposition (the methods for splice site detection are not known to us for all of the programs analyzed). The success of these methods is apparent in Table 2. On the other hand, we are not aware of any systematic effort to tackle the problem of start and stop codon detection. These signals are considered to have low information content, and they are usually detected by using weight (positional) matrices, weight arrays that capture dependencies between adjacent nucleotides or, in the case of Genie, neural networks for translation initiation site.
Table 2.
Accuracy versus Signal Type
| Programs | Signal type | |||
|---|---|---|---|---|
| start codon (195) | acceptor site (753) | donor site (753) | stop codon (195) | |
| FGENES | 0.67 | 0.80 | 0.85 | 0.75 |
| (0.63) | (0.77) | (0.82) | (0.72) | |
| GeneMark.hmm | 0.46 | 0.81 | 0.82 | 0.57 |
| (0.60) | (0.75) | (0.78) | (0.64) | |
| Genie | 0.56 | 0.77 | 0.78 | 0.72 |
| (0.57) | (0.82) | (0.83) | (0.73) | |
| Genscan | 0.61 | 0.87 | 0.90 | 0.76 |
| (0.78) | (0.80) | (0.84) | (0.86) | |
| HMMgene | 0.75 | 0.81 | 0.83 | 0.78 |
| (0.78) | (0.85) | (0.87) | (0.81) | |
| Morgan | 0.43 | 0.66 | 0.65 | 0.39 |
| (0.43) | (0.57) | (0.56) | (0.39) | |
| MZEF | — | 0.59 | 0.66 | — |
| (0.65) | (0.73) | |||
For each program, the proportion of actual signals identified correctly (the upper number) and the proportion of predicted signals that are correct (the lower number) are averaged over all signals belonging to a particular type. The number in parenthesis in the header of each column represents the number of signals of each type in the HMR195 dataset.
The tendency to miss actual signals can also be observed from the proportion of partially predicted exons (PCa) that ranges from 0.08 for Genie to 0.29 for GeneMark.hmm (Table 1). GeneMark.hmm, and Morgan, besides having high proportions of PCa, also have a relatively high proportion of OL, the proportion of predicted exons that overlap an actual exon (0.09 and 0.07, respectively, Table 1), and according to these results they are the programs with the poorest signal detection. If we add the number of the partially predicted exons to the number of correctly predicted exons and use this number for calculating ESn and ESp, then AC and (ESn + ESp)/2 would have similar values.
G + C Content
The human genome (and the genomes of other warm-blooded vertebrates) is not a structurally homogenous sequence of nucleotides. Instead, it is a mosaic of isochores, long (>300 kb, on average) DNA regions whose base composition is locally homogenous, but varies significantly between disjoint regions. The genome is usually divided into five different compositional categories: L1, L2 (A + T-rich regions), H1, H2, and H3 (G + C-rich regions) in increasing order of G + C percentage. It has been observed (Bernardi 1993) that L1 + L2 constitute ∼60% of the human genome, H1 + H2 30%, and H3 only 5%. These compositional regions vary widely in gene density: Zoubak et al. (1996) calculated that L1 + L2 regions have a relative gene concentration of 4%, H1 + H2, 20%, and H3 76%. This means that the gene density in very G + C-rich DNA segments is almost 20 times higher than in A + T-rich regions.
Important structural properties of genes are found to be strongly correlated with G + C content (Duret et al. 1995): genes from G + C-poor isochores code for proteins that are on average longer then those from G + C-rich isochores, intronic DNA is on average three times longer in L1 + L2 than in H3, and the number of introns per gene is higher in L1 + L2 than in H3.
How does compositional variability in genomic sequences affect the performance of gene-finding programs? Burset and Guigo (1996), Snyder and Stormo (1995), and Lopez et al. (1994) have shown in their analyses that gene-finding programs usually perform worse when the G + C content is low. The proposed reasons for this anomaly are that G + C-rich genes have stronger codon bias that makes them easier to identify and that they are more frequent than the genes in A + T-rich isochores. Guigo and Fickett (1995) showed that coding statistics used by gene-finding programs (codon, dicodon, and hexamer frequency) are strongly dependent on G + C content.
It is obvious that if a program has only one set of parameters intended to model gene structure (oligonucleotide frequency, length of coding and intergenic region, exon and intron length and number), it will not be able to perform equally well in both A + T- and G + C-rich sequences due to the significant structural differences between genes in these sequences. The reason why programs perform better for G + C-rich sequences could also be because they are trained on the sequence subset of GenBank, which is biased towards G + C-rich sequences. According to Duret et al. (1995), genes from G + C-rich isochores are much more frequently sequenced than those from G + C-poor isochores.
Some programs, such as Genscan, HMMgene, and MZEF tested in this survey, recently adopted the approach of using distinct, empirically derived model parameters for distinct G + C compositional regions.
Table 3 presents the programs' accuracy measures on the sequences with different G + C content. We partitioned our dataset into four groups according to the G + C content of the sequences. These groups are closely related to previously defined isochores except that the very G + C-rich isochore was split into two groups because it was heavily populated. Seven percent (14/195) of the sequences came from L1 + L2 isochores (more precisely with G + C% ≤ 40%), 35% (69/195) of sequences from H1 + H2 (40% <G + C% ≤50%) and 57% (112/195) of sequences from H3 (G + C% >50%), which were subsequently split into two groups (50% <G + C% ≤60% and G + C% >60%), containing 93 and 19 sequences, respectively. These percentages are significantly inconsistent with the results from Bernardi (1993), which points out the huge bias for the G + C-rich sequences in GenBank.
Table 3.
Accuracy versus G + C Content
| C + G content | <40%(14) | 40–50%(69) | 50–60%(93) | >60%(19) | ||||
|---|---|---|---|---|---|---|---|---|
| AC | (Esn+Esp)/2 | AC | (Esn+Esp)/2 | AC | (Esn+Esp)/2 | AC | (Esn+Esp)/2 | |
| FGENES | 0.84 | 0.70 | 0.81 | 0.64 | 0.85 | 0.71 | 0.87 | 0.66 |
| GeneMark.hmm | 0.79 | 0.48 | 0.80 | 0.46 | 0.87 | 0.62 | 0.85 | 0.48 |
| Genie | 0.85 | 0.69 | 0.85 | 0.60 | 0.92 | 0.75 | 0.87 | 0.79 |
| Genscan | 0.94 | 0.80 | 0.91 | 0.66 | 0.91 | 0.74 | 0.88 | 0.70 |
| HMMgene | 0.91 | 0.76 | 0.90 | 0.73 | 0.92 | 0.79 | 0.91 | 0.77 |
| Morgan | 0.65 | 0.29 | 0.72 | 0.49 | 0.69 | 0.43 | 0.69 | 0.37 |
| MZEF | 0.66 | 0.71 | 0.65 | 0.50 | 0.70 | 0.62 | 0.58 | 0.53 |
The HMR195 dataset was partitioned according to the G + C% content of the sequences. The number in parenthesis in the header of each column represents the number of sequences belonging to each partition. For each program, AC and (ESn+ESp)/2 are averaged over all sequences belonging to the particular partition for which they are defined.
Consistent with the observations made in Burset and Guigo (1996), it seems that some programs are sensitive to the G + C content of a sequence, performing better when the sequence is G + C-rich. The programs which exhibited this in our analysis are FGENES on the nucleotide level, GeneMark.hmm and Genie on both levels, and HMMgene marginally on the exon level. Among programs that are known to use different parameter sets for different G + C content, Genscan's and HMMgene's prediction accuracy is relatively independent of the base composition, but MZEF still has very variable results, especially on the exon level, that are not proportional to the G + C content of a sequence. The situation is similar for Morgan.
There is one peculiarity noted in Table 3: All of the programs except Morgan have the lowest accuracy measures averaged on the sequences with G + C content between 40% and 50%. Because this is not the region with the lowest G + C composition, it is not clear whether the programs really do perform most poorly for this type of sequences or whether there is some characteristic of our test set that causes this slight drop in prediction accuracy.
Exon Length
The length distributions of different gene elements differ considerably from each other. Introns seem to have an approximate geometric length distribution (Hawkins 1988; Burge 1997), which is a characteristic of a discrete stochastic process with the “memoryless” property (Karlin and Taylor 1975). This supports the idea that introns do not have any significant constraints on their length, except that the minimal number of nucleotides (70–80) is required (Wieringa et al. 1984).
Exons, in contrast, have significant functional constraints. The exon length plays an important role in proper splicing and inclusion in the mature mRNA (Dominski and Kole 1991). These constraints have shaped the exon length distribution quite differently from geometric distribution. The length distribution depends on the exon type. Internal exons have length distribution close to a Gaussian distribution with a broad peak between 100 and 170 bp (Hawkins 1988). Hawkins calculated the mean internal exon length to be 137 bp (in our dataset 136 bp), and he observed very few exons shorter than 50 or longer than 300 nucleotides. Length distributions for initial and terminal coding exons are not recognizable statistical distributions. They are still substantially peaked around 60 and 160 bp, respectively (Hawkins 1988; Burge 1997), but do not have a steep drop-off in density after 300 bp. Both types of exons are more variable in length than internal exons, and their calculated means are 134 bp for initial exons and 198 bp for terminal exons (Hawkins 1988) (in our dataset 207 bp for initial and 265 bp for terminal). For the fourth class of exons, single-exons, the length distribution is not known, but in general they are much longer than any other type of exons and their mean length is calculated to be 1300 bp (Hawkins 1988) (in our dataset 1010 bp).
In our analysis, we grouped exons by both their annotated length and their predicted length and averaged the accuracy measures in each group. Because many of the programs tested in this analysis (Genie, GeneMark.hmm, Genscan, and HMMgene) use explicit duration HMM, which has associated length distribution to each state of the model, it is interesting to see how these distributions influence the accuracy of their exon prediction.
From Table 4 it can be observed that the general trend of all seven of the programs is to have a very low proportion of correctly predicted short exons, which then slowly but monotonically rises with the length of annotated exons. For almost all of the programs, exons are most accurately predicted when their length ranges between 75 and 200 nucleotides (these exons were the most common: 560 of 839). The exons longer than 200 nucleotides (our dataset contained 131 of these exons) seem more difficult to predict correctly, and the accuracy measures drop further as the length increases. The exception is HMMgene, which predicts longer exons with the same accuracy as the more common medium-length exons.
Table 4.
Accuracy versus Exon Length
| Programs | Length range of exons in bp | ||||||
|---|---|---|---|---|---|---|---|
| 0–24 (22) | 25–49 (49) | 50–74 (91) | 75–99 (130) | 100–199 (440) | 200–299 (91) | 300+ (125) | |
| FGENES | 0.45 | 0.55 | 0.71 | 0.80 | 0.80 | 0.71 | 0.59 |
| (0.33) | (0.42) | (0.64) | (0.75) | (0.81) | (0.61) | (0.66) | |
| GeneMark.hmm | 0.05 | 0.39 | 0.60 | 0.77 | 0.75 | 0.67 | 0.46 |
| (0.12) | (0.51) | (0.58) | (0.72) | (0.73) | (0.62) | (0.45) | |
| Genie | 0.27 | 0.53 | 0.60 | 0.80 | 0.70 | 0.71 | 0.69 |
| (0.18) | (0.47) | (0.66) | (0.81) | (0.83) | (0.68) | (0.69) | |
| Genscan | 0.18 | 0.45 | 0.68 | 0.89 | 0.84 | 0.87 | 0.66 |
| (0.29) | (0.81) | (0.79) | (0.85) | (0.76) | (0.71) | (0.65) | |
| HMMgene | 0.23 | 0.59 | 0.64 | 0.79 | 0.80 | 0.78 | 0.77 |
| (0.42) | (0.76) | (0.75) | (0.77) | (0.85) | (0.72) | (0.74) | |
| Morgan | 0.30 | 0.37 | 0.38 | 0.61 | 0.51 | 0.51 | 0.42 |
| (0.14) | (0.14) | (0.31) | (0.57) | (0.57) | (0.41) | (0.35) | |
| MZEF | 0.00 | 0.16 | 0.32 | 0.40 | 0.49 | 0.45 | 0.12 |
| (0.00) | (0.44) | (0.45) | (0.58) | (0.73) | (0.53) | (0.26) | |
The HMR195 dataset was partitioned according to the length of the annotated exons. The number in parenthesis in the header of each column represents the number of actual exons belonging to each partition. For each program, CRa (the proportion of real exons that are correctly predicted [the upper number]) and CRp (the proportion of predicted exons that are correct [the number in parentheses]) are averaged over all sequences belonging to that particular partition.
The exons shorter then 25 bases (there were only 17) are missed in 41% of cases for FGENES, up to 88% for MZEF. The most plausible explanation for this phenomenon is that the length of the coding region is too short to be clearly distinguished from surrounding noncoding regions. In addition, there is biochemical evidence that this type of exon is inefficiently spliced in vivo without the presence of special splicing activating sequences (Dominski and Kole 1991). Finally, the associated length distributions used by some programs do not favor very short exons, and depending how these distributions are used by the systems, this may cause poor prediction for this type of exon.
Although very long exons are less likely to be predicted correctly than medium-length exons, they are most unlikely to be completely missed. The number of partially predicted exons longer than 300 nucleotides is relatively large (data not shown), and only <7% of them are completely missed (the exception is MZEF with 33% of exons missed).
Lastly, it can be noted from Table 4 that there is usually a significant difference between the proportion of annotated exons that are correctly predicted (CRa) and the proportion of predicted exons that are exactly correct (CRp) for very short exons. The reason for this is that whereas programs FGENES, Genie, and Morgan overpredict short exons, the rest of the programs underpredict them—the total number of short exons predicted by each of these programs is much lower than the actual number of exons of the same size. Again, this may be the consequence of exon length distribution built into the gene-finding programs. This discrepancy in the numbers of real and predicted exons is much smaller for the longer exons.
Exon Type and Signal Prediction
Table 5 summarizes accuracy measures for different exon types. What can be observed is a striking difference between the proportion of correctly predicted internal exons on one side and the proportion of correctly predicted initial and terminal exons on the other side. This difference is partially eroded with a high number of partially predicted initial and terminal exons (data not shown), especially if we allow the predicted exon to be of any type; but still initial and terminal exons are more likely to be completely missed than internal exons. For single-exon genes, the situation is similar in the sense that the proportion of correctly predicted single exons (CRa) is usually significantly lower than CRa for internal exons (the exceptions are HMMgene and Genie), but they have very high PCa, the proportion of partially predicted exons (the extreme case is GeneMark.hmm with CRa = 0.30 and PCa = 0.56 for single exons). The difference is that single-exon genes are very rarely missed, and the proportion of missed exons of this type is the lowest among all exon types and all programs. The only program that is almost equally successful in predicting exons of any type is HMMgene, which also has the highest proportion of correctly predicted exons (CRp) for initial, terminal and single exons among all of the programs. This HMMgene characteristic surely contributes to its excellent results on our dataset.
Table 5.
Accuracy versus Exon Type
| Programs | Exon type | |||
|---|---|---|---|---|
| initial (152) | internal (601) | terminal (152) | single (43) | |
| FGENES | 0.64 | 0.79 | 0.66 | 0.58 |
| (0.55) | (0.78) | (0.58) | (0.83) | |
| GeneMark.hmm | 0.40 | 0.78 | 0.52 | 0.30 |
| (0.48) | (0.72) | (0.51) | (0.65) | |
| Genie | 0.49 | 0.76 | 0.61 | 0.70 |
| (0.45) | (0.82) | (0.57) | (0.68) | |
| Genscan | 0.57 | 0.87 | 0.67 | 0.63 |
| (0.71) | (0.76) | (0.73) | (0.83) | |
| HMMgene | 0.68 | 0.78 | 0.70 | 0.77 |
| (0.72) | (0.83) | (0.73) | (0.79) | |
| Morgan | 0.35 | 0.55 | 0.36 | — |
| (0.35) | (0.46) | (0.36) | ||
| MZEF | — | — | — | — |
The HMR195 dataset was partitioned according to the type of the annotated exons. The number in parenthesis in the header of each column represents the number of actual exons belonging to each partition. For each program, CRa (the upper number) and CRp (the number in parentheses), are averaged over all sequences belonging to that particular partition.
Why are initial, terminal, and single exons more difficult to identify? The only obvious structural differences among different types of exons are the signals bordering them; there are no studies showing that codon usage (hexamer frequency) fluctuates among different exon types. The difference in exon length could be a reason, since internal exons (136 bp in our dataset) belong to a group of exons more likely to be identified correctly than exons longer than 200 bp, which is the case with initial and terminal exons (207 bp and 265 bp, respectively) (Table 4). However, the differences in accuracy level shown in Table 4 do not compensate for the large differences shown in Table 5. Our hypothesis that signal prediction is mainly responsible for the difference in accuracy levels is supported by the results given in Table 2: The detection of start and stop codons is much less accurate than that of acceptor and donor sites (again, the exception is HMMgene), and the difference in accuracy level is proportional to the accuracy level difference for initial and terminal exons versus internal exons shown in Table 5. As noted above, during the assembly of HMR195 we were not able to validate the locations of annotated start and stop codons. Consequently, prediction accuracy measures calculated for these signals as well as subsequent analysis and discussion strongly rely on the correctness of their annotation in GenBank. Burge and Karlin (1998) presented similar results for Genscan signal detection on a different dataset.
The situation is a bit more complex for single-exon genes: on the one hand they contain both start and terminal codons which should complicate their identification even further, but on the other their average length in our dataset is 1022 bp, which according to the analysis described above in the section entitled Exon Length makes them hard to predict exactly, but difficult to miss. This directly corresponds to the results shown in Table 5.
What can also be observed in Table 5 is that for the programs FGENES, GeneMark.hmm, and Genscan there is a significant difference between CRa and CRp for the single exons. Analogous to the case of very short exons, the cause of this phenomenon is that these programs are conservative in predicting single-exon genes: the number of single exons predicted by any of these programs is much lower then the number of real ones in our dataset. The consequence of this is that single exons predicted by these programs have a very good chance of being correct, while many real such exons remain unidentified.
Exon Probabilities and Scores
Each of the programs evaluated in this study except GeneMark.hmm has a scoring scheme for its exon prediction. Genscan, HMMgene and MZEF have a probability score for each exon predicted that is supposed to be a quantitative measure of the likelihood that the given exon is correct. Morgan's scores were originally intended to be probabilities, but that intention was not followed through subsequent upgrades, and what is left is a scale with no formal meaning except that very high scores result from motifs that Morgan has seen before. Genie uses the bit score against a background distribution that is dependent on the length of the predicted exon and thus the scores cannot be meaningfully compared to other exon scores. The way FGENES calculates exon scores is not known to us.
Since the nature of Morgan's and Genie's scores makes them uninformative for a user, we tested the reliability of exon score for the other four programs: FGENES, Genscan, HMMgene, and MZEF.
The results for FGENES (data not shown) appear to show that its scores are not directly useful. Most of the exons predicted have a score <10, and CR values average to the similar levels for any subregion on the scale from 0 to10. The only informative exon score is above 10, since, at least in our dataset, these exons are correctly predicted in 90% of cases, which is significantly higher than the CR for exons with lower scores. However, scores this high are rarely assigned to an exon prediction.
The accuracy measures for different regions of probability scores for Genscan, HMMgene, and MZEF are displayed in Table 6. What can be observed is that CR values are monotonically rising with the increase in exon probability. For Genscan and HMMgene, these values are usually close to the lower boundary of a probability range (the exception is the probability region 0.90–0.95, where CR values are lower than probabilities). MZEF, on the other hand, significantly overestimates probabilities for its exon predictions. If we relax our criterion and include partially predicted exons (the results for PC values are not shown), CR values will reach and sometimes overreach the upper boundary of a probability region (CR values for MZEF will correspond to the probability region average).
Table 6.
Accuracy versus Probability
| Programs | Probability range of predicted exons | ||||
|---|---|---|---|---|---|
| 0.00–0.50 | 0.50–0.75 | 0.75–0.90 | 0.90–0.95 | 0.95+ | |
| Genscan | 0.32 | 0.45 | 0.75 | 0.84 | 0.94 |
| (112) | (159) | (132) | (93) | (481) | |
| HMMgene | 0.32 | 0.65 | 0.79 | 0.83 | 0.95 |
| (91) | (173) | (136) | (96) | (406) | |
| MZEF | — | 0.43 | 0.54 | 0.64 | 0.74 |
| (111) | (104) | (72) | (258) | ||
The HMR195 dataset was partitioned according to probability of the predicted exons. For each program, CRp (proportion of predicted exons that are correct) is averaged over all sequences belonging to that particular partition. The number in parenthesis is the number of exons belonging to each partition.
This analysis shows that in the case of Genscan and HMMgene, the exon probability score can be a very useful guide to the reliability of the exon prediction.
Phylogenetic Specificity
All of the programs analyzed in this survey were trained on human sequences except for Morgan, which was trained on the dataset of vertebrate sequences collected by Burset and Guigo (1996). Since the dataset we used to test the programs was composed of 103 human and 92 murine (82 Mus musculus and 10 Rattus norvegicus) sequences, we wanted to investigate whether such a phylogenetic mix can corrupt the performance of the gene-finding programs, especially those calibrated for human sequences.
The AC values on the nucleotide level and for (ESn + ESp)/2 on the exon level for each of the programs, but separately for human and murine sequences, are given in Table 7. It can be observed that the difference in accuracy measures between human and mouse/rat are marginal. Even more interesting is that in most cases the values for murine sequences are higher than the values for the human sequence, even though the model parameters of the programs were learned from the set of human sequences.
Table 7.
Phylogenetic Specificity
| Programs | Trained on | Nucleotide accuracy-AC | Exon accuracy−(ESn+ESp)/2 | ||
|---|---|---|---|---|---|
| human | murine | human | murine | ||
| FGENES | human | 0.85 | 0.82 | 0.67 | 0.68 |
| GeneMark.hmm | human | 0.83 | 0.84 | 0.56 | 0.51 |
| Genie | human | 0.88 | 0.89 | 0.73 | 0.67 |
| Genscan | human | 0.89 | 0.92 | 0.72 | 0.70 |
| HMMgene | human | 0.90 | 0.92 | 0.74 | 0.79 |
| Morgan | vertebrate | 0.64 | 0.75 | 0.43 | 0.44 |
| MZEF | human | 0.65 | 0.66 | 0.59 | 0.58 |
The HMR195 dataset was split into two species subsets containing 103 human and 92 murine sequences. For each subset and each program, AC and (ESn+ESp)/2 were averaged over all sequences belonging to the particular subset.
It is likely that such differences are not statistically significant and that they would also be observed if the results on two different human sequence sets were compared. This hypothesis is also supported by the comparison of the human and mouse grammars constructed by Dong and Searls (1994), where no significant differences were found.
Conclusions
The results obtained in this analysis indicate that the new generation of programs has significantly higher accuracy then the programs analyzed by Burset and Guigo in 1996. Comparing the programs with the highest approximation correlation in their study and our study, we find that this value has improved from 0.78 (FGENEH) to 0.91 (Genscan and HMMgene), a 17% increase, while the highest averaged exon sensitivity and specificity has improved from 0.64 (FGENEH) to 0.76 (HMMgene), a 19% increase.
The behavior of the programs on the sequences with different G + C content is not systematic. Some programs' accuracy appears to be slightly dependent on the G + C content, while programs such as Genscan and HMMgene, which use different parameter sets for different G + C content, perform steadily for any G + C content.
The accuracy of exon prediction is dependent on the length of the exon. The general trend of the programs is to have a very low proportion of correctly predicted short exons, which then rises with the length of annotated exons. For almost all of the programs, “medium” exons, whose length ranges between 70 and 200 nucleotides, are most accurately predicted. The accuracy decreases again for exons longer than 200 bp (the exception is HMMgene), but very few such exons are missed completely.
The analysis of accuracy prediction as a function of the exon type reveals that internal exons are much more likely to be predicted correctly than other types of exons. The cause of this phenomenon is the weakness of the detection of start and stop codons, which border other types of exons. Initial and terminal exons are most likely to be missed completely, while single exons, although difficult to predict exactly (they contain both start and stop signals), are rarely missed due to their substantial length.
Among the seven programs analyzed, only Genscan and HMMgene have reliable scores for exon prediction.
Our goal was not to obtain the ultimate accuracy results for the programs we tested, but rather to conduct the first independent, comparative evaluation of the recently developed gene-finding algorithms. Obtaining definitive accuracy results is an impossible task, because the performance of the programs is very sensitive to the dataset they are tested on, as observed by many authors.
Our evaluation was based on a dataset that was carefully prepared, containing only “textbook” genes. Even if the sequences had been selected in a more flexible manner, they would still be biased because the present public sequence databases are biased: genes that are more difficult to isolate or to sequence (e.g., very long genes found in A + T-rich regions) are underrepresented, while there is a great deal of redundancy with overrepresentation of some gene families. In addition, genes currently present in databases reflect the interests of the scientific community (e.g., disease genes) and are not a random sample of the genome. More details about biases in the sequence databases can be found in Duret et al. (1995). The evaluation of gene-finding programs on more realistic sequence datasets (longer genomic sequences with more complex gene structures and less coding density) would almost certainly result in considerably lower accuracy measures than those obtained in the present study. The results described here should be considered as upper bound estimates of the programs' accuracy when they are used on typical genomic sequences. This situation may improve when the programs are retrained on new, more diverse genomic sequences.
There are certain assumptions that had to be made in order to obtain accuracy measures for the programs tested. Although we were able to validate exon/intron boundaries, we did not have a methodology to confirm start and stop codon positions. Therefore, we had to assume that they were correctly annotated in GenBank. Also, 5′ and 3′ flanking sequences were assumed to be exonless, and every prediction made in those regions was considered incorrect, which might eliminate some perfectly valid predictions. On the other hand, it is very unlikely that some predicted internal exons were in fact real but not previously detected, because in that case we would have observed an unaligned mRNA piece when using the sim4 algorithm. The possibility exists that some of the genes in our test set have other, still unknown, splice variants, and that some of the exons predicted actually belong to some of them.
Although the programs for gene structure predictions have greatly improved in the last decade, from the simple open reading frame finders to sophisticated heterogeneous systems incorporating various types of evidence of gene structure, even the best of the programs cannot be used autonomously for the detection of genes and other genomic elements. The programs still have a considerable proportion of incorrect and missed exons, and additional evidence is usually needed to confirm their predictions. In addition, they concentrate only on the detection of coding exons, while 5′ and 3′ UTRs, promoter elements, and polyA sites often remain undetected. The elucidation of complex genome organization, such as nested and overlapping genes or alternative splicing, has not yet been considered by any program. Even the signal sensors (especially for start and stop codons, which have been in use for a long time) have significant room for improvement.
Nevertheless, with the immense influx of data from the sequencing projects, gene-finding programs are indispensable tools for the initial analysis of these sequences. They are able to pinpoint the regions containing exons and accurately predict the majority of them, providing an excellent starting point for experimental studies. Combined with other evidence, such as similarity with a known sequence or matches in EST databases, these programs are capable of reliable elucidation of complete gene structures. To achieve the ultimate goal of automatic annotation of genomes, a better understanding of the biological processes involved in transcription, mRNA processing, and translation is required. However, improvements can also be made by further development of existing methods, especially signal sensors and regulatory region models, construction of more flexible models of genomic structure to allow nonclassical gene arrangement, and calibration of program parameters on more diverse genomic sequences.
METHODS
Test Dataset
The primary requirement for the construction of the dataset to be used for the evaluation of gene structure prediction programs was to exclude sequences already used for training those programs. Since for some of the programs the training datasets are not specified, the best solution was to choose only sequences entered into GenBank after the programs were developed and trained. For that reason, only sequences submitted to GenBank after August 1997 were considered.
Although we first considered including only human sequences in the dataset, after a few filtering steps it was obvious that the size of the dataset would be relatively small, so we decided to expand the list of organisms. We decided to include sequences from M. musculus and R. norvegicus because the mouse and rat genomes are relatively well studied and a number of murine sequences are present in GenBank. In addition, the human, mouse, and rat genomes are phylogenetically close enough to be analyzed with the same parameter files used in the gene-finding programs (parameter values specific to mouse or rat sequences are not available for any program). The section above entitled Phylogenetic Specificity offers further discussion and justification of this thesis.
With these considerations, the dataset was constructed as follows:
DNA sequences were extracted from GenBank release 111.0 (April 1999). The basic requirements in sequence selection were:
The sequence was entered in GenBank after August 1997.
The source organism is H. sapiens, M. musculus, or R. norvegicus.
Only genomic sequences that contain exactly one gene were considered.
mRNA sequences and sequences containing pseudogenes or alternatively spliced genes were excluded.
Sequences collected according to those principles were further filtered to meet the following requirements:
All annotated coding sequences started with the ATG initiation codon and ended with one of the stop codons: TAA. TAG, TGA.
All exons had dinucleotide AG at their acceptor site and dinucleotide GT at their donor site.
Sequences that did not contain any nucleotides in their 5′ or 3′ UTR were discarded.
Sequences longer than 200,000 bp were discarded because some of the programs analyzed can only accept sequences up to that length.
Sequences whose coding region contains an in-frame stop codon were discarded.
Sequences that passed these filtering steps were further subjected to nonredundancy testing. All-against-all neighbor search with the Entrez Browser (command line Entrez - Nentrcmd from the NCBI tool kit) (Schuler et al. 1996) was performed, and if two sequences were linked as neighbors, only one of them was selected to enter the final dataset. Neighbor linkage in Entrez represents high similarity between two sequences.
The final restriction of the dataset was done to confirm exon locations annotated in the GenBank records. For each sequence in the dataset, we used the BLAST algorithm (Altschul et al. 1990, 1997) to find a corresponding mRNA sequence that had been independently sequenced and not derived from the genomic sequence. The sequences for which we were unable to find such an mRNA were discarded from the dataset. When corresponding mRNA existed, we used the sim4 program (Florea et al. 1998) to align the genomic sequence and the mRNA sequence. The result of the sim4 alignment is the list of exon locations, which we compared with the annotation in the GenBank record. Only those sequences whose exon annotation perfectly matched the sim4 results were selected for the final version of our dataset. Unfortunately, this analysis could not confirm the start location of the initial exon and the end location of the terminal exon, since mRNAs also contain 5′ and 3′ UTRs that also align to the genomic sequence, and thus these annotations remained unconfirmed.
The resulting dataset contains 195 sequences with exactly one complete either single-exon or multi-exon gene. We call this set HMR195.
HMR195 has the following characteristics:
The ratio of human:mouse:rat sequences is 103:82:10.
The mean length of the sequences in the set is 7096 bp.
The number of single-exon genes is 43, and the number of multi-exon genes is 152.
The average number of exons per gene is 4.86.
The mean exon length is 208 bp, the mean intron length is 678 bp, and the mean coding length of a gene is 1015 bp (∼330 amino acids).
The proportion of coding sequence in this dataset is 14%; that of the intronic sequence 46% and that of the intergenic DNA 40%.
The dataset is available at http://www.cs.ubc.ca/∼rogic/evaluation/dataset.html.
This dataset is not a typical subset of sequences from human and murine genomes; the fraction of coding sequence in our dataset (14%) is much higher than the estimated 3% for these genomes. The mean coding length of ∼330 amino acids is shorter than calculated mean of ∼450 aa for Caenorhabditis elegans and Saccharomyces cerevisiae (Zhang 2000). It is realistic to expect that the average protein in human, mouse and rat will be at least this long, because the analysis by Zhang (2000) shows that protein length seems to increase with the complexity of the organism. In the current release (September 2000) of HOVERGEN (Duret et al. 1994), a database of homologous vertebrate sequences, the average length of ∼50,000 vertebrate sequences present in the database is ∼1400 bp (465 aa). The average number of exons in a gene in HMR195 (4.86) is lower than the calculated 5.4 for human chromosome 22 (Dunham et al. 1999). These discrepancies are a direct product of biases in GenBank and other public sequence databases, which are discussed above in the Conclusions section. With the current limited amount of completely annotated sequences, it is not yet feasible to generate a dataset which would perfectly model human and murine genomes. In addition, the proportion of single-exon genes in HMR195 substantially exceeds this proportion in real genomes. Again, overrepresentation of these sequences in GenBank is a source of this discrepancy. Since there were no other biological reasons to eliminate single-exon genes, we chose to keep them within our dataset.
Programs Tested
All gene-finding programs made available after the evaluation by Burset and Guigo in 1996 were considered for this analysis. Since the goal of this experiment was to assess the programs that use only statistics and pattern recognition methods for gene-finding, programs that use other resources, such as database similarity search, were not included in the testing. Only programs trained on vertebrate sequences were considered.
The seven programs tested were (in alphabetical order) FGENES, GeneMark.hmm, Genie, Genscan, HMMgene, Morgan and MZEF. Some of these programs allow the user to change some of the parameters of the program (e.g., prior probability for MZEF and exon size in Morgan), depending on the properties of the input sequences. Although this might be beneficial for expert users working on specific sequences, it is not suitable for automatic testing of a large sequence dataset. Therefore, all of the programs analyzed here were run with the suggested default parameters.
All seven programs were installed and run locally at our site except for Genie, which was accessed through the Genie Web server http://www.fruitfly.org/seq_tools/genie.html. The programs were run on a SUN Ultra 60 computer, under the Solaris 5.6 operating system.
Details of the programs are enumerated below. For each program we give a short description of methods used by the program, information about its training set, the parameter files used when running it, the subset of the HMR195 dataset it was tested on, and some characteristics of output format.
FGENES version 1.6
(V. Solovyev, unpubl.) Information about this program can be found on the Sanger Center Computational Genomic Group Web site at http://genomic.sanger.ac.uk/gf/; details about an earlier version of the program, FGENEH, can be found in Solovyev et al. (1995). FGENES uses dynamic programming to find the optimal combination of exons, promoters, and polyA sites detected by a pattern recognition algorithm, constructing a set of gene models along a given sequence. The model is very flexible and allows prediction of single- and multi-genes in a sequence, that are either complete or partial. The program has been trained on a nonredundant dataset of 660 human sequences extracted from GenBank release 100. Details about the dataset can be found in Salamov et al. (1998). The type (first, internal, last, single) and location of each exon is specified in the output of the program, and for each exon there is an associated score for the prediction.
All of the sequences from HMR195 were submitted to FGENES, which predicted genes in 190 of the 195 sequences.
GeneMark.hmm version 2.2
(Lukashin and Borodovsky et al. 1998) This program was initially developed for bacterial gene-finding (Lukashin and Borodovsky 1998) and only recently modified to predict gene structure in eukaryotic organisms. A paper about the eukaryotic version of the program has not been published, but from the program's Web site at http://genemark.biology.gatech.edu/GeneMark/ it can be concluded that it uses explicit state duration HMM, which is often used in gene-finding programs (Genie and Genscan). The optimal gene candidates selected by the HMM and dynamic programming are further processed by a ribosomal binding site recognition algorithm. The dataset used for training is not described. The output is similar to that of FGENES, but no scores are given.
In our analysis, GeneMark.hmm was run with the human.mtx matrix for every sequence in HMR195, and it predicted genes in every sequence.
Genie version 1.x and version 2.1, October 1999
(Kulp et al. 1996) Similarly to GeneMark.hmm, Genie uses generalized HMM with arbitrary length distributions associated with some states of the model. The system is described as modular, since each state is trained separately and new states can be easily added. The mechanisms underlying some states are neural networks for splicing sites, with Markov chains for coding regions. The training set is assembled from the human sequences extracted from GenBank release 89.0 (1995), and details describing sequences and filtering processes can be found at http://www.fruitfly.org/sequence/human-datasets.html. This dataset has also been used for training other gene-finding systems (HMMgene and Genscan). Genie can predict single- or multiple-exon genes and any number of them in the sequence. The Genie web site is at http://www.fruitfly.org/seq_tools/genie.html.
During our testing period, a new version of Genie (2.1) became available, so we used the opportunity to test both versions. In this survey we consider only the results of the new version's prediction, and the name Genie refers to version 2.1 of this program. The results for the 1.x version of Genie are available upon request.
In order to test the new, upgraded version of Genie we sent all our sequences to Martin Reese at Lawrence Berkeley National Laboratory; he ran them through the program. Genie's output is in GFF format with the location and score for each feature in the sequence. This version of Genie predicted genes in 180 of 195 sequences.
Genscan version 1.0
(Burge 1997; Burge and Karlin 1997) In this program, the structure of the genomic sequence is modeled by explicit state duration HMM. The states of this HMM are probabilistic models themselves. Signals are modeled by weight matrices, weight arrays, and maximal dependence decomposition (Burge 1997), a new technique used for recognition of donor sites. Genscan's model can predict the absence of genes or the presence of a single gene or multiple genes, which can be either complete or partial. It also has the option to predict suboptimal exons, which are defined as potential exons with a probability higher than a certain threshold but which are not contained in the optimal parse of the sequence. This type of exon can potentially represent alternatively spliced exons. Genscan was trained on Kulp and Reese's dataset of human genomic sequences, and an additional set of 1999 human cDNA sequences was used for training the coding region HMM. The maximal length of the input sequence for this version of Genscan is 200 kb. The output of Genscan is similar to the output of the other programs, giving information about exon location and their probabilistic score, but scores for other sequence features such as splicing sites are also given. The Web version of Genscan is at http://genome.mit.edu/GENSCAN.html.
Genscan was run with parameter file HumanIso.smat for all the sequences in HMR195. It predicted genes in 192 of the 195 sequences.
HMMgene version 1.1d
(Krogh 1997) The program is based on HMM, and is trained using a criterion called conditional maximum likelihood, which maximizes the probability of correct prediction. If the sequence analyzed already has some subregions identified (hits to EST or protein database, repeated elements), those regions can be locked as coding or noncoding and then submitted to HMMgene. The underlying gene structure model can predict both partial and complete genes in sequence and any number of them. The program has the option to give more than one prediction, which could indicate alternative splicing of the gene in the sequence. The dataset of human single- and multi-exon genes collected by Kulp and Reese was used for the training of this program. The output is given in GFF format, slightly different from that used by Genie; it does not give the location of the splicing sites, but only of the exons, whose type is also specified. HMMgene's Web site is at http://www.cbs.dtu.dk/services/HMMgene/.
Every sequence from the testing dataset HMR195 was submitted to the program, which predicted genes in 190 of the 195 sequences.
Morgan version from April 1998
(Salzberg et al. 1998) [version from June 1997]. The underlying method behind Morgan is a combination of decision trees, dynamic programming and Markov chains. The most distinctive technique used is a decision tree classifier that classifies subsequences into different classes: initial, internal, final exon. Morgan has been trained on the Burset and Guigo dataset of 570 sequences containing only multi-exon genes, and for that reason its prediction is limited to only this class of genes. In addition, it is not capable of analyzing sequences that contain symbols other then A, C, G, and T (e.g., N, M, R, Y), which further reduces the number of sequences from HMR195 that can be used for the analysis. Morgan has the standard output with exon locations and probability scores. The recommended length of DNA sequence is up to 200 kb.
Morgan was tested on 127 acceptable sequences from HMR195, and it predicted a gene in every sequence analyzed.
MZEF version from April 1998
(Zhang 1997) MZEF uses a quadratic discriminant function to distinguish between two classes: coding and noncoding. Its training set consists of 3440 human exons extracted from GenBank release 87.0, and the program is trained to predict only internal coding exons. The output of the program gives the location of every internal exon predicted, along with a probability score for it and some other measures for different reading frames. MZEF can only analyze sequences shorter than 200 kb. The program has an option to set the prior probability for the sequence analyzed which depends on gene density and G + C content of the sequence. We used the default value of 0.4 for the prior parameter when submitting the sequences from our dataset to MZEF. The program's web site is at http://sciclio.cshl.org/genefinder/.
Because MZEF can predict only internal exons, only sequences that contain more than two exons from the dataset HMR195 were considered. The accuracy measures were calculated considering only annotated internal exons. There were 119 of these sequences, and MZEF predicted exons in 111 of them.
Measuring Predictive Accuracy
In order to evaluate the predictive accuracy of a gene-finding program we need to compare the exons predicted by the program with the actual coding exons, as annotated in the GenBank record under the ”CDS“ feature (annotated noncoding exons are not considered, because the programs analyzed do not predict them). From this comparison, we calculate nucleotide level and exon level accuracy measures.
Nucleotide Level Accuracy
If we define the values TP (true positives), TN (true negatives), FP (false positives), and FN (false negatives) as follows:
 |
 |
 |
 |
then we define sensitivity as the proportion of coding nucleotides that are correctly predicted as coding:
 |
and specificity as the proportion of nucleotides predicted as coding that are actually coding:
 |
These are widely used measurements of accuracy for gene prediction programs.
Both Sn and Sp range independently over [0,1], with perfect prediction occurring only when both measures are equal to 1. Each of these measures is not sufficient by itself, because perfect sensitivity of 1 can be obtained if all the nucleotides were predicted as coding, and perfect specificity can be obtained if all nucleotides were predicted as noncoding.
A single measure that captures both specificity and sensitivity is called the correlation coefficient (CC), defined as:
 |
This measure has been extensively used for evaluating gene structure prediction programs, but it has the undesirable property that it is not defined for some sequences (e.g., if there is not any coding region in an input sequence, or an input sequence has been predicted to be entirely noncoding). A measure with similar characteristics, but defined under any circumstance, is the approximate correlation (AC), introduced in Burset and Guigo (1996), defined as:
 |
where ACP is the average conditional probability defined as:
 |
Since at least two of the conditional probabilities in this formula are always defined, ACP can always be calculated as the average of the one defined. CC and AC range over [-1, 1] and usually are close to each other whenever CC is defined.
Nucleotide level accuracy measures indicate how good the ‘search by content’ element of the program is, but they don't tell us much about the ‘search by signal’ component. For measuring those prediction characteristics, we use exon level prediction accuracy.
Exon Level Accuracy
Exon level prediction is also estimated by sensitivity and specificity, but in this case true positives are exactly predicted exons (identical to an annotated exon). The formulas for exon level sensitivity (ESn) and specificity (ESp) are:
 |
 |
where TE (true exons) is the number of exactly predicted exons and AE and PE are the numbers of annotated and predicted exons, respectively.
Similarly to nucleotide level accuracy, these measures cannot be used alone, and usually their average is used as a reliable measure of a program's exon level accuracy.
Sometimes, knowing just the proportion of the exactly predicted exons may underestimate the performance of the program, especially if its “search by signal” component is weaker. To get a better estimate of the prediction accuracy of the analyzed programs, we also considered other categories of predicted and annotated exons. Predicted exons can be divided into four categories: exactly predicted, partially predicted (only one exon boundary is correctly predicted), overlapped (neither exon boundary is correct, but it overlaps an actual exon), and wrong (does not overlap any actual exon). Analogously, annotated exons can be divided in those that are exactly predicted, partially predicted, overlapped and missed (not overlapped with any predicted exon).
In our tables we present values for:
 |
 |
 |
 |
 |
 |
 |
From the definition of the exon level sensitivity we can see that this measure is not defined when a program does not predict any exons in a sequence. In this case, 0 is assigned to both ESn and ESp, and this sequence will not be considered when calculating the average values for the whole dataset. Even though ESn is defined for every sequence containing actual exons, we do not average it over the sequences for which ESp is not defined, in order to obtain a more realistic relationship between two measures (in real genomic sequences, the sequences without exon prediction would be less common than the sequences without actual exons). On the sequence level, CRa and CRp are identical to ESn and ESp, except that PE = 0 when CRp = 0, but they are averaged over all sequences in the dataset. For this reason we used CRa and CRp as more credible measures when programs were run on the subsets of the dataset and when sequences without predictions could strongly influence the results for ESn and ESp.
Acknowledgments
We are grateful to the authors of the programs tested for making them available, particularly to Martin Reese, who provided us with the results of Genie's prediction on our sequence dataset. We also thank Steven Jones (British Columbia Genome Sequence Center, Vancouver) for useful comments on a draft version of this paper. This work was funded by a Research Grant from the Natural Sciences and Engineering Research Council of Canada to Alan Mackworth.
The publication costs of this article were defrayed in part by payment of page charges. This article must therefore be hereby marked “advertisement” in accordance with 18 USC section 1734 solely to indicate this fact.
Footnotes
E-MAIL: rogic@cse.ucsc.edu; FAX: (831) 459–4046.
Article and publication are at www.genome.org/cgi/doi/10.1101/gr.147901.
REFERENCES
- Altschul SF, Gish W, Miller W, Myers EW, Lipman DJ. Basic local alignment search tool. J Mol Biol. 1990;215:403–410. doi: 10.1016/S0022-2836(05)80360-2. [DOI] [PubMed] [Google Scholar]
- Altschul SF, Madden TL, Schaffer AA, Zhang J, Zhang Z, Miller W, Lipman DJ. Gapped BLAST and PSI-BLAST: A new generation of protein database search programs. Nucleic Acids Res. 1997;25:3389–3402. doi: 10.1093/nar/25.17.3389. [DOI] [PMC free article] [PubMed] [Google Scholar]
- Ashburner M, Mishra S, Roote J, Lewis SE, Blazej R, Davis T, Doyle C, Galle R, George R, Harris N, et al. An exploration of the sequence of a 2.9 Mb region of the genome of Drosophila melanogaster. The Adh region. Genetics. 1999;153:179–219. doi: 10.1093/genetics/153.1.179. [DOI] [PMC free article] [PubMed] [Google Scholar]
- Benson DA, Karsch-Mizrachi I, Lipman DJ, Ostell J, Rapp BA, Wheeler DL. GenBank. Nucleic Acids Res. 2000;28:15–18. doi: 10.1093/nar/28.1.15. [DOI] [PMC free article] [PubMed] [Google Scholar]
- Bernardi G. The isochore organization of the human genome and its evolutionary history — a review. Gene. 1993;135:57–66. doi: 10.1016/0378-1119(93)90049-9. [DOI] [PubMed] [Google Scholar]
- Burge C. Identification of complete gene structure in human genomic DNA. PhD thesis. Stanford, CA: Stanford University; 1997. [Google Scholar]
- Burge C, Karlin S. Prediction of complete gene structure in human genomic DNA. J Mol Biol. 1997;268:78–94. doi: 10.1006/jmbi.1997.0951. [DOI] [PubMed] [Google Scholar]
- Burge C, Karlin S. Finding the genes in genomic DNA. Curr Opin Struc Biol. 1998;8:346–354. doi: 10.1016/s0959-440x(98)80069-9. [DOI] [PubMed] [Google Scholar]
- Burset M, Guigo R. Evaluation of gene structure prediction programs. Genomics. 1996;34:353–367. doi: 10.1006/geno.1996.0298. [DOI] [PubMed] [Google Scholar]
- Claverie J-M. Computational methods for the identification of genes in vertebrate genomic sequences. Hum Mol Genet. 1997;6:1735–1744. doi: 10.1093/hmg/6.10.1735. [DOI] [PubMed] [Google Scholar]
- Cooper PR, Smilinich NJ, Day CD, Nowak NJ, Reid LH, Pearsall RS, Reece M, Prawitt D, Landers J, Housman DE, et al. Divergently transcribed overlapping genes expressed in liver and kidney and located in the 11p15.5 imprinted domain. Genomics. 1998;49:38–51. doi: 10.1006/geno.1998.5221. [DOI] [PubMed] [Google Scholar]
- Dominski Z, Kole R. Selection of splice sites in pre-mRNA with short internal exons. Mol Cell Biol. 1991;11:6075–6083. doi: 10.1128/mcb.11.12.6075. [DOI] [PMC free article] [PubMed] [Google Scholar]
- Dong S, Searls DB. Gene structure prediction by linguistics methods. Genomics. 1994;23:540–551. doi: 10.1006/geno.1994.1541. [DOI] [PubMed] [Google Scholar]
- Dunham I, Shimizu N, Roe BA, Chissoe S, et al. The DNA sequence of human chromosome 22. Nature. 1999;402:489–495. doi: 10.1038/990031. [DOI] [PubMed] [Google Scholar]
- Duret L, Mouchiroud D, Gautier C. Statistical analysis of vertebrate sequences reveals that long genes are scarce in GC-rich isochores. J Mol Evol. 1995;40:308–317. doi: 10.1007/BF00163235. [DOI] [PubMed] [Google Scholar]
- Duret L, Mouchiroud D, Gouy M. HOVERGEN, a database of homologous vertebrate genes. Nucleic Acids Res. 1994;22:2360–2365. doi: 10.1093/nar/22.12.2360. [DOI] [PMC free article] [PubMed] [Google Scholar]
- Fickett JW, Tung C-S. Assessment of protein coding measures. Nucleic Acids Res. 1992;20:6441–6450. doi: 10.1093/nar/20.24.6441. [DOI] [PMC free article] [PubMed] [Google Scholar]
- Fickett JW. The gene identification problem: An overview for developers. Comput Chem. 1996;20:103–118. doi: 10.1016/s0097-8485(96)80012-x. [DOI] [PubMed] [Google Scholar]
- Florea L, Hartzell G, Zhang Z, Rubin GM, Miller W. A computer program for aligning a cDNA sequence with a genomic DNA sequence. Genome Res. 1998;8:967–974. doi: 10.1101/gr.8.9.967. [DOI] [PMC free article] [PubMed] [Google Scholar]
- Gelfand MS, Mironov AA, Pevzner PA. Gene recognition via spliced sequence alignment. Proc Natl Acad Sci. 1996;93:9061–9066. doi: 10.1073/pnas.93.17.9061. [DOI] [PMC free article] [PubMed] [Google Scholar]
- Green P, Lipman D, Hillier L, Waterston R, States D, Claverie JM. Ancient conserved regions in new gene sequences and the protein databases. Science. 1993;259:1711–1716. doi: 10.1126/science.8456298. [DOI] [PubMed] [Google Scholar]
- Guigo R, Knudsen S, Drake N, Smith TF. Prediction of gene structure. J Mol Biol. 1992;226:141–157. doi: 10.1016/0022-2836(92)90130-c. [DOI] [PubMed] [Google Scholar]
- Guigo R, Fickett JW. Distinctive sequence features in protein coding, genic non-coding, and intergenic human DNA. J Mol Biol. 1995;253:51–60. doi: 10.1006/jmbi.1995.0535. [DOI] [PubMed] [Google Scholar]
- Hawkins JD. A survey on intron and exon lengths. Nucleic Acids Res. 1988;16:9893–9908. doi: 10.1093/nar/16.21.9893. [DOI] [PMC free article] [PubMed] [Google Scholar]
- Huang X, Adams MD, Zhou H, Kerlavage AR. A tool for analyzing and annotating genomic sequences. Genomics. 1997;46:37–45. doi: 10.1006/geno.1997.4984. [DOI] [PubMed] [Google Scholar]
- Karlin S, Taylor HM. A first course in stochastic processes. San Diego, CA: Academic Press Inc.; 1975. [Google Scholar]
- Krogh A. Two methods for improving performance of an HMM and their application for gene-finding. In: Gaasterland T, et al., editors. Proceedings of the Fifth International Conference on Intelligent Systems for Molecular Biology. Menlo Park, CA: AAAI Press; 1997. pp. 179–186. [PubMed] [Google Scholar]
- Kulp D, Haussler D, Reese MG, Eeckman FH. A generalized hidden Markov model for the recognition of human genes in DNA. In: States D, et al., editors. Proceedings of the Fourth International Conference on Intelligent Systems for Molecular Biology. Menlo Park, CA: AAAI Press; 1996. pp. 134–142. [PubMed] [Google Scholar]
- Lopez R, Larsen F, Prydz H. Evaluation of the exon predictions of the GRAIL software. Genomics. 1994;24:133–136. doi: 10.1006/geno.1994.1590. [DOI] [PubMed] [Google Scholar]
- Lukashin AV, Borodovsky M. GeneMark.hmm: New solutions for gene-finding. Nucleic Acids Res. 1998;26:1107–1115. doi: 10.1093/nar/26.4.1107. [DOI] [PMC free article] [PubMed] [Google Scholar]
- Mironov AA, Ficket JW, Gelfand MS. Frequent alternative splicing of human genome. Genome Res. 1999;9:1288–1293. doi: 10.1101/gr.9.12.1288. [DOI] [PMC free article] [PubMed] [Google Scholar]
- Oliver SG, van der Aart Q J, Agostoni-Carbone ML, Aigle M, Alberghina L, Alexandraki D, Antoine G, Anwar R, Ballesta JP, Benit P, et al. The complete DNA sequence of yeast chromosome III. Nature. 1992;357:38–46. doi: 10.1038/357038a0. [DOI] [PubMed] [Google Scholar]
- Rabiner L. A tutorial on hidden Markov models and selected applications in speech recognition. Proc IEEE. 1989;77:257–285. [Google Scholar]
- Salamov AA, Nishikawa T, Swindells MB. Accessing protein coding region integrity in cDNA sequencing projects. Bioinformatics. 1998;14:384–390. doi: 10.1093/bioinformatics/14.5.384. [DOI] [PubMed] [Google Scholar]
- Salzberg S, Delcher A, Fasman K, Henderson J. A decision tree system for finding genes in DNA. J Comp Biol. 1998;5:667–680. doi: 10.1089/cmb.1998.5.667. [DOI] [PubMed] [Google Scholar]
- Schuler GD, Epstein JA, Ohkawa H, Kans JA. Entrez: Molecular biology database and retrieval system. Methods Enzymol. 1996;266:141–162. doi: 10.1016/s0076-6879(96)66012-1. [DOI] [PubMed] [Google Scholar]
- Schulz RA, Butler BA. Overlapping genes of Drosophila melanogaster: Organization of the z600-gonadal-Eip28/29 gene cluster. Genes & Dev. 1989;3:232–242. doi: 10.1101/gad.3.2.232. [DOI] [PubMed] [Google Scholar]
- Snyder EE, Stormo GD. Identification of protein coding regions in genomic DNA. J Mol Biol. 1995;248:1–18. doi: 10.1006/jmbi.1995.0198. [DOI] [PubMed] [Google Scholar]
- Solovyev VV, Salamov AA, Lawrence CB. Identification of human gene structure using linear discriminant functions and dynamic programming. In: Rawling C, et al., editors. Proceedings of the Third International Conference on Intelligent Systems for Molecular Biology. Menlo Park, CA: AAAI Press; 1995. pp. 367–375. [PubMed] [Google Scholar]
- Wieringa B, Hofer E, Weissmann C. A minimal intron length but no specific internal sequence is required for splicing the large rabbit B-globin intron. Cell. 1984;37:915–925. doi: 10.1016/0092-8674(84)90426-4. [DOI] [PubMed] [Google Scholar]
- Wilson R, Ainscough R, Anderson K, Baynes C, Berks M, Bonfield J, Burton J, Connell M, Copsey T, Cooper J, et al. 2.2 Mb of contiguous nucleotide sequence from chromosome III of C. elegans. Nature. 1994;368:32–38. doi: 10.1038/368032a0. [DOI] [PubMed] [Google Scholar]
- Xu Y, Einstein JR, Mural RJ, Shah M, Uberbacher EC. An improved system for exon recognition and gene modeling in human DNA sequences. In: Altman R, et al., editors. Proceedings of the Second International Conference on Intelligent Systems for Molecular Biology. Menlo Park, CA: AAAI Press; 1994. pp. 376–384. [PubMed] [Google Scholar]
- Zhang I. Protein-length distributions for the three domains of life. Trends Genet. 2000;16:107–109. doi: 10.1016/s0168-9525(99)01922-8. [DOI] [PubMed] [Google Scholar]
- Zhang MQ. Identification of protein coding regions in the human genome by quadratic discriminant analysis. Proc Natl Acad Sci. 1997;94:565–568. doi: 10.1073/pnas.94.2.565. [DOI] [PMC free article] [PubMed] [Google Scholar]
- Zoubak S, Clay O, Bernardi G. The gene distribution of the human genome. Gene. 1996;174:95–102. doi: 10.1016/0378-1119(96)00393-9. [DOI] [PubMed] [Google Scholar]