Abstract

Glycogen is a highly branched glucose polymer functioning as a glucose buffer in animals. Multiple-detector size exclusion chromatography and fluorophore-assisted carbohydrate electrophoresis were used to examine the structure of undegraded native liver glycogen (both whole and enzymatically debranched) as a function of molecular size, isolated from the livers of healthy and db/db mice (the latter a type 2 diabetic model). Both the fully branched and debranched levels of glycogen structure showed fundamental differences between glycogen from healthy and db/db mice. Healthy glycogen had a greater population of large particles, with more α particles (tightly linked assemblages of smaller β particles) than glycogen from db/db mice. These structural differences suggest a new understanding of type 2 diabetes.
Introduction
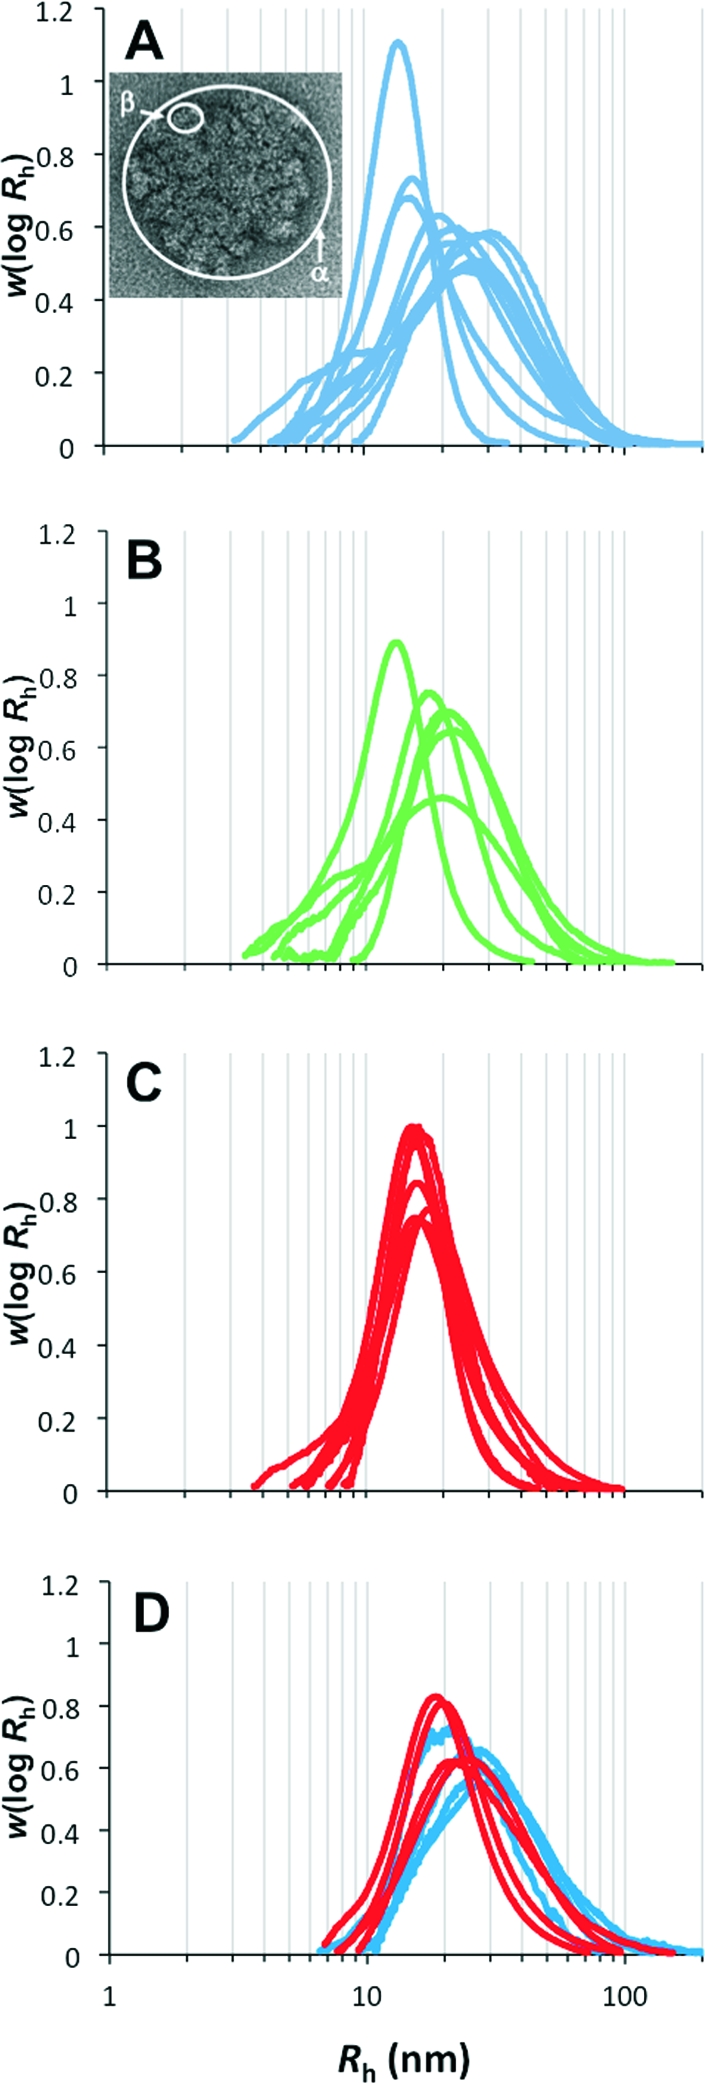
Glycogen is a complex branched polymer of glucose, with α-(1,4) linear linkages and α-(1,6) branching linkages and a broad distribution of molecular weights, ∼106–108 Da. Its structure comprises different hierarchical levels, from the individual branches to the whole (branched) molecules that are arranged as β particles (∼20 nm in size) and further into larger α particles (∼102 nm in size) in the liver.1,2 This is exemplified in the transmission electron micrograph in Figure 1A (obtained using the techniques of Ryu et al.(3)).
Figure 1.

SEC weight distributions of mouse-liver glycogen from various individual adult healthy (db/+, blue, A; +/+, green, B) and adult type 2 diabetic/obese (db/db, red, C) mice and from various individual young db/db mice (which would later have become diabetic; red) and young db/+ mice (which would not have become diabetic later; blue) mouse-liver glycogen (D). The normalization of these distributions is arbitrary and for convenience is chosen so that their areas are unity. Identification of individual mice are given in the Supporting Information. Inserted in part A is a transmission electron micrograph of mouse liver glycogen showing α and β particles. The diameter of the α particle in the micrograph is ∼150 nm.
The incidences of type 2 diabetes and of obesity are increasing dramatically worldwide. The basic characteristic of diabetes is hyperglycemia: uncontrolled high glucose levels in the blood. Liver glycogen acts as a blood-glucose buffer, being synthesized in the liver when blood-glucose levels are high and quickly degraded when blood-glucose levels are low, releasing glucose into the blood.(4) This Communication uses advanced polymer characterization methods to examine structural differences between liver glycogen from db/db (a type-2 diabetic model) and from healthy (+/+ and db/+) mice. The techniques used yield (i) the so-called SEC weight distribution w(log Rh) of whole (branched) molecules as functions of size (hydrodynamic radius Rh), where w(log Rh) is the relative mass of whole glycogen molecules whose size is given by log Rh, (ii) the weight-average molecular weight (M̅w) of the whole glycogen molecules, and (iii) the number distribution Nde(X) of individual branches following quantitative degradation of the glycogen with debranching enzyme (the “chain-length distribution” (CLD) giving the relative number of individual branches for each degree of polymerization X). The normalizations of w(log Rh) and Nde(X) are arbitrary. For a review of these distributions, see, for example, ref (5). Characterization of the branched molecules is performed by size exclusion chromatography (SEC) with differential refractive index detection, giving w(log Rh), and multiple-angle laser light scattering detection (MALLS), which after integration of the signal over Rh yields M̅w. The SEC separation parameter is hydrodynamic volume Vh, with hydrodynamic radius Rh from Vh = 4/3πRh3. CLDs of the branches were obtained using fluorophore-assisted carbohydrate electrophoresis(6) (FACE).
Materials and Methods
Genetically diabetic C57BL/6J-db/db female mice were used in this study as a model for type 2 diabetes. The recessive diabetic (db) gene has a point mutation in the leptin receptor,(7) making db/db mice susceptible to suffer from obesity, transient hyperglycemia, hyperinsulinemia, and hyperglucagonemia.8−10 Female mice that were heterozygous for the db gene (db/+), containing one wild-type and one mutated allele, and homozygous with both wildtype alleles (+/+) were also analyzed. Three age groups were used in this study. Adult mice were aged ∼3 and 4.5 months, and young mice were aged ∼1.5 months. Physiological characteristics of the different animal groups are given in the Supporting Information (Table S1). All animal studies were performed in compliance with the ethics committee of Wuhan University.
The procedure used here for liver-glycogen extraction and purification without molecular degradation has been previously described.(3) The SEC procedures, as detailed elsewhere,(11) used (methylsulfinyl)methane (dimethyl sulfoxide, DMSO) and LiBr as solvent and eluent; this ensures complete and molecularly dispersed dissolution. SEC flow rates were such that shear scission of glycogen (which is a relatively small molecule) was not a major effect.(12) SEC recovery measured with starch in a similar system is essentially 100%.(13) Enzymatic debranching and labeling for FACE were performed using an established method.(6) FACE separation and detection used an Applied Biosystems (ABS, Foster City, CA) 3730 genetic analyzer with a 50 cm capillary array. Labeled debranched mouse glycogen samples were diluted by a factor of 104, and 20 μL of each sample was loaded in each well. Samples were injected for 3 s and then electrophoresed using 3730 buffer with EDTA (ABS) for a period of 5000 s at a voltage of 15 kV and a current of 400 mA. Data were collected using Data Collection v3.0 software and were analyzed using GeneMapper v3.7 software. The detection system was calibrated using the ABS G5 dye set.
Results
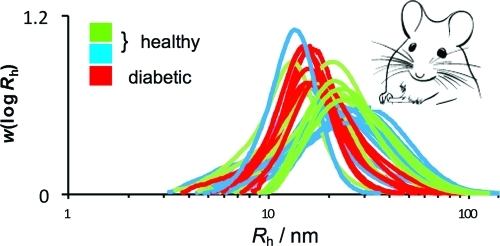
Figure 1A–C compares the SEC weight distributions of liver glycogen from adult type 2 diabetic (db/db) and healthy mice (db/+ and +/+); because of SEC calibration limitations, the Rh axis above ∼50 nm is only semiquantitative.(12) Significant differences are seen between the size distributions of liver glycogen from healthy mice compared with those from type 2 diabetic mice (db/db). These diabetic/obese glycogen particles are never as large as the largest nondiabetic glycogen and are narrowly distributed, with a size range corresponding largely but not exclusively to that of β particles. Healthy glycogen, however, covers a larger size range, including many samples with a high population in the region corresponding to α particles.
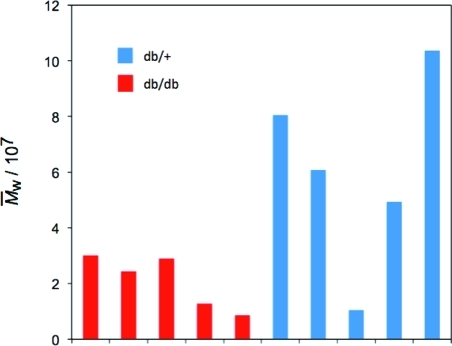
Figure 2 compares the M̅w values of liver glycogen from healthy (db/+) and diabetic (db/db) mice aged 3 months. It is seen that adult db/db mouse liver consists of glycogen molecules that have M̅w ≈ 107 Da, a typical molecular weight for β particles. However, db/+ (healthy) mouse liver glycogen can contain much larger particles, with M̅w as large as ∼10 times that of typical β particles (the latter exemplified in Figure 4 of Sullivan et al.(11)), indicating that there is a significant number of α particles. Consistent with Figure 1, db/+ glycogen also shows a much greater range of average M̅w values, with one sample having M̅w ≈ 107 Da, corresponding to the molecular weight of β particles.
Figure 2.
M̅w values of mouse liver glycogen from various individual healthy (db/+, in blue) and type 2 diabetic (db/db, in red) mice aged 3 months. Identification of individual mice in the Supporting Information (Figure S4).
The mice in this study had free access to food and water at all times. Each size distribution therefore effectively is a snapshot at different times after feeding. Healthy mouse livers have some distributions containing a high proportion of large molecules and others primarily of small molecules. Glycogen isolated from db/db mice has little variation between samples, suggesting that large α particles are unable to form. This difference between healthy and diabetic/obese mice, as evaluated by the values of Rh at the maximum in each distribution and by the values of M̅w, is statistically valid (P < 0.05). All results were expressed as the mean ± standard deviation, with statistical significance evaluated with the nonparametric Kruskal–Wallis test, followed by the Mann–Whitney test (Supporting Information).
In principle, this difference in glycogen from db/db and healthy mice, inferred from the SEC distributions, could be verified by quantitative electron microscopy. However, in practice, this is not straightforward. To avoid artifacts, quantification of size distributions in heterogeneous systems from transmission electron microscopy, even in simple systems such as polymer colloids, requires thousands of particles in a large number of individual images chosen randomly on the TEM grid.(14) Quantitative transmission electron microscopy of these glycogen systems is a significant area for future work.
The db/db mice used in this study are genetically modified to express a malfunctioning leptin receptor (which governs satiety) and therefore become obese. Figure 1D shows the SEC weight distributions of young (1.5 months old) db/db and db/+ mice. This experiment was performed to see if the changes in glycogen structure observed in db/db mice occur before the onset of type 2 diabetes/obesity or are due to the change of leptin receptor per se. The young db/db mice would have become diabetic as they grew older but were not diabetic at the time of sacrifice.
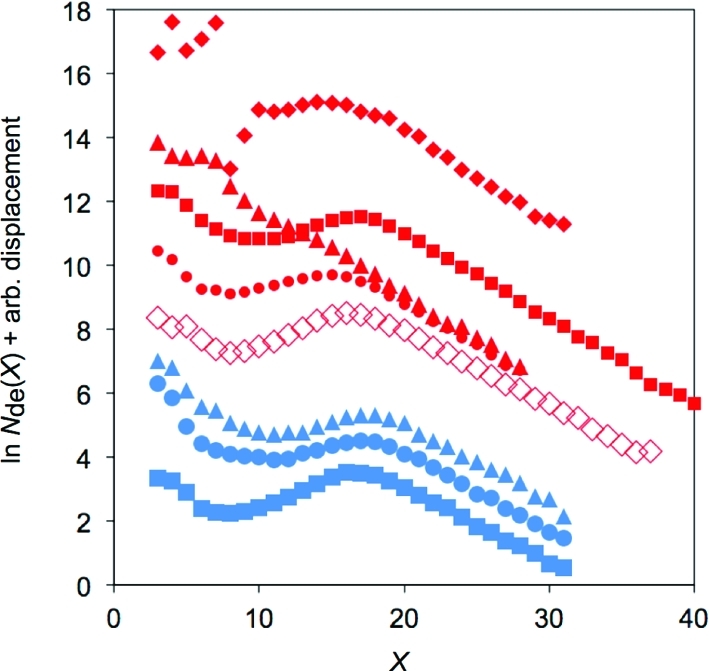
Figure 3 shows the chain-length distributions of adult db/db and db/+ mouse-liver glycogen at the age of 3 months. Contamination of glycogen by small oligosaccharides at DP X below ∼10 prevented the comparison of smaller chain lengths. The slopes of the clearly linear regions over the range 18 ≤ X ≤ 27 are −0.27 ± 0.03 for db/db and −0.23 ± 0.009 for db/+. This observation that the absolute values of the slopes of healthy glycogen branches for high DP are very slightly less than those of db/db suggests that healthy glycogen contains a slightly higher proportion of large chains than db/db (for example,(15) that the relative number of branches between, say, 20 ≤ X ≤ 30, is slightly less than that above 30 for healthy compared with db/db).
Figure 3.

Chain-length distributions of db/+ (blue) and db/db (red) mouse-liver glycogen from FACE. The normalization of the distributions is arbitrary, and, for visual clarity, these have been chosen to give adequate vertical separation of each ln Nde(X). Identification of individual mice in the Supporting Information.
Discussion
The results indicate that before the onset of the physiological conditions associated with db/db mice, such as obesity and high blood-glucose levels, large glycogen molecules (including α particles) are still able to form. This suggests that the structural differences between glycogen in db/db compared with healthy mice arise from physiological changes associated with obesity, type 2 diabetes, or both and not simply from the leptin receptor mutation.
The nature of the (sub)structures of α and β particles and the nature of the bond between the β particles in α particles has not yet been elucidated. The basic glycogen synthesis enzymes are the primer (which for animals is glycogenin), glycogen synthase, and glycogen branching enzyme. A qualitatively similar α particle structure is seen in both (animal) liver glycogen and (plant) phytoglycogen,(2) suggesting that whatever the binding is, it may arise from these basic glycogen synthesis enzymes rather than (as we had previously suggested(11)) from some additional enzyme present in hepatocytes. There are indications(11) that the bond between the β particles in α particles is probably chemical; in the same study, theoretical fitting to the same type of size distributions as determined here indicated that α particles comprise randomly linked assemblages of β particles. It has been suggested from simulation that glycogen is arranged in tiers and that these are self-limiting in size beyond 12 tiers.(16) This would provide a mechanism for the assembly of α particles if new β subunits were formed by a budding process arising from this self-limiting step; however, this hypothesis also implies that the number size distribution of β particles in systems without α particles should show a maximum corresponding to this size, but this is not observed experimentally.(11) The mechanism for the formation of α particles is thus not yet clear.
One possible reason that type 2 diabetic mice are not able to form large α particles may be due to an increase in primer (glycogenin) levels. Overexpression of glycogenin in rat-1 fibroblasts does not increase the overall glycogen content but results in a distribution of smaller glycogen particles.(17)
Conclusions
The data indicate that the synthesis of larger α particles of glycogen is impaired in livers of adult db/db mice; support for this inference can be discerned in previous size data obtained by sucrose density centrifugation,(18) although that technique cannot give quantitative size distributions.
This result can be rationalized as follows. The α particles comprise tightly linked β particles, and the space between these linked β particles is significantly less than that typical of enzymes. This compact structure and large size would be likely to result in slower glucose release (per monomer unit) under hypoglycemic conditions than would the smaller β particles, which are more accessible per monomer unit to the glycogen degradation enzymes. (Note that this concerns glycogen degradation, not its synthesis, which creates the particles in the first place.) Rapid glucose release is desirable in the muscles, wherein the glycogen is composed entirely of β particles but can lead to hyperglycemia if poorly controlled, which is likely to be the case when the slow-release mechanism of α particles in the liver is impaired. This poor glucose control can impact the uncontrolled hyperglycemia that typifies diabetes.
The observation of impaired α-particle formation in db/db mice is statistically valid in the data set given here, which has fundamental physiological implications in glycogen biosynthesis/degradation cycles. There is a long list of experiments that should be undertaken to explore this result, including: increasing the number of samples for higher statistical confidence; performing measurements with sacrifices at controlled feeding quantities and times; examining the correlation of type 2 diabetes with glycogen structure by using other type 2 diabetic models such as a high-fat-diet induced type 2 diabetic mouse model; performing corresponding experiments with Akita mice and other type 1 diabetic mouse models; and comparing the levels of glycogenin and other enzymes involved in glycogen synthesis and degradation in type 2 diabetic, type 1 diabetic, and nondiabetic mouse liver.
Acknowledgments
We acknowledge support from the Australian Research Council (DP0986043 and DP0985694), the National Basic Research Program of China (2009CB918304), and the Chinese 111 project (B06018) (China). We also acknowledge Daniel Tang and Dr. Jovin Hasjim for their technical support with SEC experiments. F.V. acknowledges a postdoctoral fellowship from the Knut and Alice Wallenberg Foundation (Sweden).
Supporting Information Available
Details of individual mice, experiments, and the statistical treatment. This material is available free of charge via the Internet at http://pubs.acs.org.
Supplementary Material
References
- Takeuchi T.; Iwamasa T.; Miyayama H. J. Electron Microsc. 1978, 27, 31–38. [PubMed] [Google Scholar]
- Putaux J.-L.; Buleon A.; Borsali R.; Chanzy H. Int. J. Biol. Macromol. 1999, 26, 145–150. [DOI] [PubMed] [Google Scholar]
- Ryu J.-H.; Drain J.; Kim J. H.; McGee S.; Gray-Weale A.; Waddington L.; Parker G. J.; Hargreaves M.; Yoo S.-H.; Stapleton D. Int. J. Biol. Macromol. 2009, 45, 478–482. [DOI] [PubMed] [Google Scholar]
- Newsholme E. A.; Start C.. Regulation of Metabolism; Wiley: New York, 1974. [Google Scholar]
- Gilbert R. G. Anal. Bioanal. Chem. 2011, 399, 1425–1438. [DOI] [PubMed] [Google Scholar]
- O’Shea M. G.; Samuel M. S.; Konik C. M.; Morell M. K. Carbohydr. Res. 1998, 307, 1–12. [Google Scholar]
- Chen H.; Charlat O.; Tartaglia L. A.; Woolf E. A.; Weng X.; Ellis S. J.; Lakey N. D.; Culpepper J.; Moore K. J.; Breitbart R. E.; Duyk G. M.; Tepper R. I.; Morgenstern J. P. Cell 1996, 84, 491–495. [DOI] [PubMed] [Google Scholar]
- Roesler W. J.; Khandelwal R. L. Diabetes 1985, 34, 395–402. [DOI] [PubMed] [Google Scholar]
- Sharma K.; McCue P.; Dunn S. R. Am. J. Physiol. 2003, 284, F1138–F1144. [DOI] [PubMed] [Google Scholar]
- Hummel K. P.; Coleman D. L.; Lane P. W. Biochem. Genet. 1972, 7, 1–13. [DOI] [PubMed] [Google Scholar]
- Sullivan M. A.; Vilaplana F.; Cave R. A.; Stapleton D. I.; Gray-Weale A. A.; Gilbert R. G. Biomacromolecules 2010, 11, 1094–1100. [DOI] [PubMed] [Google Scholar]
- Cave R. A.; Seabrook S. A.; Gidley M. J.; Gilbert R. G. Biomacromolecules 2009, 10, 2245–53. [DOI] [PubMed] [Google Scholar]
- Tizzotti M. J.; Sweedman M. C.; Tang D.; Schaeffer C.; Gilbert R. G. J. Ag. Food Chem., submitted. [DOI] [PubMed]
- Lichti G.; Hawkett B. S.; Gilbert R. G.; Napper D. H.; Sangster D. F. J. Polym. Sci., Polym. Chem. Ed. 1981, 19, 925–938. [Google Scholar]
- Castro J. V.; Dumas C.; Chiou H.; Fitzgerald M. A.; Gilbert R. G. Biomacromolecules 2005, 6, 2248–2259. [DOI] [PubMed] [Google Scholar]
- Melendez R.; Melendez-Hevia E.; Mas F.; Mach J.; Cascante M. Biophys. J. 1998, 75, 106–114. [DOI] [PMC free article] [PubMed] [Google Scholar]
- Skurat A. V.; Lim S.-S.; Roach P. J. Eur. J. Biochem. 1997, 245, 147–155. [DOI] [PubMed] [Google Scholar]
- Roesler W. J.; Pugazhenthi S.; Khandelwal R. L. Mol. Cell. Biochem. 1990, 92, 99–106. [DOI] [PubMed] [Google Scholar]
Associated Data
This section collects any data citations, data availability statements, or supplementary materials included in this article.


