

Abstract
The circadian clocks keeping time in many living organisms rely on self-sustained biochemical oscillations entrained by external cues, such as light, to the 24-h cycle induced by Earth's rotation. However, environmental cues are unreliable due to the variability of habitats, weather conditions, or cue-sensing mechanisms among individuals. A tempting hypothesis is that circadian clocks have evolved so as to be robust to fluctuations in the signal that entrains them. To support this hypothesis, we analyze the synchronization behavior of weakly and periodically forced oscillators in terms of their phase response curve (PRC), which measures phase changes induced by a perturbation applied at different times of the cycle. We establish a general relationship between the robustness of key entrainment properties, such as stability and oscillator phase, on the one hand, and the shape of the PRC as characterized by a specific curvature or the existence of a dead zone, on the other hand. The criteria obtained are applied to computational models of circadian clocks and account for the disparate robustness properties of various forcing schemes. Finally, the analysis of PRCs measured experimentally in several organisms strongly suggests a case of convergent evolution toward an optimal strategy for maintaining a clock that is accurate and robust to environmental fluctuations.
Introduction
Circadian entrainment is the process by which a biological clock with a free-running period of ∼24 h is synchronized to environmental cycles associated with Earth's rotation. A stable and precise phase relationship between internal and external times is vital for organisms that need to coordinate their physiology to diurnal environmental changes such as those induced by dawn and dusk. In particular, a precise clock has been shown to optimize cell growth and fitness in phototrophic organisms like cyanobacteria or plants (1–3).
However, circadian clock precision is challenged by many sources of intrinsic and extrinsic variability, which can adversely affect the regularity of endogenous biochemical oscillations. Therefore, there is a growing interest in investigating how the period and amplitude of these oscillations are affected by genetic mutations (4), molecular noise (5–8), or contextual variability (7,9), and this has led to a search for design principles that will ensure robust oscillatory behavior in circadian clocks (10–12).
Nevertheless, a robust endogenous clock does not by itself guarantee a precise phase relationship with the day-night cycle, since the environmental cues associated with the diurnal changes also fluctuate significantly. The daylight intensity and quality sensed by an organism depend on various environmental factors, such as meteorological conditions, shade habitats, or, for marine organisms, the distance to sea surface and water turbidity (13,14). In addition, variations of the behavior and light-sensing abilities of individuals can also alter the light signal reaching their core molecular clock. This is why individuals of the same species living in different places or times can experience a wide spectrum of light intensities, raising the question of whether and how specific robustness strategies are implemented in their clock architectures to maintain a precise synchronization despite unreliable environmental cues. Although the importance of this problem was noted some time ago (15), the robustness of circadian clocks to daylight fluctuations, and how this constraint shapes their molecular architecture, have been little studied until quite recently (16–18). These recent computational studies have revealed disparate robustness capabilities depending on the clock model, which remains to be explained by a more comprehensive approach.
A natural theoretical framework to address this question is the phase response curve (PRC) theory, which results from describing the oscillator dynamics by a single phase using powerful reduction methods (19,20). The PRC and its infinitesimal counterpart determine the oscillator's phase shift induced by a perturbation applied at some phase of the cycle. This theory has led to many important results in the study of synchronization in neural networks ((21) and references therein). For instance, the shape of the neuronal PRC determines whether coupled neurons synchronize or not (22–25), or how uncoupled neurons subjected to correlated input synchronize (26,27). More recently, phase reduction methods have been applied to study unidirectional synchronization of circadian clocks to the diurnal cycle (10,28), where the driving light cycle modulates a few control parameters of the regulatory network such as transcription or degradation rates. In circadian biology, as in neurosciences, PRC theory is the key to understanding how the PRC shape controls synchronization and how it is implemented at the biophysical level. However, results obtained in one field cannot be transposed directly to the other, because biological issues may not be the same. In neural networks, synchronization is a collective process and the dynamical behavior is highly complex. In contrast to this, the purpose of circadian clocks is to generate a perfectly periodic waveform when driven by a forcing cycle with high-amplitude fluctuations but very reproducible timing, following the rhythmic succession of dawns and dusks.
In this article, we follow previous PRC-based approaches and extend them to investigate how a circadian oscillator can maintain a stable synchronization and phase relationship with a forcing cycle that exhibits significant variability. A key point is that our analysis applies simultaneously to several types of fluctuations that are important for circadian clocks. Our approach is designed to investigate the effect of static differences that may exist between the light input perceived by different individuals because of geographic or genetic variations. This approach can nevertheless capture the effect of dynamic variations in average daylight intensity between successive days (17), provided the oscillator is relaxed to the nominal limit cycle quickly enough.
In the following, we first lay out the theoretical approach within which we can define two quantities measuring robustness of the entrained state with respect to forcing fluctuations. The phase approximation in the weak forcing limit allows us to identify the shape properties of the PRC that contribute to the robustness and precision of the clock phase in the presence of fluctuations in the forcing amplitude. We consider fluctuations in both the average intensity and the daylight temporal profile, which lead to different effects. The general criteria obtained are shown to explain and predict the robustness properties of biologically based circadian models. Finally, we show how these criteria are satisfied by PRCs that have been measured experimentally in several organisms, which supports the idea that living organisms have evolved salient strategies to maintain an accurate clock that is robust to daylight fluctuations.
Results
Circadian clock entrainment and robustness metrics
The entrainment of circadian clocks by cyclic environmental changes is a paradigmatic example of a unidirectional synchronization process. It involves a network of genes and proteins interacting with each other (29), whose temporal evolution is usually modeled by a set of ordinary differential equations,
| (1) |
where bold indicates vector quantities and the components of vector X are the concentrations of the molecular actors interacting according to the biochemical kinetics F, derived from the law of mass action. Synchronization of the circadian clock to the diurnal cycle requires that some components of the kinetic parameter vector are sensitive to temporal changes of light induced by the cycle. In this article, we assume that the light specifically modulates one parameter so that it differs from its value in the dark, , according to
| (2) |
where the perceived light intensity is described by an amplitude ε and a normalized temporal profile L. The latter depends on , where is time measured from dawn time, td, and T is the 24-h day/night cycle length. In day/night entrainment conditions, the light sensed by the organism is assumed to be restricted to daytime of duration τD: for . In this work, an important point is that ε and L can differ between individuals depending on environmental or physiological context.
The existence of endogenous circadian oscillations implies that Eq. 1 parameterized by in the absence of light has an asymptotically stable limit-cycle solution, , characterized by a free-running period (FRP), T0. The light-dependent perturbation deviates the circadian oscillator from its free limit-cycle trajectory during daytime. If the amplitude deviation is not too large, the stability of the limit cycle ensures that the deviation decays in the absence of perturbation (during night), with the only memory of the past perturbation being a residual phase change. Thus, the Poincaré map of the dynamical system described by Eq. 1 can be approximated by the unidimensional map (10),
| (3) |
where is the oscillator phase at which the light-dependent perturbation is switched on in the nth day (i.e., the oscillator phase at dawn). In the following, the phase is expressed in circadian hour units (abbreviated as ch) ranging between 0 and 24 ch, where 1 ch = h and is measured relative to an arbitrary reference. γ is the phase difference associated with the period mismatch between the forcing and endogenous periods and is therefore equal (in ch) to . is the phase change induced by the perturbation given by Eq. 2 when it is applied at oscillator phase and is known in the literature as a phase response curve (PRC) (20). The mapping G has a fixed point if there exists a phase, , that satisfies . Hereafter, we call the oscillator phase. The stability of the fixed point is determined by the slope of the PRC at a fixed point, , which is termed the stability coefficient and which quantifies how fast perturbations around grow or decay. The fixed point is stable if . This corresponds to the 1:1 synchronization state, which is phase-locked to the day-night cycle with an oscillator phase, .
The objective of this study is to determine how the key clock entrainment properties and χ vary with fluctuations in the daylight forcing. We therefore consider fluctuations as small changes of daylight intensity around some average value,
| (4) |
where and L0 and are appropriately normalized (see the Supporting Material) and η, the fluctuation amplitude, is small compared to 1. Since the PRC becomes an implicit function of η, it follows that as long as the stable fixed point exists, its position, , and its stability coefficient, , depend on η (Fig. 1). For the entrainment state to remain stable in different light-amplitude regimes, these quantities should vary as little as possible with η. This requirement can be captured by two complementary sensitivity measures, Π and Σ, which are the normalized variance of and the normalized relative variance of χ, respectively, in response to small daylight fluctuations of randomly distributed amplitudes (see the Supporting Material):
| (5) |
Figure 1.
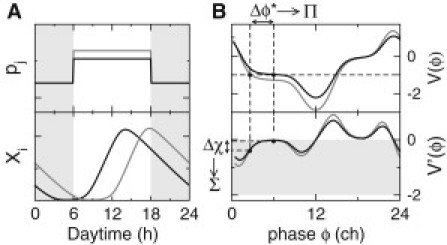
Measures of clock robustness to daylight fluctuations. (A) Example of two distinct daylight profiles (upper, black and gray lines) leading to different phase relations between the oscillator and the light-driving cycle (lower). The shaded area corresponds to night. (B, upper) Plot of PRC- values for the two profiles shown in A, measuring the phase changes induced by the two daylight perturbations when applied at different phases of the free-running cycle (measured in ch). The fixed points, , in the entrained states satisfy (= –1in this example). The variation, , of the oscillator phase associated with small changes in the PRC is characterized by the sensitivity measure, Π. (B, lower) Plot of the derivatives, , of the two PRCs. The shaded area corresponds to stable entrainment, corresponding to . The relative variation, , associated with small changes in the PRC is characterized by the sensitivity measure Σ.
Note that Π and Σ characterize the stable fixed point of the mapping. This approach therefore assumes that fluctuations do not drive the system too far from this fixed point. This is a reasonable assumption when the characteristic timescale of fluctuations is larger than the relaxation time toward the fixed point. If the fixed point is not too close to marginal stability, this condition is easily satisfied when considering the effect of slow changes of weather, habitat, genotype, or phenotype, even moreso for variations in the forcings applied to different individuals, since the perturbation is static in this case.
How the PRC determines clock robustness in the weak forcing limit
The sensitivity measures Π and Σ can be related to the changes of the PRC in response to small variations in the amplitude and temporal profile of the forcing scheme (see Fig. 1 B). In the limit of weak forcing, where the light-stimulus amplitude is small and the FRP is close to the forcing period ( and ), phase reduction techniques (19) apply. The PRC can thus be derived from an infinitesimal impulse PRC (IPRC), , according to a convolution integral, with the important property that it scales linearly with light-stimulus amplitude ε (10,28) (see the Supporting Material):
| (6) |
The IPRC, , indicates the steady-state phase response of the circadian oscillator when it receives an infinitesimal delta-impulse light stimulus at the oscillator phase, ϕ.
In the phase approximation framework, Σ and Π can be expressed in a simple manner as a function of PRC characteristics. In the following, we investigate the robustness with respect to two complementary types of natural daylight fluctuations, namely changes in 1), the average daylight amplitude and 2), the daylight temporal profile, respectively.
Considering changes in average light intensity is simple: Their effect on the phase variance is easily derived from the fact that is constant, yielding (see the Supporting Material). Entrainment stability is affected in a more subtle manner. We find that Σ can be expressed in terms of the second derivative, , of the PRC measured at the fixed point when unperturbed (see the Supporting Material):
| (7) |
If the period mismatch, γ, or the second derivative, , are zero, Σ=1. Lower (larger) values of Σ associated with an extended (reduced) stability domain of the entrainment state imply (). Thus, robustness requires a PRC that is convex near the fixed point when the FRP is larger than the forcing period, and concave in the opposite case.
Changes in the daylight temporal profile, unlike those in the average daylight intensity, tend to be uncorrelated from day to day, thus perturbing preferentially the oscillator phase, , without destabilizing the entrainment state. Variability in the oscillator phase is given by Π, which can then be expressed as (see the Supporting Material)
| (8) |
which involves both the IPRC, Z, and its derivative, Z′. Low values of Π are achieved by minimizing the ratio between the two integrals, which constrains the function Z. The numerator of Π in Eq. 8 can be minimized for arbitrary light input profile fluctuations, , when Z is constant and null over the coupling interval . In contrast to this, maximizing the denominator of Π in Eq. 8 typically requires that Z vary (decrease) significantly over so that the modulus of derivative is large. An optimal compromise between these two requirements is reached when the IPRC, Z, is null for a large portion of the coupling interval but displays fast decreases at the beginning and end of the interval, where phase advances or delays occur, so that the null interval (commonly called a dead zone) is slightly smaller than the coupling interval. Besides Π, quantities Πk, characterizing variance of the oscillator phase with respect to sinusoidal fluctuations of random phases, can also be defined (see the Supporting Material).
Robustness to daylight fluctuations in a minimal model of circadian oscillator
In the previous section, we have derived and discussed two specific expressions of Π and Σ, associated with fluctuations in daylight temporal profile and average daylight intensity, respectively. These expressions are relevant for any nonlinear oscillator subjected to weak enough forcing. In this section, we check whether these criteria still apply for a minimal circadian oscillator model in which coupling to light can be nonnegligible, such that the weak forcing approximation is not necessarily valid. In most organisms, endogenous clock oscillations appear to rely on a core negative feedback loop, inside which a clock gene encodes proteins that activate (inactivate) its own transcriptional repressor (activator) (29). The presence of delays or nonlinearities along the loop favors the emergence of oscillations in this autoregulatory loop (30,31). This basic clock architecture can be captured in low-dimensional dynamical models such as the one originally proposed by Leloup and Goldbeter for the Neurospora clock (32): a gene sequence is transcribed into mRNA (M), which translates into a protein in the cytoplasm (Pc), and is further translocated in the nucleus (PN), where it inactivates the gene:
| (9) |
The Michaelis-Menten-like kinetics used to describe transcription and degradation dynamics is required for the appearance of spontaneous oscillations. We use the following model parameters, which give rise to 24-h oscillations in the dark: n = 4, sM = 2.2, KI = 1.8, dM = 0.84, KM = 0.5, sP = 0.4, dP = 1.6, kP = 0.13, k1 = 0.4, k2 = 0.45, . The effect of light is to modify one or several parameters during a time interval τD and with gain ε as in Eq. 2. To investigate the influence of a mismatch between the forcing period T = 24 h and the FRP T0, the latter is varied by changing the time constant τ ().
To illustrate our analysis, we have selected two light-coupling schemes on the basis of their IPRCs, so that they provide us with examples of robust and nonrobust entrainment with respect to daylight fluctuations. These two schemes consist of the activation or repression of transcription by light, corresponding to an increase or a decrease of the same parameter, sM, during daytime.
Fig. 2 shows that these two forcing schemes significantly differ in the sensitivity of the stability coefficient, χ, to variations in average light intensity, as we can anticipate from their PRCs measured with weak daylight perturbations. The second derivatives of are indeed of opposite sign for the two PRCs (Fig. 2 A, left and right). In the case of transcriptional repression by light, entrainment remains stable at various light levels (Fig. 2 B, left), and the entrained oscillations vary little. In contrast to this, period doubling occurs very easily when transcription is activated by light (Fig. 2 B, right). As predicted by the theory, these differences in the robustness of the two forcing schemes to light-level variations can be traced back to the behavior of χ as a function of ε (Fig. 2 C). For transcriptional repression by light, χ remains well within the stability boundary due to its relative insensitivity to changes in ε, whereas in the case of transcriptional activation by light, the phase-locked state is destabilized beyond a critical forcing amplitude where χ goes below –2 and period doubling occurs (Fig. 2 C). A surprising finding was that the dependence of χ on ε in numerical simulations is perfectly predicted in both cases by the weak forcing approximation. This reflects the fact that the PRC remains proportional to ε, at least near the fixed point, up to relatively large values of ε (see Fig. 4, A and B). Fig. 2 D illustrates the different robustness properties in terms of the different size of the entrainment domain within the Arnold tongue. For all values of the FRP, the 1:1 entrainment domain is much wider for transcriptional repression by light. In fact, the main effect of the period mismatch is to force a minimum modulation amplitude required for synchronization, which primarily depends on the maximum and minimum values of the PRC.
Figure 2.
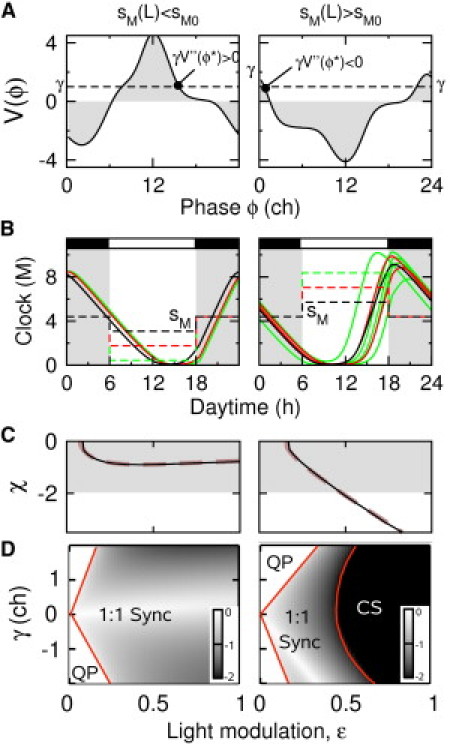
Range of stable 1:1 entrainment in the face of light-amplitude fluctuations. Left and right columns correspond to negative and positive modulationof sM, respectively, by light (transcriptional repression and activation, respectively). (A) Plots of corresponding to the weak forcing strength and . Whether or not the value is positive determines the sensitivity of χ to daylight fluctuations according to Eq. 7. (B) Time course over one day of the M clock component (solid lines) for different light-forcing amplitudes (black, ; red or dark gray, ; green or light gray, ). The shaded area corresponds to night. The FRP is set to T0 = 25 h (). (C) Plots of χ as a function of ε for T0 = 25 h computed from the PRC (thin black line) and predicted from the IPRC (thick dashed line). The shaded area corresponds to a stable 1:1 entrainment state. (D) Phase diagram showing the different dynamical regimes as a function of the forcing amplitude, ε, and period mismatch, γ. 1:1 Sync, 1:1 entrainment regime for which (value of χ is indicated by the grayscale code); QP, quasiperiodic regime for which has no solution (white); CS, complex synchronization and chaotic regime for which (black).
Figure 4.
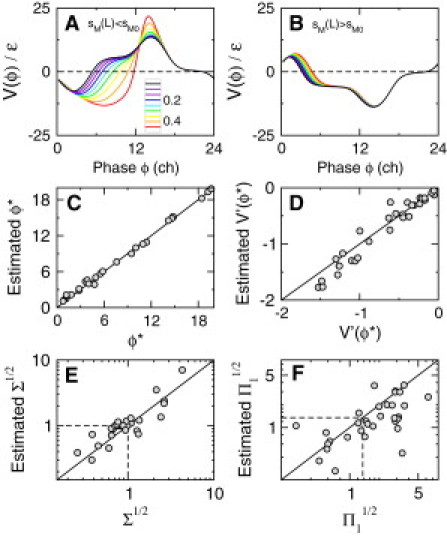
Validity of the phase approximation beyond the weak forcing limit. (A and B) Plot of normalized PRC- values for various forcing strengths ranging from to (grayscale or colorscale). In the presence of light, sM decreases in A and increases in B. (C–F) Plots of various measures of entrainment (, χ, , and ) and their estimates using IPRC computed for all possible one-parameter modulations, with a light-modulation strength of and FRPs of T0 = 23.7 and 24.3 h. Dashed lines correspond to the control case of an IPRC linearly decreasing during the daylight interval.
These two light-coupling schemes are also associated with different robustness properties of the oscillator phase with respect to changes in the daylight temporal profile (Fig. 3). The phase variance induced by small sinusoid perturbations of different phases is much smaller (by a factor of 2–10) when light represses rather than activates the self-regulated gene (Fig. 3 B). Again, this difference in robustness can be explained by contrasting sensitivities of the PRC to sinusoidal profile fluctuations near the oscillator phase (Fig. 3 C), which ultimately depend on the existence or absence of a dead zone in the relevant time interval (Fig. 3 A). Fig. 3 D shows that these differences in oscillator phase sensitivity are more or less pronounced, depending on the specific value of the FRP T0 or the characteristic period of the fluctuations (k = 1 or 2).
Figure 3.
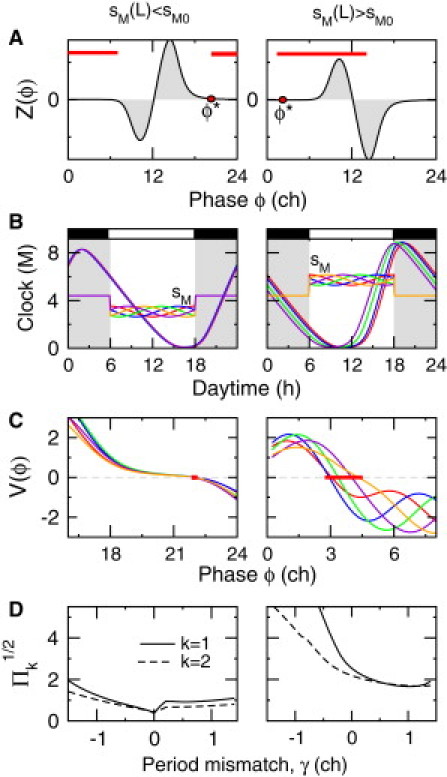
Sensitivity of the oscillator phase to light-profile fluctuations. Left and right columns correspond to negative and positive modulation of sM, respectively, by light. (A) Plot of IPRC values measured in response to light impulses. Whether or not they display a dead zone during the light-coupling interval (solid line) determines the sensitivity, Π, to daylight fluctuations according to Eq. 8. (B) Time courses of the light-dependent parameter and the entrained circadian oscillations over one day in the presence of various sinusoidal daylight fluctuations (grayscale or colorscale). The FRP T0 is set to 24 h. (C) Changes in PRCs associated with fluctuations shown in B. The thick red lines indicate the range of phase shifts (). (D) Corresponding values of as a function of γ (solid line, k = 1; dashed line, k = 2).
Taken together, Figs. 2 and 3 show that transcriptional repression and activation by light are associated with a large and a small stable entrainment domain, respectively, inside which there is a low and a high oscillator phase variability, respectively.
Range of validity of the weak forcing approximation
The extent to which IPRC properties can account for the robustness of the circadian clock with respect to daylight fluctuations depends on the validity of the phase approximation. In this section, we therefore evaluate the agreement between robustness properties derived analytically in the limit of weak forcing and those measured numerically when the forcing is not weak (Fig. 4).
A first indication is provided by estimating the maximum light-stimulus amplitude below which the proportionality between phase response and light amplitude (Eq. 6) holds. We found that the phase approximation can remain acceptable for modulations in excess of 50%, depending on the parameter considered and on the stimulus phase (Fig. 4, A and B). Other quantities derived from PRCs, such as the oscillator phase, , the stability coefficient, χ, or the sensitivity quantities Π and Σ, are also expected to deviate from their estimates in the phase approximation. Estimation of the phase and the stability coefficient of the entrainment state is quantitatively good when parameters change by 30% between night and day (Fig. 4, C and D). Quantitative agreement is more difficult for Π and Σ (Fig. 4, E and F), but a qualitative agreement can still be observed and is in fact more than sufficient to reflect a large (>20-fold) dispersion of values of Π and Σ between the most and least robust entrainment schemes.
The good agreement observed between robustness measures and their estimates using IPRC when χ is of the order of 1 confirms that the phase approximation remains qualitatively valid for moderate forcing strengths that would occur in nature, providing an efficient tool to infer the robustness properties of clocks by measuring and analyzing their PRCs.
Experimental PRC analysis reveals robustness properties to daylight fluctuations
We have shown that PRCs, despite their simplicity, can provide detailed and reliable information on the robustness properties of circadian entrainment. Incidentally, PRCs have been measured over 50 years in many organisms (33), thereby offering indirect evidence of whether natural clocks are robust or not to daylight fluctuations.
We have selected several PRCs measured in response to light pulses of various duration for 12 organisms (34–44) (Fig. 5 A). One may assume that for type I experimental PRCs (Fig. 5 A, a–j), the phase approximation holds, and therefore, their corresponding IPRCs are expected to display a shape similar to that of experimental PRCs if the light pulse is short enough (Fig. 5 A, a–g) or can otherwise be obtained by a rectangular-pulse deconvolution (Fig. 5 A, h–j). In any case, the IPRCs display pronounced dead zones (Fig. 5 B), albeit of different sizes, together with rapid variations at the beginning and end of the day, which is likely to confer robustness to daylight fluctuations according to our results.
Figure 5.
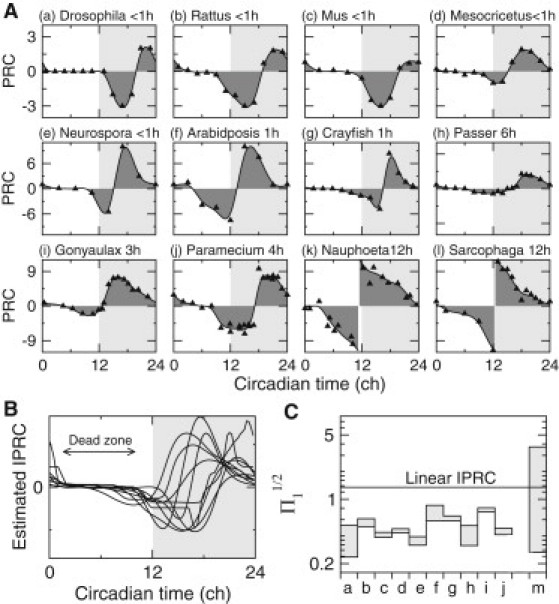
Experimental PRCs reveal robustness properties. (A) Experimental PRC data (triangles) collected from many organisms (33) and fitted (solid line and shaded area) according to the procedure described in the section 3 of the Supporting Material. (a) Drosophila melanogaster, 40-min pulse (34); (b) Rattus albicus, 30-min pulse (35); (c) Mus musculus, 15-min pulse (36); (d) Mesocricetus auratus, 15-min pulse (36); (e) Neuropora crassa, 5-min pulse (37); (f) Arabidopsis thaliana, 1-h pulse (38); (g) Procambarus bouvieri, 15-min pulse (39); (h) Passer domesticus, 6-h pulse (40); (i) Gonyaulax polyedra, 3-h pulse (41); (j) Paramecium bursaria, 4-h pulse (42); (k) Nauphoeta cinerea, 12-h pulse (43); and (l) Sarcophaga argyrostoma, 12-h pulse (44). Note that the x axis of PRCs is the circadian time (in ch) relative to time of subjective dawn (CT0 = ). (B) Estimated IPRCs from the fitted data of a–j in A. (C) Plots of the ranges of values (a–j, shaded area) computed from estimated IPRCs shown in B for a range of FRPs around 24 h. For comparison, plots of the ranges of values (m, shaded area) computed for all coupling schemes of the computational circadian clock model analyzed in the text (see Fig. 4F). The horizontal solid line indicates the value obtained for an IPRC that is linearly decreasing during daytime.
For a quantitative assessment of this conjecture, we compare the values of Π for the IPRCs estimated from experimental data with those obtained for the control case of an IPRC that is linearly decreasing during daytime as well as for many different light-coupling schemes of the circadian model considered in this study (Fig. 5 C). Values of Π obtained from experimental PRCs are found to be systematically lower than in the control case of a linear IPRC and are consistent with those computed for the most robust entrainment schemes of the circadian model. This strongly supports the idea that the circadian clock of these organisms has evolved to become robust to daylight fluctuations.
PRCs in response to daylight-like stimuli such as the 12-h rectangular pulse also provide valuable information about the entrainment robustness measured by the quantity Σ. Unfortunately, those PRCs have been measured experimentally much less often and are difficult to estimate from the available PRCs without a precise knowledge of the light-coupling profile. Notable exceptions are the PRCs measured in Sarcophaga argyrostoma and Nauphoeta cinerea (43,44), which are depicted in Fig. 5 A (k and l). The apparent change of curvature from convex to concave when the circadian phase goes from negative to positive seems again to indicate a robust entrainment characterized by an extended regime of stable 1:1 synchronization.
Discussion
In most living organisms, a circadian clock synchronizes internal physiological processes with cyclic environmental changes (e.g., in light or temperature) associated with Earth's rotation. However, a stable phase relationship between internal and external time is challenged by both internal and environmental variability. Part of this variability is linked to the diurnal cycle, in particular fluctuations in perceived daylight. In this work, we have derived explicit criteria for the robustness of circadian entrainment to daylight variability, which depend primarily on the linear response properties of an oscillator to vanishingly small light inputs. On the one hand, the existence of an extensive range of entrainment is favored by a convex (concave) PRC when the FRP is larger (smaller) than the day-night driving period. On the other hand, a low dispersion of the oscillator phase relative to the external time (e.g., dawn) requires a phase-response insensitivity of the clock during daytime, the so-called dead zone, which is manifested by the null interval of the IPRC during the subjective day. Although these results have been derived in the limits of weak forcing and slow fluctuations, simulations suggest that they may nevertheless give reliable insights into the cases where forcing is moderate and daylight intensity varies from day to day.
These two PRC properties conferring entrainment robustness to forcing fluctuations happen incidentally to be observed in circadian PRCs measured experimentally in many organisms, in particular, the existence of a dead zone that seems to be universal. The different sizes of dead-zone intervals observed in various species does not weaken the robustness hypothesis but rather suggests the existence of light-gating mechanisms that restrict the light sensitivity of the clock to a certain window of the day (17,45). For instance, Arabidopsis, which exhibits a short dead zone, features a fast response to light after dawn (46). These universal PRC properties of the circadian clock may reflect a universal strategy to minimize the impact of the forcing cycle fluctuations on the clock phase, thus suggesting a convergent functional evolution of circadian clocks.
Trade-offs between multiple evolutionary goals
Circadian clock properties, including IPRC or FRP properties, are also constrained by adaptive purposes other than the need for robustness to daylight fluctuations, raising the question of whether trade-offs are eventually required.
One important constraint for the circadian clock is the requirement to achieve fast resetting after transient perturbations (47), which depends in the first approximation on the derivative of the PRC at (optimal resetting is obtained for ). For circadian oscillators that display a dead zone, the weak forcing approximation indicates that fast resetting requires that the dead zone must be slightly smaller than the daylight interval and that the FRP must be different from 24 h. These two conditions are fully compatible with criteria for robustness to daylight fluctuations.
The variability of the FRP of the circadian rhythm is also a prevalent source of variability of the clock phase (36). Daan and Pittendrigh stressed the fact that a clock characterized by 1), an FRP equal to 24 h, and 2), a large dead zone in the PRC, displays a phase instability for which a small change in the FRP causes a large change in the oscillator's phase. This result has been tempered by a modeling study (48) showing that entrained circadian oscillations for the Drosophila model, which also display a dead zone, have a wider range of stability when the FRP is close to 24 h. These apparently contradictory results can be reconciled by considering that phase stability and the size of the entrainment domain are not necessarily correlated, though an optimal compromise can be achieved for suitable dead-zone size and FRP value.
Finally, seasonal variations in day length are another environmental variation that the clock needs to adapt to by tracking dawn, dusk, or both. Previous studies (45,49) have shown that the presence of a dead zone is an efficient mechanism for achieving seasonal tracking of dawn (dusk) with an FRP larger (smaller) than 24 h. However, this mechanism requires that the dead zone be larger than the light-coupling interval for some short photoperiods, which may antagonize the requirement for a robust synchronization in the presence of daylight fluctuations.
Thus, circadian clocks characterized by a dead zone during the subjective day and a finely tuned FRP, eventually supplemented with specific light-gating mechanisms (17,45), are suitable to achieve an efficient trade-off between multiple and unrelated evolutionary goals.
The shape of PRC and design principles of biological oscillators
The concept of the PRC was introduced and exploited to investigate synchronization behaviors in various biological systems theoretically and experimentally (50). It is worth noting that in circadian and neuronal systems, the PRC is both an experimentally assessable feature of the biological oscillator (33,51) and a powerful mathematical tool to evaluate the ability of the oscillator to synchronize to other oscillators (20,21). Neuronal oscillators display various PRC shapes that depend primarily on the properties of ionic channels (24,25) and are generally placed into two main categories according to whether or not their PRCs have a large negative part. These two types of PRCs lead to very different synchronization properties of coupled neurons (22,23) or uncoupled neurons driven by correlated synaptic noise (26,27). By comparison, the PRCs of circadian clocks are much less diverse PRCs, with both a positive and negative part, between which a dead zone is present, thereby ensuring a robust synchronization. Still, the manner in which the PRC changes with light-stimulus intensity tends to be very species-specific. Whereas mammals display smooth PRCs in a large range of light-stimulus amplitude, some species, like fungi, display discontinuous PRCs (52) for relatively weak stimuli, which is understood neither at the functional nor at the structural level of the clock. Thus, many properties of circadian PRCs remain to be explored, especially how their shape and sensitivity to finite-amplitude perturbations are determined by the underlying biophysical properties of the molecular clock, including the presence of feedback, delays, saturation, and cooperativity (8,30,31,53,54), but also their light transduction properties, such as gating or photoadaptation (45,55).
Acknowledgments
This work has been supported by ANR grant 07BSYS004 as well as by Ministry of Higher Education and Research, Nord-Pas de Calais Regional Council and FEDER through the Contrat de Projets État-Région (CPER) 2007-2013.
Supporting Material
References
- 1.Woelfle M.A., Ouyang Y., Johnson C.H. The adaptive value of circadian clocks: an experimental assessment in cyanobacteria. Curr. Biol. 2004;14:1481–1486. doi: 10.1016/j.cub.2004.08.023. [DOI] [PubMed] [Google Scholar]
- 2.Dodd A.N., Salathia N., Webb A.A. Plant circadian clocks increase photosynthesis, growth, survival, and competitive advantage. Science. 2005;309:630–633. doi: 10.1126/science.1115581. [DOI] [PubMed] [Google Scholar]
- 3.Graf A., Schlereth A., Smith A.M. Circadian control of carbohydrate availability for growth in Arabidopsis plants at night. Proc. Natl. Acad. Sci. USA. 2010;107:9458–9463. doi: 10.1073/pnas.0914299107. [DOI] [PMC free article] [PubMed] [Google Scholar]
- 4.Cheng P., Yang Y., Liu Y. Interlocked feedback loops contribute to the robustness of the Neurospora circadian clock. Proc. Natl. Acad. Sci. USA. 2001;98:7408–7413. doi: 10.1073/pnas.121170298. [DOI] [PMC free article] [PubMed] [Google Scholar]
- 5.Barkai N., Leibler S. Circadian clocks limited by noise. Nature. 2000;403:267–268. doi: 10.1038/35002258. [DOI] [PubMed] [Google Scholar]
- 6.Gonze D., Halloy J., Goldbeter A. Robustness of circadian rhythms with respect to molecular noise. Proc. Natl. Acad. Sci. USA. 2002;99:673–678. doi: 10.1073/pnas.022628299. [DOI] [PMC free article] [PubMed] [Google Scholar]
- 7.Mihalcescu I., Hsing W., Leibler S. Resilient circadian oscillator revealed in individual cyanobacteria. Nature. 2004;430:81–85. doi: 10.1038/nature02533. [DOI] [PubMed] [Google Scholar]
- 8.Wang J., Xu L., Wang E. Robustness, dissipations and coherence of the oscillation of circadian clock: potential landscape and flux perspectives. PMC Biophys. 2008;1:7. doi: 10.1186/1757-5036-1-7. [DOI] [PMC free article] [PubMed] [Google Scholar]
- 9.Dibner C., Sage D., Schibler U. Circadian gene expression is resilient to large fluctuations in overall transcription rates. EMBO J. 2009;28:123–134. doi: 10.1038/emboj.2008.262. [DOI] [PMC free article] [PubMed] [Google Scholar]
- 10.Rand D.A., Shulgin B.V., Millar A.J. Design principles underlying circadian clocks. J. R. Soc. Interface. 2004;1:119–130. doi: 10.1098/rsif.2004.0014. [DOI] [PMC free article] [PubMed] [Google Scholar]
- 11.Stelling J., Gilles E.D., Doyle F.J., 3rd Robustness properties of circadian clock architectures. Proc. Natl. Acad. Sci. USA. 2004;101:13210–13215. doi: 10.1073/pnas.0401463101. [DOI] [PMC free article] [PubMed] [Google Scholar]
- 12.Wagner A. Circuit topology and the evolution of robustness in two-gene circadian oscillators. Proc. Natl. Acad. Sci. USA. 2005;102:11775–11780. doi: 10.1073/pnas.0501094102. [DOI] [PMC free article] [PubMed] [Google Scholar]
- 13.Stramska M., Dicky T.D. Variability of bio-optical properties of the upper ocean associated with diel cycles in phytoplankton population. J. Geophys. Res. 1992;97:17873–17887. [Google Scholar]
- 14.Graham E.A., Mulkey S.S., Wright S.J. Cloud cover limits net CO2 uptake and growth of a rainforest tree during tropical rainy seasons. Proc. Natl. Acad. Sci. USA. 2003;100:572–576. doi: 10.1073/pnas.0133045100. [DOI] [PMC free article] [PubMed] [Google Scholar]
- 15.Beersma D.G.M., Daan S., Hut R.A. Accuracy of circadian entrainment under fluctuating light conditions: contributions of phase and period responses. J. Biol. Rhythms. 1999;14:320–329. doi: 10.1177/074873099129000740. [DOI] [PubMed] [Google Scholar]
- 16.Troein C., Locke J.C.W., Millar A.J. Weather and seasons together demand complex biological clocks. Curr. Biol. 2009;19:1961–1964. doi: 10.1016/j.cub.2009.09.024. [DOI] [PubMed] [Google Scholar]
- 17.Thommen Q., Pfeuty B., Lefranc M. Robustness of circadian clocks to daylight fluctuations: hints from the picoeucaryote Ostreococcus tauri. PLOS Comput. Biol. 2010;6:e1000990. doi: 10.1371/journal.pcbi.1000990. [DOI] [PMC free article] [PubMed] [Google Scholar]
- 18.Morant P.-E., Thommen Q., Lefranc M. A robust two-gene oscillator at the core of Ostreococcus tauri circadian clock. Chaos. 2010;20:045108. doi: 10.1063/1.3530118. [DOI] [PubMed] [Google Scholar]
- 19.Kuramoto Y. Waves and Turbulence; Springer, New York: 1984. Chemical Oscillations. [Google Scholar]
- 20.Winfree A.T. 3rd ed. Springer Verlag; Berlin: 2001. The Geometry of Biological Time. [Google Scholar]
- 21.Smeal R.M., Ermentrout G.B., White J.A. Phase-response curves and synchronized neural networks. Philos. Trans. R. Soc. Lond. B Biol. Sci. 2010;365:2407–2422. doi: 10.1098/rstb.2009.0292. [DOI] [PMC free article] [PubMed] [Google Scholar]
- 22.Hansel D., Mato G., Meunier C. Synchronization in excitatory neural networks. Phys. Rev. E. 1995;7:307. doi: 10.1162/neco.1995.7.2.307. [DOI] [PubMed] [Google Scholar]
- 23.Ermentrout B. Type I membranes, phase resetting curves, and synchrony. Neural Comput. 1996;8:979–1001. doi: 10.1162/neco.1996.8.5.979. [DOI] [PubMed] [Google Scholar]
- 24.Pfeuty B., Mato G., Hansel D. Electrical synapses and synchrony: the role of intrinsic currents. J. Neurosci. 2003;23:6280–6294. doi: 10.1523/JNEUROSCI.23-15-06280.2003. [DOI] [PMC free article] [PubMed] [Google Scholar]
- 25.Acker C.D., Kopell N., White J.A. Synchronization of strongly coupled excitatory neurons: relating network behavior to biophysics. J. Comput. Neurosci. 2003;15:71–90. doi: 10.1023/a:1024474819512. [DOI] [PubMed] [Google Scholar]
- 26.Marella S., Ermentrout G.B. Class-II neurons display a higher degree of stochastic synchronization than class-I neurons. Phys. Rev. E. 2008;77:041918. doi: 10.1103/PhysRevE.77.041918. [DOI] [PubMed] [Google Scholar]
- 27.Abouzeid A., Ermentrout B. Type-II phase resetting curve is optimal for stochastic synchrony. Phys. Rev. E. 2009;80:011911. doi: 10.1103/PhysRevE.80.011911. [DOI] [PubMed] [Google Scholar]
- 28.Taylor S.R., Gunawan R., Doyle F.J. Sensitivity measures for oscillating systems: application to mammalian circadian gene network. IEEE Trans. Automat. Contr. 2008;53:177–188. doi: 10.1109/TAC.2007.911364. [DOI] [PMC free article] [PubMed] [Google Scholar]
- 29.Young M.W., Kay S.A. Time zones: a comparative genetics of circadian clocks. Nat. Rev. Genet. 2001;2:702–715. doi: 10.1038/35088576. [DOI] [PubMed] [Google Scholar]
- 30.Novák B., Tyson J.J. Design principles of biochemical oscillators. Nat. Rev. Mol. Cell Biol. 2008;9:981–991. doi: 10.1038/nrm2530. [DOI] [PMC free article] [PubMed] [Google Scholar]
- 31.Morant P.E., Thommen Q., Lefranc M. Oscillations in the expression of a self-repressed gene induced by a slow transcriptional dynamics. Phys. Rev. Lett. 2009;102:068104. doi: 10.1103/PhysRevLett.102.068104. [DOI] [PubMed] [Google Scholar]
- 32.Leloup J.C., Gonze D., Goldbeter A. Limit cycle models for circadian rhythms based on transcriptional regulation in Drosophila and Neurospora. J. Biol. Rhythms. 1999;14:433–448. doi: 10.1177/074873099129000948. [DOI] [PubMed] [Google Scholar]
- 33.Johnson C.H. Atlas of Phase Response Curves for Circadian and Circadital Rhythms. volume 4. Department of Biology, Vanderbilt University; Nashville, TN: 1990. [Google Scholar]
- 34.Konopka R.J. Genetic dissection of the Drosophila circadian system. Fed. Proc. 1979;38:2602–2605. [PubMed] [Google Scholar]
- 35.Honma K., Honma S., Hiroshige T. Response curve, free-running period, and activity time in circadian locomotor rhythm of rats. Jpn. J. Physiol. 1985;35:643–658. doi: 10.2170/jjphysiol.35.643. [DOI] [PubMed] [Google Scholar]
- 36.Daan S., Pittendrigh C. A functional analysis of circadian pacemakers in nocturnal rodents. II. The variability of phase response curves. J. Comp. Physiol. 1976;106:253–266. [Google Scholar]
- 37.Perlman J., Nakashima H., Feldman J.F. Assay and characteristics of circadian rhythmicity in liquid cultures of Neurospora crassa. Plant Physiol. 1981;67:404–407. doi: 10.1104/pp.67.3.404. [DOI] [PMC free article] [PubMed] [Google Scholar]
- 38.Covington M.F., Panda S., Kay S.A. ELF3 modulates resetting of the circadian clock in Arabidopsis. Plant Cell. 2001;13:1305–1315. doi: 10.1105/tpc.13.6.1305. [DOI] [PMC free article] [PubMed] [Google Scholar]
- 39.Fuentes-Pardo B., Ramos-Carvajal J. The phase response curve of electroretinographic circadian rhythm of crayfish. Comp. Biochem. Physiol. 1983;74:711–714. [Google Scholar]
- 40.Eskin A. Some properties of the system controlling the circadian activity rhythm of sparrows. In: Menaker M., editor. Biochronometry. National Academy of Sciences; Washington: 1971. pp. 55–80. [Google Scholar]
- 41.Christianson R., Sweeney B.M. The dependence of the phase response curve for the luminescence rhythm in gonyaulax on the irradiance in constant conditions. Int. J. Chronobiol. 1973;1:95–100. [PubMed] [Google Scholar]
- 42.Johnson C.H., Miwa I., Hastings J.W. Circadian rhythm of photoaccumulation in Paramecium bursaria. J. Biol. Rhythms. 1989;4:405–415. doi: 10.1177/074873048900400402. [DOI] [PubMed] [Google Scholar]
- 43.Saunders D.S., Thomson E. ‘Strong’ phase response curve for the circadian rhythm of locomotor activity in a cockroach (Nauphoeta cinerea) Nature. 1977;170:241–243. doi: 10.1038/270241a0. [DOI] [PubMed] [Google Scholar]
- 44.Saunders D.S. An experimental and theoretical analysis of photoperiod induction in the flesh fly and Sarcophaga argyrostoma. J. Comp. Physiol. 1978;124:75–95. [Google Scholar]
- 45.Geier F., Becker-Weimann S., Herzel H. Entrainment in a model of the mammalian circadian oscillator. J. Biol. Rhythms. 2005;20:83–93. doi: 10.1177/0748730404269309. [DOI] [PubMed] [Google Scholar]
- 46.Locke J.C.W., Southern M.M., Millar A.J. Extension of a genetic network model by iterative experimentation and mathematical analysis. Mol. Syst. Biol. 2005;1:2005.0013. doi: 10.1038/msb4100018. [DOI] [PMC free article] [PubMed] [Google Scholar]
- 47.Granada A.E., Herzel H. How to achieve fast entrainment? The timescale to synchronization. PLoS ONE. 2009;4:e7057. doi: 10.1371/journal.pone.0007057. [DOI] [PMC free article] [PubMed] [Google Scholar]
- 48.Kurosawa G., Goldbeter A. Amplitude of circadian oscillations entrained by 24-h light-dark cycles. J. Theor. Biol. 2006;242:478–488. doi: 10.1016/j.jtbi.2006.03.016. [DOI] [PubMed] [Google Scholar]
- 49.Gunawan R., Doyle F.J., 3rd Phase sensitivity analysis of circadian rhythm entrainment. J. Biol. Rhythms. 2007;22:180–194. doi: 10.1177/0748730407299194. [DOI] [PubMed] [Google Scholar]
- 50.Granada A., Hennig R.M., Herzel H. Phase response curves elucidating the dynamics of coupled oscillators. Methods Enzymol. 2009;454:1–27. doi: 10.1016/S0076-6879(08)03801-9. [DOI] [PubMed] [Google Scholar]
- 51.Netoff T.I., Banks M.I., White J.A. Synchronization in hybrid neuronal networks of the hippocampal formation. J. Neurophysiol. 2005;93:1197–1208. doi: 10.1152/jn.00982.2004. [DOI] [PubMed] [Google Scholar]
- 52.Glass L., Winfree A.T. Discontinuities in phase-resetting experiments. Am. J. Physiol. 1984;246:R251–R258. doi: 10.1152/ajpregu.1984.246.2.R251. [DOI] [PubMed] [Google Scholar]
- 53.Tsai T.Y., Choi Y.S., Ferrell J.E., Jr. Robust, tunable biological oscillations from interlinked positive and negative feedback loops. Science. 2008;321:126–129. doi: 10.1126/science.1156951. [DOI] [PMC free article] [PubMed] [Google Scholar]
- 54.Pfeuty B., Kaneko K. The combination of positive and negative feedback loops confers exquisite flexibility to biochemical switches. Phys. Biol. 2009;6:046013. doi: 10.1088/1478-3975/6/4/046013. [DOI] [PubMed] [Google Scholar]
- 55.Malzahn E., Ciprianidis S., Brunner M. Photoadaptation in Neurospora by competitive interaction of activating and inhibitory LOV domains. Cell. 2010;142:762–772. doi: 10.1016/j.cell.2010.08.010. [DOI] [PubMed] [Google Scholar]
Associated Data
This section collects any data citations, data availability statements, or supplementary materials included in this article.