

Abstract
The p53 tumor suppressor is a transcription factor involved in many important signaling pathways, such as apoptosis and cell-cycle arrest. In over half of human cancers, p53 function is compromised by a mutation in its gene. Mutations in the p53 DNA-binding core domain destabilize the structure and reduce DNA-binding activity. We performed molecular dynamics simulations at physiological temperature to study the structural and dynamic effects of the L145Q, V157F, and R282W cancer-associated mutations in comparison to the wild-type protein. While there were common regions of destabilization in the mutant simulations, structural changes particular to individual mutations were also observed. Significant backbone deviations of the H2 helix and S7–S8 loop were observed in all mutant simulations; the H2 helix binds to DNA. In addition, the L145Q and V157F mutations, which are located in the β-sandwich core of the domain, disrupted the β-sheet structure and the loop-sheet-helix motif. The R282W mutation caused distortion of the loop-sheet-helix motif, but otherwise this mutant was similar to the wild-type structure. The introduction of these mutations caused rearrangement of the DNA-binding surface, consistent with their reduced DNA-binding activity. The simulations reveal detailed effects of the mutations on the stability and dynamics of p53 that may provide insight for therapeutic approaches.
Keywords: p53 tumor suppressor, oncogenic mutation, molecular dynamics, protein structure
The p53 tumor suppressor is a transcription factor involved in regulating the cell cycle. In response to oncogenic and other stresses, p53 activates the transcription of genes involved in apoptosis, cell cycle arrest, and senescence (1, 2). Approximately half of all cases of cancer are associated with mutations in the p53 gene (3). About 75% of mutations in sporadic and germline cancers are missense mutations (4, 5), and the majority of these occur in the DNA-binding core domain of p53 (p53C) (6). p53 mutants are potential targets for cancer therapies. Current approaches aim to rescue the function of p53 mutants by stabilizing the functional conformation of the protein, i.e. the native wild-type structure (7–11).
Full-length p53 has a flexible N-terminus, a DNA-binding core domain, a tetramerization domain, and a C-terminal negative regulatory domain. Full-length p53 forms tetramers when bound to DNA (12). The unstructured N-terminal domain and C-terminal negative regulatory domain have prevented crystallization of full-length p53 (13). The DNA-binding core domain (residues 94-312, p53C) is comprised of a β-sandwich and a DNA-binding surface (6). Most cancer-associated mutations occur in the core domain, with the highest frequency on the DNA-binding surface. Figure 1A shows the crystal structure of the DNA-free p53C. On the surface are two loops, L2 and L3, stabilized by a Zn2+ ion, and a loop-sheet-helix motif. The L1 loop and H2 helix in the loop-sheet-helix directly contact DNA in the major groove. p53C is only marginally stable, with a melting temperature of ~42–44 °C (14). The isolated DNA-binding core domain exists as a monomer in solution and retains DNA-binding activity (15).
FIGURE 1.

p53 core domain structure. (A) Ribbon diagram of DNA-free p53 core domain colored from blue (N-terminus) to red (C-terminus) (PDB 2ocj) (21). The zinc ion is shown as a purple sphere. (B) Ribbon diagram of p53 core domain bound to consensus DNA (PDB 1tsr) (6). The structure of p53 is colored from blue (N-terminus) to red (C-terminus), and DNA is colored gray. Residues that contact DNA are shown as sticks, and mutation sites shown in space-filling representation.
Here we focus on three cancer-associated mutations in p53C: L145Q, V157F, and R282W. These mutations are highly-destabilizing to the core domain and eliminate function at physiological temperature (16). R282W is one of six hotspot mutations that occur at high frequency in human cancers. It is located on the H2 helix, which is part of the loop-sheet-helix motif (Figure 1B). The R282W mutation destabilizes the core domain, and the mutant is mostly unfolded at 37°C (16). L145Q and V157F are classified as β-sandwich mutants and are located on β-strands S3 and S4, respectively (Figure 1B). Nearly a third of the cancer mutations are in the β-sandwich region, but individual mutations occur at a much lower rate than hot-spot mutations (12). β-sandwich mutants retain sequence-specific DNA-binding at lower temperatures, but many are not functional at physiological temperature (17). The L145Q mutant is 3 kcal/mol less stable than the wild-type (WT) protein and the V157F mutant is destabilized by 3.9 kcal/mol (16).
We performed molecular dynamics (MD) simulations of WT p53C and the three mutants at 37°C to investigate the mechanisms of destabilization and the effects of the mutations on p53C structure and dynamics. Zn2+ dissociates from WT and mutant p53 at physiological temperature, such that a significant fraction of p53 appears to exist in the apo state (18) Furthermore insufficient zinc is linked to misfolding, particularly in concert with tumorigenic mutations (19, 20). Consequently we focus on the apo, zinc-free state, but holo simulations of all constructs were also performed and are presented here. The most significant changes in response to mutation were observed along the DNA-binding interface, especially in the H2 helix and L1 loop. The L145Q and V157F mutations caused global effects on the core and loop-sheet-helix motif. The R282W mutation disrupted the nearby loop-sheet-helix, but otherwise the structure of the mutant was similar to WT.
METHODS
Models
The starting structure for all simulations was obtained from the 2.05 Å resolution crystal structure of p53 core domain [PDB entry 2ocj chain A] (21). All water molecules were removed from the crystal structure. The L145Q, V157F, and R282W mutants were created by replacing the WT residue with its polymorphic residue. Then, the energy was minimized in vacuo using ENCAD (22). The Cα-RMSD between the starting structures of the WT and the mutant structures was under 0.1 Å.
Molecular dynamics simulations and analysis
All other calculations and MD simulations were performed using our in-house modeling program in lucem molecular mechanics (ilmm) (23). The protocols and potential energy function have been described previously (24–26). Each starting structure was minimized in vacuo for 1000 steps of steepest descent minimization. The system was solvated by adding explicit flexible three-center waters in a periodic rectangular box (26). The walls were located ≥ 10 Å from all protein atoms. The solvent density was set to 0.993 g/mL, which is the experimentally determined water density at 37°C (27). The energy of the solvent molecules was minimized for 1000 steps and then the solvent was heated for 1 ps. Then the solvent was minimized for an additional 500 steps, and then, the entire system was minimized for 500 steps. Initial velocities were assigned by a random seed to the atoms in the system. The NVE microcanonical ensemble was employed, where the number of particles, box volume and total energy are constant. A force-shifted, non-bonded cutoff of 10 Å was used and the non-bonded interaction pair was updated every two steps (28). Simulations were performed with a time step of 2 fs, and structures from the simulations were saved at 1 ps resolution for analysis. Simulations were conducted at physiological temperature, 37°C or 310 K, and neutral pH. Three simulations of apo WT and each mutant were performed (the zinc was removed), and the length of the simulations was at least 51 ns, yielding 153,000 structures for each protein for analysis. In addition, three simulations of WT and each mutant were performed for at least 51 ns with the zinc ion covalently bound to C176, H179, C238, and C242. This yields a total of over 1.224 μs of simulation.
Calculations of Cα-RMSD, Cα-RMSF, SASA, and contacts were performed using ilmm. Average values of Cα-RMSD, Cα-RMSF, and SASA were calculated using structures over the last 25 ns of each simulation. An atomic contact was defined as a C-C atom distance within 5.4, or any other heavy-atom distance within 4.6 Å between two nonadjacent residues.
RESULTS
MD simulations of apo WT, L145Q, V157F, and R282W p53 core domain (p53C) proteins were performed at 37°C and neutral pH in triplicate (the holo forms are addressed below). The average root-mean-square deviation (RMSD) of the Cα atoms from the starting structure over the last 25 ns in the WT simulation was 3.6 ± 0.3 Å (Table 1). The average Cα-RMSD in R282W simulations was similar to WT, but the deviations of the other mutants showed greater variation across three runs. In one L145Q run and two V157 runs, the average Cα-RMSD was ≥4 Å. The average Cα root-mean-square fluctuations (Cα-RMSFs) simulation structures were similar between the WT and mutant simulations in general (Figures 2A). Strands S4, S9, and S10, which are in the same sheet of the β-sandwich, had consistently low fluctuations across all simulations. However, higher fluctuations around the Zn2+ binding residues, C238 and C242, were observed in WT simulations in the absence of Zn2+.
Table 1.
Average properties of WT, L145Q, V157F, and R282W p53 simulationsa
| Initial WT | WT | L145Q | V157F | R282 W | |||||
|---|---|---|---|---|---|---|---|---|---|
| apo | holo | apo | holo | apo | holo | apo | holo | ||
| Cα-RMSD (Å) | 3.6 ± 0.3 | 2.8 ± 0.1 | 4.3 ± 0.9 | 3.4 ± 0.3 | 4.1 ± 0.5 | 3.8 ± 0.6 | 3.8 ± 0.3 | 3.9 ± 0.5 | |
| H1 helix Cα-RMSD (Å) | 4.0 ± 2.3 | 1.8 ± 0.4 | 5.2 ± 2.6 | 1.5 ± 0.3 | 4.5 ± 1.8 | 1.3 ± 0.3 | 4.9 ± 1.5 | 1.4 ± 0.2 | |
| H2 helix Cα-RMSD (Å) | 3.3 ± 1.5 | 2.7 ± 0.3 | 5.5 ± 4.2 | 4.4 ± 1.5 | 4.4 ± 0.8 | 5.8 ± 0.9 | 4.2 ± 2.0 | 6.0 ± 2.7 | |
| Total SASA (Å2) | 10357 | 10602 ± 393 | 10603 ± 104 | 10703 ± 294 | 10698 ± 43 | 10709 ± 205 | 10808 ± 118 | 10871 ± 412 | 10896 ± 80 |
| DNA- binding site SASA (Å2)b | 748 | 604 ± 119 | 603 ± 8 | 551 ± 52 | 645 ± 32 | 622 ± 77 | 623 ± 83 | 583 ± 123 | 634 ± 55 |
| Core SASA (Å2)c | 257 | 285 ± 59 | 324 ± 50 | 373 ± 64 | 294 ± 37 | 368 ± 33 | 361 ± 16 | 346 ± 82 | 251 ± 59 |
All properties were calculated using structures from the last 25 ns of each simulation.
DNA-binding site SASA calculated over the following residues: S241, R248, R273, A276, C277, R280, R283.
Core SASA calculated over the following residues: F109, L111, M113, C141, V143, L/Q145, V147, V/F157, A159, A161, I195, V197, V216, V218, Y220, T230, I232, Y234, Y236, I251, T253, I255, L257, N268, F270, V272. Cα-RMSD: Cα-root-mean-square deviation SASA: Solvent accessible surface area
FIGURE 2.

A) Average Cα-RMSF per residue for WT (black), L145Q (red), V157F (green), and R282W (blue) apo simulations. B–D) Average Cα-RMSD per residue for apo and holo simulations. E–F) Average Cα-RMSF per residue compared to crystallographic B-factors. Cα-RMSFs were calculated relative to the average structure over the last 25 ns. Cα-RMSDs were calculated relative to the starting structure. Crystallographic B-factors from the wild-type p53C (PDB 2ocj, Chain A) (21) and from T-p53C-R282W (PDB 2j21, Chain A) (29) shown in red.
Changes in the L1 loop, S7–S8 loop, and H2 helix contributed to higher values of average Cα-RMSD in mutant simulations (Figures 2B–D). The loop regions exhibited large movements in WT and mutant simulations. In mutant simulations, a larger portion of the L1 loop shifted far from its starting position (Figures 2B–D). The S7–S8 loop also exhibited larger deviations from the starting structure in mutant simulations than in the WT simulations. Compared to the WT simulations, the Cα-RMSD was noticeably increased around strands S2 and S2’ in the V157F simulations.
The average total solvent accessible surface area (SASA) varied across individual runs and increased from the initial SASA in nearly every run (Table 1). The DNA-binding site became less exposed throughout simulations. On average, mutant simulations exhibited increased core SASA compared to the WT simulations, with more dramatic increases in the L145Q and V157F mutants.
For comparison, simulations of Zn2+-bound WT and mutant simulations were performed. Based on 15N/1H heteronuclear single-quantum correlation nuclear magnetic resonance experiments (18), removal of Zn2+ can affect the L2 and L3 loops, but it doesn’t have a significant impact on other structural elements. The most significant differences in Cα-RMSD between the apo and holo simulations were in the local Zn2+-binding region, composed of the L2 loop, H1 helix, and L3 loop (Figures 2B–D). Other differences observed in average Cα-RMSD per residue occurred in areas with larger variations across individual runs, such as the L1 loop and H2 helix. For WT and mutants, the Cα-RMSF was decreased around these areas of the protein in holo simulations (Figures 2E, 2F). The average Cα-RMSD of the H1 helix across all holo simulations was about 1.5 Å, compared to 4.7 Å across all apo simulations (Table 1). In contrast, the Cα-RMSD of the H2 helix did not significantly differ between apo and holo simulations for each variant (Table 1). While the overall average Cα-RMSD was lower in WT and L145Q when Zn2+ was present, the V157F and R282W mutants did not differ in average Cα-RMSD between apo and holo simulations. In all cases the mutant holo simulations had higher average Cα-RMSD than the WT holo simulations.
The L145Q mutation disrupts the β-sheet structure
Substitution of leucine for glutamine on strand S3 introduces a polar side chain into the core of the β-sandwich. In the starting structure, Q145 has an initial SASA of 6.2 Å2, and in two apo L145Q simulations, SASA of Q145 increased to over 20 Å2. Increased solvent exposure resulted from separation of strands S3 and S8 (Figure 3A).
FIGURE 3.

Disruption of β-sheet structure and neighboring loops in L145Q p53 and V157F p53 simulations. A) Structure from L145Q simulation. B) Close up of S7–S8 loop in representative structure from L145Q simulation. C) Structure from V157F simulation. D) Close up of S7–S8 loop in representative structure from V157F simulation. Mutated residue is shown in space-filling representation and colored by atom. S1, S3, S8, and S7–S8 loop are colored as in Figure 1. E) Backbone of strands S3 and S8 from simulations at t = 51 ns. Hydrogen bonds are shown as dashed lines.
The L145Q mutation destabilized the β-sheet, including strands S1, S3, and S8, and the neighboring loops, S3–S4 loop and S7–S8 loop. The S7–S8 loop curved over itself, losing contacts with the S3–S4 loop (Figure 3B). Various residues on S7–S8 loop form new contacts with residues N200 and L201 near strand S5. β-structure of the S1 strand was lost or very unstable in all simulations, including WT. Native main chain hydrogen bonds between S1 and S3 were present throughout the simulations, but not at the same time. Unlike WT simulations, the S3 strand was noticeably distorted in two L145Q simulations (Figure 3E). Loss of several main chain hydrogen bonds between the S3 and S8 strands was observed in the L145Q simulations and not in WT. The main chain hydrogen bonds between Q145 and T230 broke early in L145Q simulations. In one simulation, the hydrogen bond between V143 and I232 was also lost for a majority of the simulation. The changes in the S7–S8 loop, strand S3, and strand S8 contributed to large increases in SASA of residues V143, T230, I232, I255, and F270.
The V157F mutation affects the β-sheet and local packing in the core
Substitution of valine by phenylalanine introduces steric hindrance in the β-sandwich core and is predicted simulations to have a large effect on the overall structure of p53C. The V157F mutation had a similar effect as L145Q on the S7–S8 loop, which was distorted compared to the starting structure (Figure 3C). In simulations, the S7–S8 loop shifted away from the S3–S4 loop and formed interactions with N200 and L201 (Figure 3D). At various times in two different runs, a hydrogen bond formed between S227 on the S7–S8 loop and either N200 or L201. With the movement of the loop, the main chain hydrogen bonds between L145 and T230 were lost, and other contacts between strands S3 and S8 were reduced (Figure 3E). Other parts of the β-sheet were destabilized, including strand S1. SASA of core residues L111, M133, C141, Y220, Y234, I255, and F270 increased from its average SASA in WT simulations.
The mutation introduces a larger side chain inside the core, where packing is initially tight (Figure 4). In the V157F simulations, packing of the core accommodated the mutated side chain through structural changes. In one run, the side chain of Y220 swung out, and L145, which is tightly packed next to V157F in the crystal structure, gradually moved out. Overall, the S3 and S8 strands shifted out from the core, and the buried side chains became more mobile.
FIGURE 4.
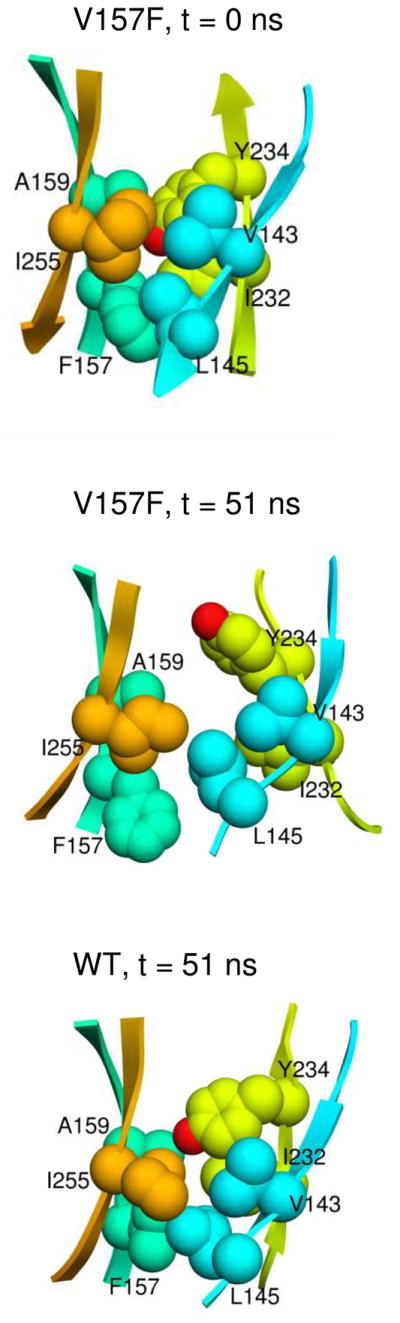
V157F mutation disrupts packing in β-sandwich core. Side chains are shown in space-filling representation. Structure is colored as in Figure 1.
These effects propagated to the S2-S2' sheet and the H2 helix. The drop in contacts between the S2-S2' sheet and the H2 helix followed the decrease in native atom contacts the core (Figure 5A). These changes appear to be linked through the S1 strand. With the shifting out of the S3 strand from the core and packing adjustments made by the side chain of L145, the strand S1 exhibited several changes (Figure 5B). As a result of changes in core packing, both F109 and F113 on strand S1 changed rotamers and the side chain of L111 was pushed around slightly. The backbone of strand S1 shifted out with its neighboring strand S3, increasing the distance between residues on the strand S1 and residues on the nearby strand S10. For example, the distance between the centers of mass of L111 and N268 on strand S10 shows a sharp decrease around this time (Figure 5C). The S2-S2' sheet was able to move closer in towards the core. A decrease in distance between the centers of mass of Y126 on the S2-S2' sheet and N268 on S10 occurred immediately following the increase in space between S1 and S10 (Figure 5C). Movement of the S2-S2' sheet was accompanied by loss of contacts with the H2 helix, including hydrogen bonds with R282 and E286 (Figure 5D). After these changes occurred, the H2 helix became more mobile for the remainder of the simulation.
FIGURE 5.

Propagation of effects of V157F mutation to S2-S2’ sheet and H2 helix. A) Native atom contacts normalized to the number of contacts in the starting structure between S2-S2’ sheet and H2 helix (red) and residues in the core (blue) from a representative V157F simulation. B) Close up of structure from V157F simulation. F157 and L145 shown in space-filling representation, and other side chains shown as sticks. Side chains are colored by atom, and backbone is colored as in Figure 1. C) Distance between centers of mass of residues L111 and N268 (red) and residues Y126 and N268 (blue) from a representative V157F simulation. D) Strand S1, S2-S2’ sheet, and H2 helix from V157F simulation. Hydrogen bonds are shown as dashed lines.
Loss of interactions between H2 helix and L1 loop due to R282W mutation
The R282W mutation on the H2 helix is known to disrupt the loop-sheet-helix motif (29), and in simulations, mostly local effects are observed. The introduction of a tryptophan creates some steric hindrance and cannot compensate for the loss of electrostatic interactions (Figure 5). In the wild-type simulations, R282 was able to form hydrogen bonds with the main chain of the L1 loop. Substitution by tryptophan caused a loss of these hydrogen bond interactions. In R282W simulations, the number of contacts between the H2 helix and the L1 loop decreased from 88 in the starting structure to an average of 24 over the last 25 ns, and all contacts were lost in one run. The L1 loop was very mobile, and in two R282W runs, the L1 loop moved far from the H2 helix. The H2 helix was also destabilized by the mutation due to the loss of interactions. It became distorted and shifted its position up relative to S2 and S2’ strands.
Mutations perturb DNA-binding surface
In the DNA-free crystal structure of wild-type p53, the side chains normally in contact with DNA are highly exposed (Figure 6A). The average total SASA of DNA contact residues was greater in the WT simulations than in the mutant simulations, but it varied greatly between individual runs (Table 1). Still, there were drastic effects on the DNA-binding surface mostly due to the effect of the mutations on the H2 helix.
FIGURE 6.

Local effect of R282W mutation on H2 helix and L1 loop. Side chains of residue 282 and important nearby side chains are shown as sticks and colored by atom. Backbone is colored as in Figure 1.
Although the L145Q mutation is over 17.5 Å from the DNA-binding surface, a large conformational change of the L1 loop and significant movement of the H2 helix was observed in one simulation (Figure 6B). Contacts between the L1 loop and H2 helix were completely lost. The H2 helix moved over toward the L3 loop. Interactions between residues D281 and E285 on the H2 helix and residues S241 and R248 on the L3 loop stabilized this alternate conformation. Compared with the WT simulation, the contacts between these residues persisted longer in the L145Q runs. In this arrangement, many of the DNA contact residues were buried. Only R280 remained accessible to interact with DNA.
The V157F mutant simulations also displayed a distorted DNA-binding surface (Figure 6C). The V157F mutation is over 18 Å from the DNA-binding surface. In the simulations, the H2 helix was destabilized, and although some hydrogen bonds fluctuated, it retained its helicity. It did not exhibit a consistent pattern of movement across individual runs. In one run, the H2 helix moved further away from the L3 loop compared to its initial position in the starting structure. While the DNA contact residues were still exposed, the surface was distorted and the entire H2 helix, including R280, was shifted over. R280 forms critical contacts in the p53-DNA complex at a conserved position (12).
Destabilization of the H2 helix in the R282W mutant also resulted in changes in the DNA-binding surface (Figure 6D). Similar to the H2 movement seen in the L145Q mutant simulations, the H2 helix moved toward the L3 loop in the R282W mutant. DNA contact residues were buried in this conformation.
DISCUSSION
MD simulations were performed of WT, L145Q, V157F, and R282W p53C at 37 °C, providing atomic-level detail of structural effects caused by single nucleotide polymorphisms linked to cancer. Increased Cα-RMSDs of critical regions suggest that the mutants are destabilized. While there were mobile regions in all simulations, the β-sheet structure and S7–S8 loop were highly distorted in the L145Q and V157F simulations. Large movements in the L1 loop and H2 helix were observed in all three mutants. Previous MD studies of WT p53C agree with our results and show large fluctuations and deviations in the L1 loop and the S7–S8 loop (30, 31). Other p53 cancer mutants have been simulated at 25 °C, previously, and these simulations displayed similar conformational changes, such as H2 helix movement and S7–S8 rearrangement (32, 33). While Chen et al. found that common changes occur due to different mutations (32), our simulations show distinct effects among the three mutations in this study. Perhaps due to the higher simulation temperature, our results show disruption of β-sheet structure in strands S1, S3, and S8 caused by the L145Q and V157F mutations that was not observed in previous studies of other mutants.
The increased Cα-RMSDs suggest that the L145Q and V157F mutants are destabilized. Both of these core mutations also resulted in increased SASA of the core and loss of structure in the β-strands. The effects also extend to other regions of the protein, including the loop-sheet-helix motif. The L145Q and V157F mutants are highly destabilized in folding studies and are classified as globally denatured mutants (16). Solution biophysical measurements suggest that the suppressor mutation N235K confers some kinetic and thermodynamic stability to the V157F mutant (34).
The loop-sheet-helix is an important region for stability of p53C. Although the structural effects of the R282W mutation are fairly localized, the structure is destabilized by 3.3 kcal/mol (16). The H2 helix is mobile in the mutant simulations and loses nearly all contacts with the L1 loop. Simulations of the R248Q p53C mutant by Merabet et al. showed similar movement of the H2 helix (33). They have designed second-site suppressors through mutation of the L1 loop, which reestablish contacts between the L1 loop and H2 helix. This approach may be extended to other mutants that are destabilized in this region.
Crystal structures of several mutants, including the R282W mutant, have been solved using the pseudo wild-type T-p53C (29). The four point mutations (M133L, V203A, N239Y, and N268D) in T-p53C stabilize the core domain by 2.6 kcal/mol (29). T-p53C-R282W has a similar overall structure to the wild-type crystal structure. We also found that the R282W mutant simulations were structurally most similar to WT simulations. The L1 loop is disordered in the R282W mutant in experiments (12, 29) and it did not adopt a stable conformation in simulations. Our simulations predict greater disruption of the H2 helix than seen in the T-p53C-R282W crystal structure. The differences are likely due to the different environments and very different temperatures: 37 °C in the simulations versus −173 °C for the crystal structure. In general, the changes in the B-factors along the sequence in the crystal structures of WT p53C and T-p53C-R282W are in agreement with the calculated Cα-RMSFs in our MD simulations of WT and R282W structures, but the 210° difference in temperature naturally affects the amplitudes (Figures 2E, 2F).
The crystal structure of the V157F mutant [PDB entry 2qxa] has only a few local differences with the wild-type structure, specifically rearrangements of the neighboring side chains V218 and I232. In our simulations of the V157F mutant, the side chains of residues F157, V218, and I232 occupy the rotamers observed in the crystal structure for short periods of time. The overall expansion of the core packing allowed for greater fluctuations and larger structural changes. Our simulations predict more dramatic changes than seen in the V157F crystal structure. Again we note, however, that the conditions are different: MD in water at 37 °C versus the crystalline state at 4 °C. Also, the strength of molecular dynamics simulations is that they allow us to see the excursions from the average structure, excursions that can be critical for function (35) or ‘dysfunction’ (36).
Perturbation of the DNA-binding surface, as seen in the simulations, suggests that mutations remote from the binding surface can influence DNA-binding activity. While absence of Zn2+ can alone eliminate sequence-specific DNA-binding (18), mutant simulations show additional effects on the DNA-binding surface beyond disruption of the L2 and L3 loops. Critical DNA-contact residues become buried in the simulations, particularly those shown to be important by Pan and Nussinov (37), discouraging interactions with DNA. The L145Q, V157F, and R282W mutants exhibit DNA-binding activity at sub-physiological temperatures (16). Our simulations show that mutations in the β-sandwich core can have long-range effects on the DNA-binding surface. Disruption of the β-sandwich core packing and sheet structure caused changes in β-strand S1. In the L145Q and V157F simulations, destabilization of S1 was accompanied by changes in the contacts between strands S1 and the S2-S2’ sheet and the contacts between the S2-S2’ sheet and the H2 helix. Loss of contacts between the S2-S2’ sheet and the H2 helix was associated with increased mobility of the helix.
Simulations of p53 cancer mutants may provide insight for the development of a p53-activating compound. The globally destabilized mutants are appealing targets for rescue by a chemical chaperone that would rescue the protein by stabilizing the native conformation (7, 8). Simulations of p53 mutants, which sample a variety of conformations, show surface crevices that form in mutant structures where in principle a ligand could bind (38). Movement of the S7–S8 loop forms a surface crevice between the loop and the S5–S6 loop in one L145Q run. The surface crevice, which is far from the DNA-binding surface, may be a potential binding site for a ligand that may act as a chemical chaperone.
These MD simulations were performed as a part of our SNP database in the lab’s Dynameomics project (38, 39). Further analysis of other p53 SNPs will provide a more comprehensive view of destabilizing mechanisms. Due to the diverse nature of p53 SNPs, studies of p53 may serve as a useful model for predicting the effects of SNPs in other proteins.
FIGURE 7.

DNA-binding interface is distorted in mutant simulations. p53 core domain structures are shown in two different orientations in different graphic representations. On the left, the surface is shown with the side chains of DNA contact residues K120, S241, R248, R273 and R280 are colored red and shown as sticks. The mutated residue is colored blue and shown in space-filling representation. On the right each structure is rotated and show in space-filling mode. In each case the 51 ns snapshot from an apo simulation is provided.
Acknowledgments
We are grateful for computer resources provided by the NIH through the Multi-Tiered Proteomic Compute Cluster (NCRR 1S10RR023044-01). S.C thanks Dr. Peter Anderson for guidance and running some of the simulations described here.
Abbreviations used
- MD
molecular dynamics simulation
- WT
wild-type
- ns
nanoseconds
- PDB
Protein Data Bank
- Cα-RMSD
root-mean-square deviation of Cα atom coordinates from the starting structure
- Cα-RMSF
root-mean-square deviation of Cα atom coordinates about the mean structure
- SASA
solvent accessible surface area
Footnotes
This work was supported by the National Institutes of Health (GMS R01GM050789 to VD).
References
- 1.Vogelstein B, Lane D, Levine AJ. Surfing the p53 network. Nature. 2000;408:307–310. doi: 10.1038/35042675. [DOI] [PubMed] [Google Scholar]
- 2.Vousden KH, Lu X. Live or let die: the cell's response to p53. Nat Rev Cancer. 2002;2:594–604. doi: 10.1038/nrc864. [DOI] [PubMed] [Google Scholar]
- 3.Hollstein M, Sidransky D, Vogelstein B, Harris CC. p53 mutations in human cancers. Science. 1991;253:49–53. doi: 10.1126/science.1905840. [DOI] [PubMed] [Google Scholar]
- 4.Olivier M, Eeles R, Hollstein M, Khan MA, Harris CC, Hainaut P. The IARC TP53 database: new online mutation analysis and recommendations to users. Hum Mutat. 2002;19:607–614. doi: 10.1002/humu.10081. [DOI] [PubMed] [Google Scholar]
- 5.Petitjean A, Achatz MI, Borresen-Dale AL, Hainaut P, Olivier M. TP53 mutations in human cancers: functional selection and impact on cancer prognosis and outcomes. Oncogene. 2007;26:2157–2165. doi: 10.1038/sj.onc.1210302. [DOI] [PubMed] [Google Scholar]
- 6.Cho Y, Gorina S, Jeffrey PD, Pavletich NP. Crystal structure of a p53 tumor suppressor-DNA complex: understanding tumorigenic mutations. Science. 1994;265:346–355. doi: 10.1126/science.8023157. [DOI] [PubMed] [Google Scholar]
- 7.Basse N, Kaar JL, Settanni G, Joerger AC, Rutherford TJ, Fersht AR. Toward the rational design of p53-stabilizing drugs: probing the surface of the oncogenic Y220C mutant. Chem Biol. 2010;17:46–56. doi: 10.1016/j.chembiol.2009.12.011. [DOI] [PubMed] [Google Scholar]
- 8.Boeckler FM, Joerger AC, Jaggi G, Rutherford TJ, Veprintsev DB, Fersht AR. Targeted rescue of a destabilized mutant of p53 by an in silico screened drug. Proc Natl Acad Sci U S A. 2008;105:10360–10365. doi: 10.1073/pnas.0805326105. [DOI] [PMC free article] [PubMed] [Google Scholar]
- 9.Friedler A, DeDecker BS, Freund SM, Blair C, Rudiger S, Fersht AR. Structural distortion of p53 by the mutation R249S and its rescue by a designed peptide: implications for “mutant conformation”. J Mol Biol. 2004;336:187–196. doi: 10.1016/j.jmb.2003.12.005. [DOI] [PubMed] [Google Scholar]
- 10.Selivanova G, Wiman KG. Reactivation of mutant p53: molecular mechanisms and therapeutic potential. Oncogene. 2007;26:2243–2254. doi: 10.1038/sj.onc.1210295. [DOI] [PubMed] [Google Scholar]
- 11.Friedler A, Hansson LO, Veprintsev DB, Freund SM, Rippin TM, Nikolova PV, Proctor MR, Rudiger S, Fersht AR. A peptide that binds and stabilizes p53 core domain: chaperone strategy for rescue of oncogenic mutants. Proc Natl Acad Sci U S A. 2002;99:937–942. doi: 10.1073/pnas.241629998. [DOI] [PMC free article] [PubMed] [Google Scholar]
- 12.Joerger AC, Fersht AR. Structural biology of the tumor suppressor p53. Annu Rev Biochem. 2008;77:557–582. doi: 10.1146/annurev.biochem.77.060806.091238. [DOI] [PubMed] [Google Scholar]
- 13.Veprintsev DB, Freund SM, Andreeva A, Rutledge SE, Tidow H, Canadillas JM, Blair CM, Fersht AR. Core domain interactions in full-length p53 in solution. Proc Natl Acad Sci U S A. 2006;103:2115–2119. doi: 10.1073/pnas.0511130103. [DOI] [PMC free article] [PubMed] [Google Scholar]
- 14.Bullock AN, Henckel J, DeDecker BS, Johnson CM, Nikolova PV, Proctor MR, Lane DP, Fersht AR. Thermodynamic stability of wild-type and mutant p53 core domain. Proc Natl Acad Sci U S A. 1997;94:14338–14342. doi: 10.1073/pnas.94.26.14338. [DOI] [PMC free article] [PubMed] [Google Scholar]
- 15.Pavletich NP, Chambers KA, Pabo CO. The DNA-binding domain of p53 contains the four conserved regions and the major mutation hot spots. Genes Dev. 1993;7:2556–2564. doi: 10.1101/gad.7.12b.2556. [DOI] [PubMed] [Google Scholar]
- 16.Bullock AN, Henckel J, Fersht AR. Quantitative analysis of residual folding and DNA binding in mutant p53 core domain: definition of mutant states for rescue in cancer therapy. Oncogene. 2000;19:1245–1256. doi: 10.1038/sj.onc.1203434. [DOI] [PubMed] [Google Scholar]
- 17.Ang HC, Joerger AC, Mayer S, Fersht AR. Effects of common cancer mutations on stability and DNA binding of full-length p53 compared with isolated core domains. J Biol Chem. 2006;281:21934–21941. doi: 10.1074/jbc.M604209200. [DOI] [PubMed] [Google Scholar]
- 18.Butler JS, Loh SN. Structure, function, and aggregation of the zinc-free form of the p53 DNA binding domain. Biochemistry. 2003;42:2396–2403. doi: 10.1021/bi026635n. [DOI] [PubMed] [Google Scholar]
- 19.Lubin DJ, Butler JS, Loh SN. Folding of tetrameric p53: oligomerization and tumorigenic mutations induce misfolding and loss of function. J Mol Biol. 2010;395:705–716. doi: 10.1016/j.jmb.2009.11.013. [DOI] [PubMed] [Google Scholar]
- 20.Loh SN. The missing zinc: p53 misfolding and cancer. Metallomics. 2010;2:442–449. doi: 10.1039/c003915b. [DOI] [PubMed] [Google Scholar]
- 21.Wang Y, Rosengarth A, Luecke H. Structure of the human p53 core domain in the absence of DNA. Acta Crystallogr D Biol Crystallogr. 2007;63:276–281. doi: 10.1107/S0907444906048499. [DOI] [PubMed] [Google Scholar]
- 22.Levitt M. ENCAD, Energy Calculations and Dynamics. Stanford University; Palo Alto, CA: 1990. [Google Scholar]
- 23.Beck DAC, Alonso DOV, Daggett V. in lucem Molecular Mechanics (ilmm) University of Washington; Seattle, WA: 2000–2010. [Google Scholar]
- 24.Beck DAC, Daggett V. Methods for molecular dynamics simulations of protein folding/unfolding in solution. Methods. 2004;34:112–120. doi: 10.1016/j.ymeth.2004.03.008. [DOI] [PubMed] [Google Scholar]
- 25.Levitt M, Hirshberg M, Sharon R, Daggett V. Potential-Energy Function and Parameters for Simulations of the Molecular-Dynamics of Proteins and Nucleic-Acids in Solution. Computer Physics Communications. 1995;91:215–231. [Google Scholar]
- 26.Levitt M, Hirshberg M, Sharon R, Laidig KE, Daggett V. Calibration and testing of a water model for simulation of the molecular dynamics of proteins and nucleic acids in solution. Journal of Physical Chemistry B. 1997;101:5051–5061. [Google Scholar]
- 27.Kell GS. Precise Representation of Volume Properties of Water at 1 Atmosphere. Journal of Chemical and Engineering Data. 1967;12:66–69. [Google Scholar]
- 28.Beck DAC, Armen RS, Daggett V. Cutoff size need not strongly influence molecular dynamics results for solvated polypeptides. Biochemistry. 2005;44:609–616. doi: 10.1021/bi0486381. [DOI] [PubMed] [Google Scholar]
- 29.Joerger AC, Ang HC, Fersht AR. Structural basis for understanding oncogenic p53 mutations and designing rescue drugs. Proc Natl Acad Sci U S A. 2006;103:15056–15061. doi: 10.1073/pnas.0607286103. [DOI] [PMC free article] [PubMed] [Google Scholar]
- 30.Lu Q, Tan YH, Luo R. Molecular dynamics simulations of p53 DNA-binding domain. J Phys Chem B. 2007;111:11538–11545. doi: 10.1021/jp0742261. [DOI] [PMC free article] [PubMed] [Google Scholar]
- 31.Duan J, Nilsson L. Effect of Zn2+ on DNA recognition and stability of the p53 DNA-binding domain. Biochemistry. 2006;45:7483–7492. doi: 10.1021/bi0603165. [DOI] [PubMed] [Google Scholar]
- 32.Chen JM, Rosal R, Smith S, Pincus MR, Brandt-Rauf PW. Common conformational effects of p53 mutations. J Protein Chem. 2001;20:101–105. doi: 10.1023/a:1011065022283. [DOI] [PubMed] [Google Scholar]
- 33.Merabet A, Houlleberghs H, Maclagan K, Akanho E, Bui TT, Pagano B, Drake AF, Fraternali F, Nikolova PV. Mutants of the tumour suppressor p53 L1 loop as second-site suppressors for restoring DNA binding to oncogenic p53 mutations: structural and biochemical insights. Biochem J. 2010;427:225–236. doi: 10.1042/BJ20091888. [DOI] [PubMed] [Google Scholar]
- 34.Tan YH, Chen YM, Ye X, Lu Q, Tretyachenko-Ladokhina V, Yang W, Senear DF, Luo R. Molecular mechanisms of functional rescue mediated by P53 tumor suppressor mutations. Biophys Chem. 2009;145:37–44. doi: 10.1016/j.bpc.2009.08.008. [DOI] [PMC free article] [PubMed] [Google Scholar]
- 35.Storch E, Daggett V. Molecular Dynamics Simulations of Cytochrome b5: Implications for Protein-Protein Recognition. Biochemistry. 1995;34:9682–9693. doi: 10.1021/bi00030a005. [DOI] [PubMed] [Google Scholar]
- 36.Rutherford K, Daggett V. Polymorphisms and Disease: Hotspots of Inactivation in Methyltransferases. Trends in Biochem Sci. 2010;35:531–538. doi: 10.1016/j.tibs.2010.03.007. [DOI] [PMC free article] [PubMed] [Google Scholar]
- 37.Pan Y, Nussinov R. Preferred drifting along the DNA major groove and cooperative anchoring of the p53 core domain: mechanisms and scenarios. J Mol Recognit. 2010;23:232–240. doi: 10.1002/jmr.990. [DOI] [PMC free article] [PubMed] [Google Scholar]
- 38.van der Kamp MW, Schaeffer RD, Jonsson AL, Scouras AD, Simms AM, Toofanny RD, Benson NC, Anderson PC, Merkley ED, Rysavy S, Bromley D, Beck DAC, Daggett V. Dynameomics: a comprehensive database of protein dynamics. Structure. 2010;18:423–435. doi: 10.1016/j.str.2010.01.012. [DOI] [PMC free article] [PubMed] [Google Scholar]
- 39.Beck DAC, Jonsson AL, Schaeffer D, Scott KA, Day R, Toofanny RD, Alonso DOV, Daggett V. Dynameomics: Mass annotation of protein dynamics and unfolding in water by high-throughput atomistic molecular dynamics simulations. Protein Engineering Design and Selection. 2008;21:353–368. doi: 10.1093/protein/gzn011. [DOI] [PubMed] [Google Scholar]