

Abstract
Motivation: Current gene set enrichment approaches do not take interactions and associations between set members into account. Mutual activation and inhibition causing positive and negative correlation among set members are thus neglected. As a consequence, inconsistent regulations and contextless expression changes are reported and, thus, the biological interpretation of the result is impeded.
Results: We analyzed established gene set enrichment methods and their result sets in a large-scale investigation of 1000 expression datasets. The reported statistically significant gene sets exhibit only average consistency between the observed patterns of differential expression and known regulatory interactions. We present Gene Graph Enrichment Analysis (GGEA) to detect consistently and coherently enriched gene sets, based on prior knowledge derived from directed gene regulatory networks. Firstly, GGEA improves the concordance of pairwise regulation with individual expression changes in respective pairs of regulating and regulated genes, compared with set enrichment methods. Secondly, GGEA yields result sets where a large fraction of relevant expression changes can be explained by nearby regulators, such as transcription factors, again improving on set-based methods. Thirdly, we demonstrate in additional case studies that GGEA can be applied to human regulatory pathways, where it sensitively detects very specific regulation processes, which are altered in tumors of the central nervous system. GGEA significantly increases the detection of gene sets where measured positively or negatively correlated expression patterns coincide with directed inducing or repressing relationships, thus facilitating further interpretation of gene expression data.
Availability: The method and accompanying visualization capabilities have been bundled into an R package and tied to a grahical user interface, the Galaxy workflow environment, that is running as a web server.
Contact: Ludwig.Geistlinger@bio.ifi.lmu.de; Ralf.Zimmer@bio.ifi.lmu.de
1 INTRODUCTION
Transcriptomic studies measure gene expression in different conditions. Striking genes, which are differentially regulated between the conditions, are of primary interest and investigated for common features and membership in group of genes, which have the same function or belong to the same biochemical pathway.
A first impression of similar behavior of genes can be achieved via clustering of genes (Eisen et al., 1998). The usually more effective overrepresentation analysis (ORA) tests the overlap of a predefined group of genes and the set of differentially expressed genes assuming the hypergeometrical distribution under the null hypothesis (Breitling et al., 2004). The method is widely accepted and has been subject to modifications of diverse visual and model related features (see Khatri and Draghici, 2005, for an overview), though the basic statistical principle remained unchanged. However, Goeman and Bühlmann (2007) criticize that the sampling procedure of ORA is statistically invalid and leads to a hazardous interpretation of the resulting P-value. Furthermore, the concentration on the usually small group of significantly differentially expressed genes, compared with the set of all the other, usually thousands of genes analysed in the study that are ignored, is not suitable for an investigation on a global scale.
Both points of criticism are resolved in Gene Set Enrichment Analysis (GSEA) as it uses a valid sampling procedure and computes over the whole scope of genes (Subramanian et al., 2005). A Kolmogorov–Smirnov test statistic is applied to test whether the ranks of the P-values of the genes in the gene set can be a sample from a uniform distribution. Several modifications of GSEA have been published (see Dinu et al., 2009, for an overview).
Though ORA and GSEA are convenient in the analysis of genes that are independently expressed, a serious problem arises when these methods are applied to gene set definitions extracted from regulatory networks and metabolic pathways. The assumption of independence among set members does not hold anymore; genes are found to be correlated due to mechanisms of co-regulation and co-expression. Initial steps to deal with that problem include implicit accounting for the correlation structure (e.g. Barry et al., 2005) and integration of network topology of undirected interaction networks (e.g. Ulitsky and Shamir, 2007). Based on these first efforts, Liu et al. (2007) have proposed Gene Network Enrichment Analysis (GNEA) that uses ORA to test for overrepresentation of gene sets in transcriptionally affected subnetworks of a global interaction network.
As the sign of gene expression changes and the direction of regulatory interactions are so far not taken into account, substantial features of the data are still ignored and the dynamics of the transcriptomic system are not realistically reflected. Activation and inhibition are essential regulatory mechanisms in the transcriptional machinery of the cell and are causes for up- and down-regulation of particular genes. Although processes like post-translational modification and combinatorial effects between regulatory proteins impair a straightforward causal relationship between regulation and gene expression, it was shown that coexpression is correlated with functional relationships between genes (Lee et al., 2004). Additionally, integrative analysis of transcriptome, proteome and interactome data revealed significant correlations between expression profiles and regulatory interaction on the protein level (Ge et al., 2001; Jansen et al., 2002). Hence, we explain positive correlation in gene expression with activating edges of the transcriptional network. Vice versa, we assume inhibition to cause observed anti-correlation in gene expression patterns. In our following definition of Gene Graph Enrichment Analysis (GGEA), we exploit both fundamental regulation types in a novel enrichment framework for signed and directed gene regulatory networks, to judge whether the topology of the network is well fitted by the expression data.
2 METHODS
2.1 GGEA
Given gene regulatory information, for example extracted from biochemical pathways or a global transcriptional network, a gene set under investigation and gene expression data sampling different conditions, GGEA performs three essential steps (Fig. 1): first, the gene set is mapped onto the underlying regulatory network, yielding an induced subnetwork. That is the affected part of the network, which consists of edges that involve members of the gene set. Second, each edge of the induced network is scored for consistency with the expression data, i.e. the signs of the expression changes of two interaction partners are evaluated for agreement with the regulation type (activation/inhibition) of the link that connects both genes. Third, the edge consistencies are summed up over the induced network, normalized and estimated for significance using a permuation procedure.
Fig. 1.
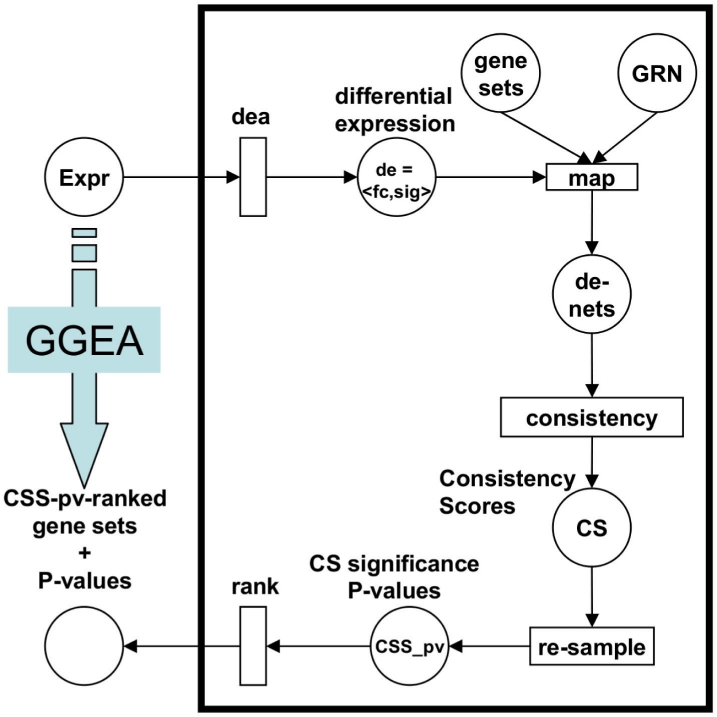
Key Steps of GGEA. Subsequent to differential expression analysis dea of expression data Expr, yielding fuzzified measures de of differential expression, target gene sets are first mapped onto the GRN. The de-values are assigned to corresponding places in resulting induced nets (de-nets). Second, consistency scores are computed for each de-net and third, significance of the scores is estimated via re-sampling and exploited to rank the gene sets.
Experimental setup:
in the following, we consider the classical setup of a transcriptomic study. This incorporates a set G of usually several thousand genes gi (i=1,…, n) measured for differential expression between two conditions, each represented by a group of samples S1={s1,…, sk} and S2={sk+1,…, sm}, respectively. The function
| (1) |
returns the expression value for a gene and a sample at a time.
Measures of differential expression:
the most intuitive measure for expression changes of a single gene between two conditions is the fold change
| (2) |
defined as the ratio of the estimated expression values of a particular gene in both sample groups
| (3) |
where expr(g,S) computes the mean expression level of gene g in condition S. We compute t-test derived P-values to assess the statistical significance of the expression changes (Pan, 2002) and correct them for multiple testing. Both measures are log transformed
| (4) |
and the significance thresholds α=−log(0.05) and β=1 (2−fold) are used as defaults for  and
and  , respectively. Such sharp thresholds are of course quite artificial and discriminate drastically between genes just over and just below α or β. In addition, noise in the data, such as imprecise and erroneous measurements of gene expression values, has to be expected and to be dealt with. Hence, we divide the range of both measures into two main categories and smooth the borders via introduction of a degree of uncertainty, according to the mathematical concept of fuzzyfication (Windhager and Zimmer, 2008; Windhager et al., 2010; Zadeh, 1963). For the fold change, we map
| (5) |
and compute membership values for both categories via the weighting functions  (displayed in Fig. 2b), resulting in a pair
| (6) |
Analogously, we map  , using Figure 2a, to areas of low and high significance in the fuzzy concept
| (7) |
For both measures, a third category can optionally be introduced to account for unspecific signals in case of very noisy data. The fold change and P-value categories are combined to a single measure of differential expression
| (8) |
in order to simultaneously summarize and express whether the transcriptional activity of a particular gene is reduced or enhanced in one sample group, compared with the other.
Fig. 2.

Fuzzyfication of (a) P-value and (b) fold change. Both measures are mapped onto two main categories, each having a membership function to express the uncertainty of the mapping. Additional categories, e.g. a third category medium and neutral, respectively, can be introduced for a more detailed representation.
Induced gene regulatory networks:
enrichment analysis is the determination of significant gene sets out of a predefined universe of gene sets U, s.t. result sets accumulate differentially expressed features of the gene expression data. GGEA uses an a priori defined gene regulatory network (GRN), typically extracted from respective databases or compiled from the relevant literature, to introduce and exploit the interdependencies between gene set members. We model a regulatory interaction of the GRN as a transition t (Fig. 3) with an input place for the regulator and an output place for its target, as well as an associated effect (activation, inhibition) and the direction of the interaction. For a gene set u∈U, we construct the induced subnetwork
| (9) |
s.t. for each gene g of the gene set u all transitions are extracted, where g is either the regulating or the regulated gene.
Fig. 3.

Modelling regulatory interactions using PNFL. Shown is a KEGG style representation of an activation and its transformation into a PNFL transition f+. Tokens of combined fuzzy measures de of differential expression assigned to Petri net (PN) places, represent the regulator and its target. The regulatory effect is defined via a specific fuzzy rule for every effect type of the GRN.
GRNs as Petri Nets:
Petri net (PN) models are well established in information theory (see Murata, 1989, for a review) and have been extensively applied to biochemical processes, like metabolic pathways (e.g. Küffner et al., 2000) and gene regulatory networks (reviewed in Chaouiya, 2007). Given a GRN under investigation, we construct a corresponding PN having features of fuzzy logic (FL), as it is introduced as PNFL in Küffner et al. (2010), and illustrated in Figure 3. The regulations of the GRN are required to be specified with direction and effect. In our model, regulator (R) and regulated target (RT) are represented via PN places holding tokens of fuzzy values for both fold change (fc) and significance of fc (sig). The variety of regulatory effects occuring in the GRN are defined by specific fuzzy rules reg∈{f+,f−,f+−,f?,…} (Table 1), meaning activation f+, inhibition f− and dual effects f+−. The concept is extendable, e.g. to other effects like interactions of unknown type f?. The fuzzy rules compute output tokens from given input tokens. Thus, consistency between expected (i.e. modeled) behaviour and the measured values can be evaluated. Consistency takes the direction of the effect, the amount (fc) and its significance into account and is a straightforward extension of the discrete notion of consistency (e.g. R up and f+⇒RT up). Moreover, it appropriately models noise in the actual experimental measurements.
Table 1.
Fuzzy rule set for activation and inhibition
| 〈fc〉 |
〈sig〉 |
|||
|---|---|---|---|---|
| Down | Up | Low | High | |
| f+ | Down | Up | Low | High |
| f− | Up | Down | Low | High |
Consistency of regulatory interactions:
the major problem of set enrichment strategies, when applied to GRN-based gene sets, is that they accumulate evidence for differential expression of single genes to estimate the enrichment of the whole set. Interfering and potentially contrary constraints of the underlying GRN are ignored. For example, two significantly up-regulated genes increase the enrichment of the set, even if one gene inhibits the other. For that reason, we introduce the concept of consistency.
Definition (consistency): a transition of a PNFL is consistent with given expression data, if the measured and the modeled expression of the regulated gene is in agreement. The modeled expression is estimated from the regulatory effect and the expression of the regulator.
Intuitively, consistency for the special case of a simple activating or inhibiting edge requires fold changes for regulator and target of the same or opposite directions, respectively. It is implied for the above example that an up-regulated inhibitor should result in reduced expression of the affected gene.
For the PN constructed above, a consistent transition t with fuzzy regulation function ft between an input place i and an output place o satisfies
| (10) |
i.e. the modeled predicted expression behaviour agrees with the actual observed behaviour.
Scoring:
to determine if and to which extent t is consistent with the given expression data, we calculate the consistency
| (11) |
where the function cons estimates the (fuzzy) similarity between the predicted and measured token on the output place of transition t. Consistency computation is generic, an example implementation of cons incorporates defuzzyfication of the fuzzy values back into real numerical values (Küffner et al., 2010) and taking their reciprocal absolute difference. We compute the raw GGEA consistency score S for the subnetwork GRN(u), induced by the gene set u∈U, via summation over the consistencies of all transitions Tu of GRN(u)
| (12) |
and normalize it by the number of transitions |Tu|
| (13) |
to adjust for the size of GRN(u).
Significance and ranking:
according to the recommendations of Goeman and Bühlmann (2007) and Gatti et al. (2010), statistical significance of the consistency score is estimated via a permutation approach based on subject sampling, which is defined in a self-contained way:
Permute group assignment of samples N times.
Recalculate differential expression measures for each permutation.
Recalculate consistency score for each permutation.
Find the consistency P-value as the proportion of permutation scores that are larger than the observed score.
We compute the consistency P-value for each gene set u∈U and rank the gene sets by the adjusted P-values, i.e. P-values corrected for multiple testing (see again Fig. 1). Gene sets below the chosen significance niveau are classified as significantly and consistently enriched.
Extensions:
to apply to regulation processes involving multiple regulators and transcription complexes composed of several genes, we allow a transition t to have an arbitray number of inputs It={it1,…, itk} and outputs Ot={ot1,…, otl}. This is accomplished via generalization of Equation (10) to
| (14) |
We model the combined effect via computation of the average behaviour of all effects, or optionally, by the effect of highest statistical significance [the effect could, of course, also be modelled as a full-blown k-dimensional (fuzzy) function].
Missing data, i.e. genes of the GRN, which are not measured in the study, is resolved using transitivity. By going up and down, respectively, the regulation path until a non-empty place is reached, an empty origin is filled with the found token, which is adjusted to path length of the transitive relation. The adjustment is due to the fact that the evidence for regulation weakens, as the path length increases.
Implementation and availability:
GGEA is implemented in the statistical language R (Ihaka and Gentleman, 1996) and makes use of the Bioconductor software suite (Gentleman et al., 2004). The GGEA method and accompanying visualization capabilities have been bundled into an R package and tied to a grahical user interface, the Galaxy workflow environment (Goecks et al., 2010), that is running as a web server.
2.2 Consistency and explainability study setup
Data sampling and network construction:
gene expression data of Escherichia coli was collected and sampled from the M3D database (Many Microbe Microarrays Database, Faith et al., 2008). The 1000 datasets were designed in a two-class fashion, s.t. each class contained 15 samples. It was assured that real-world distributions of fold changes and differential expression P-values were matched. A global gene regulatory network for E.coli was constructed using the regulatory interactions provided in the RegulonDB database (Gama-Castro et al., 2008). From the union of all stored TF/gene, TF/operon, TF/TF, σ/gene and σ/TU regulatory interactions (TF stands for transcription factor, TU for transcriptional unit and σ for the RNA polymerase σ-factor), we removed duplicated and ambiguous edges. The final network connected 2097 unique nodes by 5784 edges, which were clearly annotated as either activating or inhibiting.
Methods collection and gene set definitions:
for each dataset, we applied the standard hypergeometrical overrepresentation test ORA1, and a collection of array resampling methods that correctly control false positive rates and gene correlation patterns (Gatti et al., 2010). These are the modified resampling overrepresentation test ORA2 (Goeman and Bühlmann, 2007), SAFE (Barry et al., 2005), GSEA (Subramanian et al., 2005) and SAM-GS (Dinu et al., 2009). The gene set catalogue for analysis was defined on the one hand according to the kyoto encyclopedia of genes and genomes (KEGG) pathway annotation (Ogata et al., 1999) for E.coli, and, on the other hand, according to the gene ontology (GO) classifications (Ashburner et al., 2000) of E.coli. We restricted both catalogues to gene sets having at minimum 5 and at maximum 500 set members. This yielded 83 and 446 gene sets for KEGG and GO, respectively.
Consistency benchmark:
for each method, we collected for all datasets with statistical significant outcome (P<0.05) the top ranked gene sets. As not all datasets produced significant outcome for all methods, we uniformly chose 700 sets at random from these top ranked gene sets and computed the percentage of consistent relations in the corresponding induced regulatory networks. We took regulation direction, type and strength into account and distinguished respective categories. Activating relations required both interaction partners to be expressed in the same direction to be consistent, while inhibiting relations required them to be expressed in the opposite direction. Regulation strength was categorized as weak and strong, depending on the differential expression P-value of the regulator. We chose 0.5 and 0.05 as the thresholds for the weak and the strong category, respectively. To estimate the null distribution in each category, we computed the consistency of all gene sets in all datasets.
Explainability benchmark:
the selected 700 top ranked sets were restricted to differentially expressed genes of high statistical significance. The significance niveau was set to 0.1. Minimum spanning trees (MST) were computed for each of the reduced gene sets according to the underlying global GRN, s.t. each significant gene of a top ranked set could be reached by all other significant members of that set. Moreover, the corresponding MST for such a set minimized the number of genes not contained in the set. The direction of the regulatory link between two genes in the network (activation/inhibition) as well as the direction of the expression change of individual genes (down-/up-regulation) was ignored. We classified a restricted result set as fully explainable if all members were directly connected to another member in the corresponding MST. Otherwise, we counted the number x of genes in the MST, which were not a member of the set, and classified the set as explainable with x additional genes. As a measure of explainability achieved by a method in all its 700 top ranked sets, we calculated, for a chosen number x, the percentage of sets that were explainable with at most x additional genes.
2.3 Case study setup
FiDePa and local GGEA:
we applied GGEA to the glioma dataset that has been investigated before with the method FiDePa (Keller et al., 2009). The method exploits GSEA first to determine differentially regulated paths of a particular length and uses the resulting paths for the construction of a consensus network, which is subsequently tested for overrepresentation of gene sets. In a similiar approach, we computed consistency scores of regulatory links in all human non-metabolic KEGG pathways (gene regulatory and signalling pathways) and the 10 edges with the highest consistency score were extracted from each of them. Duplicated edges were removed and the consensus graph was further reduced via application of a high pass consistency filter using the mean consistency score as threshold. That yielded a total of 378 edges connecting 342 unique nodes, which were tested, as in FiDePa, for overrepresentation.
3 RESULTS
3.1 Consistency study
We conducted a meta-analysis of 1000 E.coli datasets and evaluated the consistency within results of gene set enrichment methods, based on the regulatory interactions found in the transcriptional network of E.coli. Details of the study setup, the consistency benchmark and the classification of interaction strength as weak and strong are described in Section 2. The results for KEGG gene sets are shown in Figure 4(a–d) and for GO gene sets in Figure 4(e–h).
Fig. 4.

Consistency of regulatory interactions in top ranked sets. Plots (a)–(h) are explained in the main text. Each of the set enrichment methods was applied to 1000 E.coli datasets using KEGG and GO gene set definitions, respectively. From datasets with statistical significant outcome, the top ranked gene sets were collected and investigated for consistency of weak and strong activation and inhibition (as described in Section 2). GGEA results are displayed in red. The plots show which fraction (x-axis) of the identified gene sets had at most a consistency of y%. The y-axis shows the consistency of sets as the fraction of consistent regulatory interactions in the respective gene set. The null consistencies were estimated via the overall consistency of all gene sets in all datasets and are displayed in dark blue.
We observe that the set enrichment methods systematically neglect mutual regulation among set members. For KEGG gene sets, weak regulations [Fig. 4a (activations), Fig. 4b (inhibitions)] are only slightly more consistent than average (the null consistency) and the gene set with maximal consistency is frequently not reported by the set enrichment methods, regardless of activatory or inhibitory links. Strong activators, with an expression change of high statistical significance, and the effects on their targets are more consistently aligned (Fig. 4c). However, the consistency gained in strong activations is lost for strong inhibitions (Fig. 4d). The results for KEGG sets are nearly replicated in GO gene sets (Fig. 4e–h). In contrast, GGEA, which takes consistency into account for selecting relevant gene sets in the first place, yields the most consistent gene sets in all categories for both, KEGG and GO gene set definitions. Activations and inhibitions are similarily consistent, if adjusted to background distributions of both regulation types, and stronger signals are properly weighted in order to preserve the regulation kinetics. Although stronger signals have an higher impact on the GGEA score, weak regulations are also highly consistent in the sets found by GGEA. In general, these findings are more pronounced for GO sets, compared with KEGG gene set definitions. This is due to the fact that the GO catalogue (446 gene sets) is nearly six times larger and contains more diverse composed gene sets than the KEGG catalogue (83 gene sets), which emphasizes differences between the set and graph enrichment methods.
3.2 Explainability study
As the consistency is substantially incorporated in the GGEA score, we performed a second evaluation using the more independent benchmark of explainability, as described in Section 2. The main target of this investigation was to determine to which extent statistical significant expression changes of single genes can be explained by other set members. Considering that a statistical significant finding for a gene set indicates differential regulation of the corresponding biological process, it is in turn implied that a part of the global regulatory network (here a subgraph of RegulonDB) exists, which connects the differentially expressed genes in this set. However, it is frequently observed that important regulators or mediators are missing in a particular gene set, leaving its differentially expressed genes not connected with each other. As a result, the biological interpretation of the observed effect is impeded. Based on these considerations, we have introduced above the terms fully explainable and explainable with x additional genes, to assess how easily a result set can be interpreted. Intuitively, the less additional genes needed, the easier the interpretation: a single additional gene could possibly be a regulator or mediator not contained in the set, while the need of several additional genes requires more complex assumptions to make the outcome interpretable. For the explainabilty study, we explicitly made the input regulatory network undirected, generalizing the edges, s.t. possibly unknown inverse regulations are allowed. We enhanced this feature by additionally removing the sign of the fold change and only judged whether a gene was differentially expressed or not. The results are shown in Figure 5.
Fig. 5.
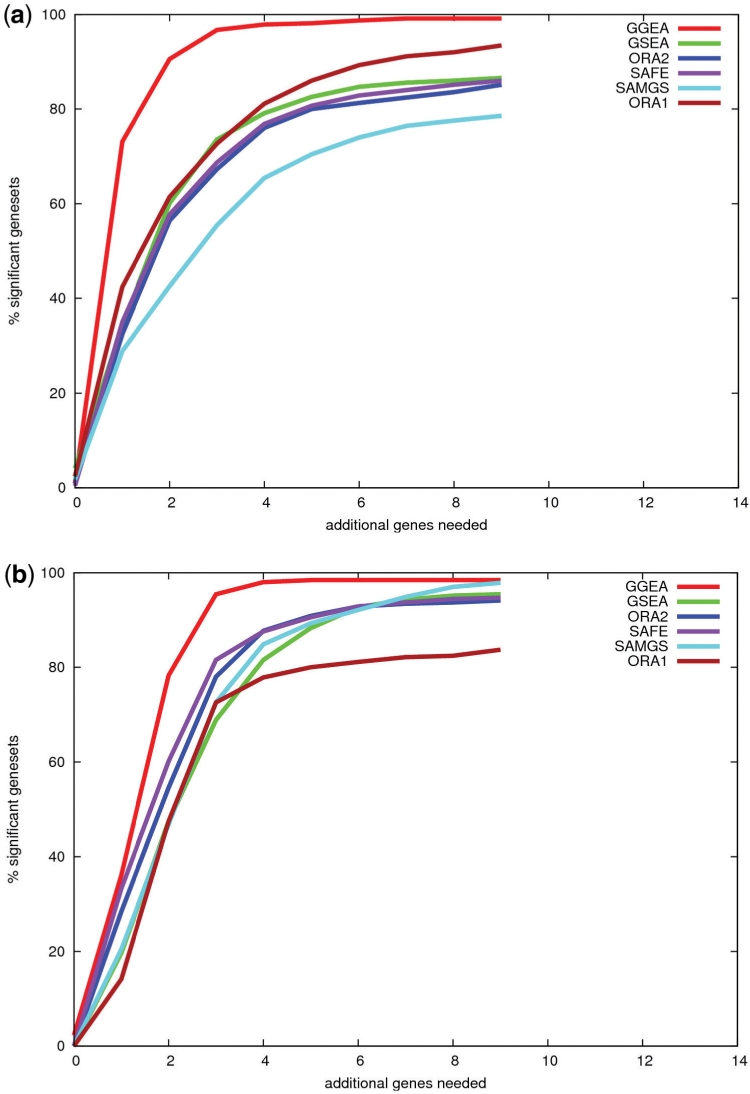
Explainability of expression changes in top ranked sets. The 700 top ranked gene sets (introduced in the consistency study above) of each method were restricted to genes with expression changes of statistical significance. For each restricted set, we computed the minimal number of genes not in the set, but needed to connect the significantly regulated genes of that set, to a regulation network. Displayed is the percentage of gene sets, for which x or less additional genes are needed. E.g. for GO sets (Fig. 5a), a single additional gene makes 73% of GGEA's top ranked sets explainable, while in case of ORA1 or SAMGS a single gene makes only 42 or 29% of the top ranked sets, corresponding to each method, explainable. The results are similar for KEGG sets (Fig. 5b).
GGEA systematically reports more easily explainable sets than all other methods for both, KEGG and GO gene set definitons. Similar to the results of the consistency study, the gap is much bigger between the performance of GGEA and the other methods when using GO sets definitions, as also observed in the consistency study. For example, GGEA needs in 73% of its top ranked gene sets a single additional gene to make the differentially expressed genes in a particular set connected, whereas the best set enrichment method, ORA1, can explain only 42% of the sets with a single addition gene (SAFE: 35%, GSEA: 34%, ORA2: 32%, SAMGS: 29%). Allowing two additional genes, GGEA can explain >90% of all reported gene sets, while all other methods produce results ≤60%.
3.3 Case study
In a final case study, we investigated two expression datasets of human neuronal tumours and compared results of GGEA and set enrichment strategies. Though a comparative benchmark is hard to find, due to a missing gold standard that classifies detected pathways as right or wrong in the context of the investigated expression data, we approached this matter via collection of biological evidence in the scientific literature and focussed on the specificity of the findings and the sensitivity of the method used. For consistency evaluation, we used the regulatory interactions occuring in human non-metabolic KEGG pathways (gene regulatory and signalling pathways). In the first analysis, we applied GGEA to the glioma dataset that was investigated before by Keller et al. (2009) with the method FiDePa (see Section 2 for details). We observe large agreement in the result lists of both methods (Table 2); 17 pathways listed in the FiDePa result also occur in the top 25 of the GGEA ranking. The positive control Glioma is better ranked (and has higher significance) by GGEA. Further, several unspecific and disease unrelated pathways detected by FiDePa (e.g. Type I/II diabetes mellitus, cell cycle) are discarded by GGEA and replaced by specific, cancer-related pathways (e.g. renal cell carcinoma, endometrial cancer). For the top rank, GGEA (Pathways in Cancer; not detected by FiDePa) gives a clear disease-related hint, while FiDePa (MAPK signalling pathway) reports a general signalling process. The Neurotrophin signalling pathway, which promotes neuronal tumors via modulation of neuronal apoptosis (Miller and Kaplan, 2001) is not identified by FiDePa, but listed by GGEA on rank 4.
Table 2.
Result comparison of GGEA and FiDePa application to the glioma dataset
| Pathway | ORA P (GGEA) | ORA P (FiDePa) | Rank (FiDePa) |
|---|---|---|---|
| ↑ Pathways in cancer | 1.8e-24 | – | – |
| ↑ Focal adhesion | 1.4e-18 | 2.5e-06 | 5 |
| ↑ T cell receptor signalling | 1.2e-17 | 1.5e-05 | 7 |
| ↑ Neurotrophin signalling | 5.5e-15 | – | – |
| ↑ Colorectal cancer | 1.1e-14 | 9.4e-05 | 11 |
| ↑ Pancreatic cancer | 3.8e-14 | 0.0001 | 12 |
| ↑ Renal cell carcinoma | 1.3e-13 | – | – |
| ↑ VEGF signalling | 1.5e-13 | 0.006 | 22 |
| ↔ Fc epsilon RI signalling | 4.1e-13 | 1.9e-05 | 9 |
| ↓ Chronic myeloid leukaemia | 6.3e-13 | 1.65e-05 | 8 |
| ↑ ErbB signalling | 8.9e-13 | – | – |
| ↑ B cell receptor signalling | 4.2e-12 | 0.001 | 17 |
| ↑ Glioma | 5.1e-12 | 0.003 | 20 |
| ↑ Insulin signalling | 3.2e-11 | 0.001 | 18 |
| ↑ Leucocyte transendothelial migration | 3.9e-11 | 0.01 | 24 |
| ↓ Adherens junction | 4.9e-11 | 1.4e-05 | 6 |
| ↓ GnRH signalling | 6.5e-11 | 0.0003 | 16 |
| ↓ Nature killer cell mediated cytotoxicity | 6.5e-11 | 1.4e-11 | 2 |
| ↑ Wnt signalling | 1.2e-10 | – | – |
| ↓ Toll-like receptor signalling | 1.2e-09 | 5.5e-05 | 10 |
| ↑ Endometrial Cancer | 1.6e-07 | – | – |
| ↑ Non-small cell lung cancer | 3.4e-07 | – | – |
| ↑ Acute myeloid leukaemia | 3.9e-07 | – | – |
| ↓ mTOR signalling | 1.2e-06 | 0.0002 | 15 |
| ↓ MAPK signalling | 4.4e-06 | 1.6e-25 | 1 |
| … | … | … | … |
| ↓ Apoptosis | 0.04 | 9.3e-11 | 3 |
Arrows in the first column denote whether a pathway is ranked higher or lower by GGEA, compared with FiDePa.
In the second evaluation study, we used neuroblastoma expression data that was investigated for enrichment of metabolic pathways before (Schramm et al., 2010). The application of GGEA to the neuroblastoma dataset identified 17 significantly and consistently enriched pathways (Table 3). Best ranked is the neurotrophin signalling pathway, which was already detected in the glioma study to play an essential role in the development of neuronal tumors. As this pathway seemed to be particularly striking for both tumors, we determined regulations with highest consistency in that pathway, in order to get a deeper insight into the disease-causing dynamics: we found that the high affinity nerve growth factor receptor, which in humans is encoded by the NTRK1 gene, is up-regulated in neuroblastoma cells and activates the adaptor protein SH2B3, the growth factor receptor-bound protein 2 (GRB2), the Abelson murine leukaemia viral oncogene homolog 1 (ABL1), the phospholipase gamma 2 (PLCG2) and the SHC-transforming protein 1 (SHC1). A literature search revealed that all the activated and associated proteins are proliferating, oncogenic and/or apoptosis influencing and thus, of cancer promoting importance (e.g. Borrello et al., 1994; Ohmichi et al., 1991). In addition, the up-regulation of the whole NTRK1 proliferation module in neuroblastoma was experimentally validated (Evangelopoulos et al., 2004) some years ago. This sensitive finding motivated a similar investigation for the other pathways in Table 3, which we identified to be throughout substantially involved in neuroblastoma formation. As an example: GGEA detects the Chemokine signalling pathway. We found that neuroblastoma impairs chemokine-mediated dendritic cell migration (Walker et al., 2006) and chemokines strongly promote neuroblastoma primary tumour and metastatic growth (Meier et al., 2007).
Table 3.
Result of GGEA application to the neuroblastoma dataset
| Pathway | P-value |
|---|---|
| Neurotrophin signalling | 7.5e-06 |
| Chemokine signalling | 0.0004 |
| Cell adhesion molecules (CAMs) | 0.0021 |
| Regulation of actin cytoskeleton | 0.0068 |
| Focal adhesion | 0.0091 |
| Natural killer cell mediated cytotoxicity | 0.0092 |
| Leucocyte transendothelial migration | 0.0099 |
| Pathways in cancer | 0.01 |
| T cell receptor signalling | 0.016 |
| Fc epsilon RI signalling | 0.019 |
| Long-term depression | 0.023 |
| Axon guidance | 0.033 |
| Vascular smooth muscle contraction | 0.035 |
| p53 signalling pathway | 0.035 |
| Melanogenesis | 0.039 |
| MAPK signalling | 0.043 |
| Thyroid cancer | 0.05 |
Moreover, we wanted to know whether the findings of GGEA are in concordance with the results for metabolic pathways. As a showcase, we demonstrate this via the detected Fc epsilon RI signalling pathway. In Schramm et al. (2010), only moderate attention (discussed in their supplement) is paid to the extremely significant findings for phosphatidylinositol metabolism (P=9e-12) and for several pathways concerning the metabolism of lipids and fatty acids, e.g. fatty acid metabolism (P=1.7e-9) and glycerophospholipid metabolism (P=3.9e-7), which are listed in Table 1 of that publication. As it can be verified in the corresponding KEGG pathway maps, Fc epsilon RI signalling has a regulatory impact on both—the Phosphatidylinositol metabolism via modulation of the phospholipase (affected by the neurotrophin pathway) and the metabolism of lipids in general via stimulation of arachidonic acid synthesis. Arachidonic acid is a polyunsaturated fatty acid that is required for membrane phospholipid synthesis. It is also involved in cellular signalling and known to activate syntaxin-3, which causes cell membrane expansion of neuronal cells (Darios and Davletov, 2006). Schramm et al. explain the several revealed signals in lipid-related metabolisms with TCA-based energy production; the GGEA results, explaining stimulation of arachidonic acid synthesis, imply that the observed activated production of fatty acids and lipids (which is based on the latter) is rather due to the increased requirement of neuronal membrane material (i.e. specific lipids) in the fast growing and dividing neuroblastoma cells.
4 DISCUSSION
In this work, we presented Gene Graph Enrichment Analysis (GGEA), a novel algorithmic framework to detect increased agreement between positively and negatively correlated expression patterns of genes, connected by activating and inhibiting edges in signed and directed transcriptional networks. The method exploits directed regulatory relations represented as fuzzy logic rules to assess and identify graphs, which maximize the consistency between the regulatory network and the expression data. GGEA is a major improvement to current gene set enrichment strategies, as we found experimentally validated regulatory interactions not to be consistent per se with the expression data in top ranked and statistically significant result sets of these methods. That was validated in a large-scale consistency study of 1000 E.coli chips using the E.coli RegulonDB, currently the best curated regulatory network, for the investigation of consistency. As set enrichment strategies ignore mutual regulation among set members, we observed that activations and inhibitions are only average consistent with the gene expression in these result sets. Even strong causal signals, i.e. a regulator with differential expression of high statistical significance, in pairwise directed regulations were frequently not properly reflected. Inhibitions were more seriously neglected than activations. This is partly due to a data bias, as there are more activations than inhibitions in the database. Hence, more genes, and thus also more significant genes, are involved in activations just by chance. As gene set enrichment analysis mainly computes upon the leading edge of the ranked P-value vector of genewise differential expression (see Subramanian et al., 2005), gene sets with a majority of activating genes are more likely to be reported. On the other hand, we found activitations clearly better conserved than inhibitions across all experiments stored in the M3D database. For GGEA, we observed, under consideration of this bias, that activations were nearly optimally consistent and inhibitions were preserved in a large fraction of regulations. GGEA achieved the highest concordance between the regulation direction and the expression behaviour of the incorporated regulator and regulated target gene. It should be emphasized that GGEA consistently aligned weak (only moderately differentially expressed) signals, which are usually not taken into account by set enrichment methods. That improved sensitivity enables preference of weak, but coherent regulations over strong, but contextless signals. This is expected to better reflect the nature of key cellular regulators.
As GGEA exploits the consistency for the computation of its score, we additionally carried out a more independent benchmark to investigate how well statistically significant expression changes of single genes can be explained by other set members. As a measure of explainability, we used the number of additional genes, which were needed to connect significant members of a set to a regulatory network. We found this evaluation of particular interest, as it tries to approximate the process of the human interpretation. For all set enrichment methods, only a small amount of genes could be explained by other set members in a significant result and we observed frequently that several additional genes were needed. Implied is that set enrichment indeed indicates that there is something striking happening in a certain result set; however, conclusions whether observed expression changes are coherent and in context with the surrounding regulators cannot be drawn. This is resolved by GGEA. It systematically reports more easily explainable sets than all other methods, and the fraction of explainable sets with a single additional gene is increased by over 30% in comparison with the best set enrichment method.
Furthermore, we applied GGEA in two pilot case studies of human neuronal tumours using regulatory interactions of signalling pathways, though incorporated protein–protein regulations cannot be measured at the transcriptional level. Nonetheless, we again hypothesize that genes, annotated to be associated in a pathway, should show higher correlation patterns than arbitrary genes, which are not. On the other hand, we argue that signal cascades normally target altered gene regulation.
On the glioma dataset, GGEA discovered throughout specific and disease-related pathways. Induced by increasing specificity, the fraction of false positives decreases. Unspecific and inconsistent pathways are replaced by more appropriate pathways. An example is the detection of the neurotrophin signalling pathway that modulates neuronal apoptosis (a very specific finding), while general apoptosis is downgraded.
The Neurotrophin signalling pathway also has a major influence on the development of neuroblastoma, another neuronal tumour type. The experimentally verified connection was detected by GGEA with high significance, while GSEA failed to detect it. The discovery of such false negatives of the set enrichment analysis is due to improved sensitivity already observed in the consistency study. However, it is surprising that only GGEA is sensitive enough to detect the neurotrophin signalling pathway, the chemokine signalling pathway and the Fc epsilon RI signalling pathway—all of which have been shown to be of crucial importance in neuroblastoma formation—while standard GSEA does not detect them. Best ranked pathways of GSEA are as follows: cell cycle, ribosom and olfactory transduction. The connection to the disease is incomprehensible and explanations are almost arbitrary.
5 CONCLUSION
We showed in three independent and differently designed studies that GGEA consistently aligns regulation and expression and yields result sets where statistically significant expression changes can be explained by regulators within the set. Moreover, GGEA eases the biological interpretation of reported gene sets, as they are more coherent than sets reported by set enrichment methods. This means many more of their relevant genes are connected or can be connected by a minimum number of additional factors. In summary, our new method GGEA is an intuitive enrichment method, which uses gene regulatory information to improve consistency and coherence of detected enriched gene sets and, thus, substantially reduces the fraction of false positive and false negative classifications of relevant gene sets. GGEA significantly improves the detection of gene sets where measured positively or negatively correlated expression patterns coincide with directed inducing or repressing relationships between the respective pairs of genes. Hence, gene set regulators, such as transcription factors, can explain a significant portion of the observed expression changes. As GGEA is as fast and easy to apply to experimental data as state-of-the-art set enrichment analysis methods, it provides an alternative for interpreting gene expression measurements and for deriving first insights into the relevant processes. The advantages of GGEA will increase in the future with the availabilty of better GRNs and better models for regulatory relations in these GRNs.
Funding: DFG international research training group (1563/1 RECESS to L.G.).
Conflict of Interest: none declared.
REFERENCES
- Ashburner M., et al. Gene ontology: tool for the unification of biology. Nat. Genet. 2000;25:25–29. doi: 10.1038/75556. [DOI] [PMC free article] [PubMed] [Google Scholar]
- Barry W.T., et al. Significance analysis of functional categories in gene expression studies: a structured permutation approach. Bioinformatics. 2005;21:1943–1949. doi: 10.1093/bioinformatics/bti260. [DOI] [PubMed] [Google Scholar]
- Breitling R., et al. Iterative Group Analysis (iGA): a simple method to enhance sensitivity and facilitate interpretation of microarray experiments. BMC Bioinformatics. 2004;5:34. doi: 10.1186/1471-2105-5-34. [DOI] [PMC free article] [PubMed] [Google Scholar]
- Borrello M.G., et al. The oncogenic versions of the Ret and Trk tyrosine kinases bind Shc and Grb2 adaptor proteins. Oncogene. 1994;9:1661–1668. [PubMed] [Google Scholar]
- Chaouiya C. Petri net modelling of biological networks. Brief. Bioinform. 2007;8:210–219. doi: 10.1093/bib/bbm029. [DOI] [PubMed] [Google Scholar]
- Darios F., Davletov B. Omega-3 and omega-6 fatty acids stimulate cell membrane expansion by acting on syntaxin 3. Nature. 2006;440:813–817. doi: 10.1038/nature04598. [DOI] [PubMed] [Google Scholar]
- Dinu I., et al. Gene-set analysis and reduction. Brief. Bioinform. 2009;10:24–34. doi: 10.1093/bib/bbn042. [DOI] [PMC free article] [PubMed] [Google Scholar]
- Eisen M.B., et al. Cluster analysis and display of genome-wide expression patterns. Proc. Natl Acad. Sci. USA. 1998;95:14863–14868. doi: 10.1073/pnas.95.25.14863. [DOI] [PMC free article] [PubMed] [Google Scholar]
- Evangelopoulos M.E., et al. Neurotrophin effects on neuroblastoma cells: correlation with trk and p75NTR expression and influence of Trk receptor bodies. J. Neurooncol. 2004;66:101–110. doi: 10.1023/b:neon.0000013492.37426.0c. [DOI] [PubMed] [Google Scholar]
- Faith J.J., et al. Many microbe microarrays database: uniformly normalized affymetrix compendia with structured experimental metadata. Nucleic Acids Res. 2008;36:D866–D870. doi: 10.1093/nar/gkm815. [DOI] [PMC free article] [PubMed] [Google Scholar]
- Gama-Castro S., et al. RegulonDB (version 6.0): gene regulation model of Escherichia coli K-12 beyond transcription, active (experimental) annotated promoters and Textpresso navigation. Nucleic Acids Res. 2008;36:D120–D124. doi: 10.1093/nar/gkm994. [DOI] [PMC free article] [PubMed] [Google Scholar]
- Gatti D.M., et al. Heading down the wrong pathway: on the influence of correlation within gene sets. BMC Genomics. 2010;11:574. doi: 10.1186/1471-2164-11-574. [DOI] [PMC free article] [PubMed] [Google Scholar]
- Ge H., et al. Correlation between transcriptome and interactome mapping data from Saccharomyces cerevisiae. Nat. Genet. 2001;29:482–486. doi: 10.1038/ng776. [DOI] [PubMed] [Google Scholar]
- Gentleman R.C., et al. Bioconductor: open software development for computational biology and bioinformatics. Genome Biol. 2004;5:80. doi: 10.1186/gb-2004-5-10-r80. [DOI] [PMC free article] [PubMed] [Google Scholar]
- Goecks J., et al. Galaxy: a comprehensive approach for supporting accessible, reproducible, and transparent computational research in the life sciences. Genome Biol. 2010;11:86. doi: 10.1186/gb-2010-11-8-r86. [DOI] [PMC free article] [PubMed] [Google Scholar]
- Goeman J.J., Bühlmann P. Analyzing gene expression data in terms of gene sets: methodological issues. Bioinformatics. 2007;23:980–987. doi: 10.1093/bioinformatics/btm051. [DOI] [PubMed] [Google Scholar]
- Ihaka R., Gentleman R. R: a language for data analysis and graphics. J. Comp. Graph. Stat. 1996;5:299–314. [Google Scholar]
- Jansen R., et al. Relating whole-genome expression data with protein-protein interactions. Genome Res. 2002;12:37–46. doi: 10.1101/gr.205602. [DOI] [PMC free article] [PubMed] [Google Scholar]
- Keller A., et al. A novel algorithm for detecting differentially regulated paths based on gene set enrichment analysis. Bioinformatics. 2009;25:2787–2794. doi: 10.1093/bioinformatics/btp510. [DOI] [PMC free article] [PubMed] [Google Scholar]
- Khatri P., Draghici S. Ontological analysis of gene expression data: current tools, limitations, and open problems. Bioinformatics. 2005;21:3587–3595. doi: 10.1093/bioinformatics/bti565. [DOI] [PMC free article] [PubMed] [Google Scholar]
- Küffner R., et al. Pathway analysis in metabolic databases via differential metabolic display (DMD) Bioinformatics. 2000;16:825–836. doi: 10.1093/bioinformatics/16.9.825. [DOI] [PubMed] [Google Scholar]
- Küffner R., et al. Petri nets with fuzzy logic (PNFL): reverse engineering and parametrization. PLoS One. 2010;5:12807. doi: 10.1371/journal.pone.0012807. [DOI] [PMC free article] [PubMed] [Google Scholar]
- Lee H.K., et al. Coexpression analysis of human genes across many microarray data sets. Genome Res. 2004;14:1085–1094. doi: 10.1101/gr.1910904. [DOI] [PMC free article] [PubMed] [Google Scholar]
- Liu M., et al. Network-based analysis of affected biological processes in Type 2 diabetes models. PLoS Genetics. 2007;3:e96. doi: 10.1371/journal.pgen.0030096. [DOI] [PMC free article] [PubMed] [Google Scholar]
- Meier R., et al. The chemokine receptor CXCR4 strongly promotes neuroblastoma primary tumour and metastatic growth, but not invasion. PLoS One. 2007;2:e1016. doi: 10.1371/journal.pone.0001016. [DOI] [PMC free article] [PubMed] [Google Scholar]
- Miller F.D., Kaplan D.R. Neurotrophin signalling pathways regulating neuronal apoptosis. Cell. Mol. Life Sci. 2001;58:1045–1053. doi: 10.1007/PL00000919. [DOI] [PMC free article] [PubMed] [Google Scholar]
- Murata T. Petri Nets: properties, analysis and applications. Proc. IEEE. 1989;77:541–580. [Google Scholar]
- Ogata H., et al. KEGG: Kyoto Encyclopedia of Genes and Genomes. Nucleic Acids Res. 1999;27:29–34. doi: 10.1093/nar/27.1.29. [DOI] [PMC free article] [PubMed] [Google Scholar]
- Ohmichi M., et al. Nerve growth factor binds to the 140 kd trk proto-oncogene product and stimulates its association with the src homology domain of phospholipase C gamma 1. Biochem. Biophys. Res. Commun. 1991;179:217–223. doi: 10.1016/0006-291x(91)91357-i. [DOI] [PubMed] [Google Scholar]
- Pan W. A comparative review of statistical methods for discovering differentially expressed genes in replicated microarray experiments. Bioinformatics. 2002;18:546–554. doi: 10.1093/bioinformatics/18.4.546. [DOI] [PubMed] [Google Scholar]
- Schramm G., et al. PathWave: discovering patterns of differentially regulated enzymes in metabolic pathways. Bioinformatics. 2010;26:1225–1231. doi: 10.1093/bioinformatics/btq113. [DOI] [PubMed] [Google Scholar]
- Subramanian A., et al. Gene set enrichment analysis: a knowledge-based approach for interpreting genome-wide expression profiles. Proc. Natl Acad. Sci. USA. 2005;102:15545–15550. doi: 10.1073/pnas.0506580102. [DOI] [PMC free article] [PubMed] [Google Scholar]
- Ulitsky I., Shamir R. Identification of functional modules using network topology and high-throughput data. BMC Syst. Biol. 2007;1:8. doi: 10.1186/1752-0509-1-8. [DOI] [PMC free article] [PubMed] [Google Scholar]
- Walker S.R., et al. Neuroblastoma impairs chemokine-mediated dendritic cell migration in vitro. J. Pediatr. Surg. 2006;41:260–265. doi: 10.1016/j.jpedsurg.2005.10.073. [DOI] [PubMed] [Google Scholar]
- Windhager L., Zimmer R. German Conference on Bioinformatics. Vol. 136. Bonn: Gesellschaft für Informatik, Köllen Verlag; 2008. Intuitive Modeling of Dynamic Systems with Petri Nets and Fuzzy Logic; pp. 106–115. September 9–12, 2008, Dresden, Germany, of Lecture Notes in Informatics. [Google Scholar]
- Windhager L., et al. Fuzzy modeling. In: Koch I., et al., editors. Modeling in Systems Biology: The Petri Net Approach. Köllen Verlag, Bonn: Springer; 2010. Chapter 9. [Google Scholar]
- Zadeh L.A. Fuzzy sets. Inform. Control. 1963;8:338–353. [Google Scholar]