

Abstract
Although low body weight is a risk factor for osteoporosis‐related fractures, conflicting data exist for the association between adiposity and bone mineral density (BMD). Studies examining these relationships have measured body fat and BMD with dual‐energy X‐ray absorptiometry (DXA), which cannot distinguish subcutaneous adipose tissue area (SAT) from total adiposity or trabecular from cortical bone. To investigate the relationship between adiposity and BMD further, we analyzed body composition and adipose tissue distribution by quantitative computed tomography (QCT) in 1829 Afro‐Caribbean men aged 40 years and older from a population‐based sample. Cortical volumetric BMD, muscle cross‐sectional area, total adipose tissue area (TAT), and percentage SAT were measured at the proximal tibia. Trabecular volumetric BMD was measured at the distal tibia. We used analysis of covariance to test for associations between quartile of the adipose tissue measures and BMD, adjusting for anthropometric, health, and lifestyle factors. Higher TAT was associated with lower cortical BMD in both unadjusted and adjusted models (p < .001). Men with a higher percentage SAT had greater cortical BMD (p < .001). Similar associations were seen between percent SAT and trabecular BMD at the distal tibia. These results indicate that total adiposity is a potentially important correlate of bone mass in older men and that different fat depots may have opposing associations with bone mass. Additional research is needed to better understand the mechanisms underlying the relationship between body fat distribution and bone mass. © 2010 American Society for Bone and Mineral Research.
Keywords: osteoporosis, BMD, adiposity, men, QCT
Introduction
Body weight is a major determinant of bone mineral density (BMD) and osteoporosis‐related fractures such that low body mass index (BMI < 20) has been incorporated into the World Health Organization (WHO) fracture risk assessment tool.1, 2 Understanding the relationship between body fat mass and BMD is also of importance not only because fat mass is a major component of body weight but also because obesity and osteoporosis are highly prevalent clinical and public health problems.
Some investigations have shown a positive correlation between whole‐body fat mass and areal BMD (aBMD) measured by dual energy X‐ray absorptiometry (DXA).3, 4, 5, 6, 7 However, more recent studies that account for body weight or lean mass suggest that higher levels of total‐body fat may be associated with lower aBMD in both men and women.8, 9, 10, 11, 12 Several explanations for these conflicting findings have been proposed and include the confounding effects of body size, colinearity of anthropometric variables included in the analysis, ethnic and gender differences, and differences in measurement technique.13, 14
To further examine the relationship between body fat and BMD, we investigated the association between total and regional (subcutaneous, nonsubcutaneous) adipose tissue area at the tibia with cortical and trabecular volumetric BMD (vBMD) measured by quantitative computed tomography in a large population sample of older Afro‐Caribbean men.
Methods
Study population
Between 1997 and 2003, 3170 men were recruited for a population‐based prostate cancer screening study on the Island of Tobago, Trinidad and Tobago.15 Briefly, the Tobago Prostate Cancer Survey is an observational cohort study of prostate cancer prevalence and incidence in otherwise healthy men aged 40 years and older who had not been screened for prostate cancer previously. To be eligible, men had to be ambulatory, noninstitutionalized, and not terminally ill. Recruitment for the survey was accomplished by flyers, public‐service announcements, posters informing health care workers at local hospital and health centers, and word of mouth. Approximately 60% of all age‐eligible men on the island participated, and participation was representative of the island parishes. The recruited cohort was 97% African, 2% East Indian, less than 1% white, and less than 1% “other,” as defined by paternal and maternal grandparents' ethnicity.16
Between 2004 and 2007, men were invited to return for a repeat examination and to complete a peripheral quantitative computed tomographic (pQCT) scan. A total of 2031 men in the cohort (70% of survivors) returned. At the follow‐up visit, we also recruited 451 new participants using similar recruitment methods and criteria as the original cohort. The current analysis is limited to the 1829 men of Afro‐Caribbean ancestry (self‐report of African ancestry) with pQCT scans and available information from questionnaire interview at the time this analysis was completed.
Peripheral quantitative computed tomography
pQCT was performed at the left tibia (4% and 66% of the tibia length) using the Stratec XCT‐2000 scanner (Stratec Medizintechnik, Pforzheim, Germany). Technicians followed a strict protocol for patient positioning and scanning. A scout view was obtained prior to the pQCT scan to define an anatomic reference line for the relative location of the subsequent scans at the tibia. Tibia length was measured from the medial malleolus to the medial condyle of the tibia. A single axial slice of 2.5‐mm thickness with a voxel size of 0.5 mm and a speed of 20 mm/s was taken at all locations. Image processing was performed using the Stratec software package (Version 5.5E).
The scan at the 4% tibia site represents predominantly trabecular bone, whereas the scan at the 66% tibia site represents predominantly cortical bone. To determine the total and trabecular vBMD (mg/cm3) at the 4% site of the tibia, identical parameters for contour finding and separation of trabecular and cortical bone were used: contour mode 2, threshold = 169 mg/cm3; peel mode 1, area = 45%. To determine the total and cortical vBMD (mg/cm3) at the 66% site of the tibia, identical parameters were used: mode 2, threshold = 169 mg/cm3; cortical mode 1, threshold = 710 mg/cm3.
The 66% site is also where total adipose tissue area (TAT), muscle cross‐sectional area (muscle CSA), subcutaneous adipose tissue area (SAT), and nonsubcutaneous adipose tissue area (NSAT) measures were obtained (measured in mm2). The 66% site was selected because this is the region of the calf with the largest circumference, and it has less variability across individuals compared with other sites. NSAT was calculated as (TAT – SAT). Percent SAT was calculated as (SAT/TAT) × 100% and served as a measure of relative fat distribution in the subcutaneous depot. All images were analyzed by a single investigator.
Anthropometric and body composition measurements
Body weight (in kilograms) was measured by staff with participants wearing light clothing and without shoes using a calibrated balance beam scale. Height (in centimeters) was measured without participants wearing shoes using a wall‐mounted height board. Two height measurements were made, and the average was used in the analysis. BMI was calculated as weight in kilograms divided by height in meters squared.
Hormone assays
Fasting morning serum samples were stored at –80 °C until assay. Hormone assays were completed in a subset of 447 men using a validated and highly specific gas chromatrography–liquid chromatography–mass spectrometry (GC‐LC‐MS) technique to measure total and bioavailabile testosterone. Standard samples of several concentrations were included in all assay runs to ensure precision and accuracy. Details of the laboratory methods have been described.17, 18
Other measurements
Trained interviewers and nurses administered questionnaires to participants. We collected information pertaining to demographic characteristics, medical history, physical activity, and lifestyle variables. Ethnicity was self‐reported, and participants provided detailed information on the ethnic origin of their parents and grandparents. Respondents reporting Afro‐Caribbean ancestry were included in the current analysis. Afro‐Caribbean men who reported having less than four known African grandparents (versus four of known African origin) were categorized as mixed African ethnicity.
Participants were asked whether they had been diagnosed by a health care provider with diabetes and, if so, had they been treated using insulin or treated using any other noninsulin medication. Participants also were asked whether they had been diagnosed with prostate cancer. Additional information about androgen‐deprivation therapy (which includes both hormonal and surgical castration) was obtained. Smoking status was categorized as never, past, or current by asking men whether they had smoked at least 100 cigarettes in their lifetime. Men who smoked fewer than 100 cigarettes were considered to have never smoked. Physical activity was assessed by the frequency and duration of walking in the past 7 days.
Statistical analysis
Statistical analysis was completed using SAS Version 9.1 (Cary, NC, USA). ANOVA was used to evaluate the differences in total and regional adipose tissue area by 10‐year age group. Correlation between body‐composition measures was conducted using a Spearman's rank‐correlation procedure. The continuous distributions of TAT, percent SAT, and percent NSAT were divided into quartiles (containing approximately 450 men per quartile), and these quartiles were used to conduct association analyses with bone‐related measures. Specifically, ANOVA was used to test for an association between quartiles of adipose tissue and vBMD as a continuous measure. Adjustments for body size and health characteristics (ie, age, mixed ethnicity, height, muscle CSA, weight, smoking, diabetes, and walking frequency) were performed using ANCOVA. Adjusted means and standard errors are presented.
Results
The average age of the 1829 men in this analysis was 59 years (range 41 to 91 years). Diabetes was reported by 17.0% of the men. Approximately one‐third of the men reported a past or current history of smoking (32.4%), and the majority (62.4%) walked at least 5 days a week. Additional characteristics are presented in Table 1.
Table 1.
Characteristics of Afro‐Caribbean Men
| Characteristics | Mean (SD) or % |
|---|---|
| Age (years) | 59 (10.2) |
| Standing height (cm) | 175.0 (6.8) |
| Weight (Kg) | 84.0 (15.8) |
| BMI | 27.4 (4.8) |
| Muscle cross sectional area (mm2) | 7483 (1310) |
| Ever smoke | 32.4% |
| Prostate cancer | 7.5% |
| Androgen deprivation therapy | 5.1% |
| Diabetes | 17.0% |
| Insulin treatment | 1.3% |
| Non‐insulin diabetes medication | 13.9% |
| Walking frequency | |
| Never | 2.10% |
| Seldom (1‐2 days/week) | 11.80% |
| Sometimes (3‐4 days/week) | 23.60% |
| Often (5‐7 days/week) | 62.43% |
| Bone measures | |
| Proximal tibia cortical bone mineral density (mg/cm3) | 1123 (34) |
| Distal tibia trabecular bone mineral density (mg/cm3) | 227 (41) |
| Adipose tissue measures | |
| Total adipose tissue area (mm2) | 1817 (780) |
| Subcutaneous adipose tissue area (mm2) | 1362 (662) |
| Non‐subcutaneous adipose tissue area (mm2) | 450 (333) |
| Percentage subcutaneous adipose tissue area (%) | 74 (15.1) |
| Percentage non‐subcutaneous adipose tissue area (%) | 26 (15.1) |
The relationship between TAT, SAT, and NSAT by 10‐year age group is described in Fig. 1. TAT was not associated with age (p = .20). Lower SAT was associated (p < .0001) with older age across all age groups (p < .05 compared with the 40‐ to 49‐year age group). In contrast, higher NSAT was observed in the 60‐ to 69‐, 70‐ to 79‐, and 80‐year and older age groups (compared with the 40‐ to 49‐year age group; overall p < .0001).
Figure 1.
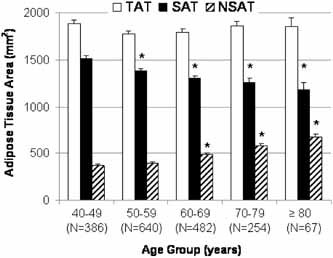
Mean adipose tissue area by 10‐year age group in Afro‐Caribbean men. Total adipose tissue area (TAT, mm2) is shown in white. Subcutaneous adipose tissue area (SAT, mm2) is shown in black. Nonsubcutaneous adipose tissue area (NSAT, mm2) is shown by dashed bars. Error bars represent 1 SE. *p < .05 for pairwise comparison with age group 40 to 49 years.
Anthropometric and body‐composition measurements including body weight, height, and muscle CSA were correlated with adiposity measures from pQCT (TAT, SAT, NSAT, %SAT, and %NSAT; Table 2). TAT was highly correlated with SAT (Spearman coefficient = 0.910) and associated to a lesser extent with NSAT (r = 0.524). Although adjusting for body weight to account for differences in skeletal loading has been proposed, the moderate correlation between body weight and pQCT fat measures raised concerns about colinearity within the model. Thus adjustments with and without body weight were performed and are presented.
Table 2.
Spearman Correlation Coefficients Between Anthropometric and Body‐Composition Measures
| Body weight (kg) | Height (cm) | Muscle CSA (mm2) | TAT (mm2) | |
|---|---|---|---|---|
| TAT (mm2) | 0.638* | 0.090* | 0.292* | — |
| SAT (mm2) | 0.599* | 0.064* | 0.279* | 0.910* |
| NSAT (mm2) | 0.328* | 0.127* | 0.193* | 0.524* |
| %SAT (mm2) | 0.197* | −0.065* | 0.052* | 0.248* |
Note: Spearman's rank correlation coefficients are presented.
p < .05.
In unadjusted analyses, higher TAT was associated with a 1.5% lower cortical BMD (p < .001), but no difference in trabecular BMD (p = .087) was observed. Adjustment for age, mixed ethnicity, height, muscle CSA, and body weight did not change this association (Fig. 2). A 2% lower cortical BMD (p < .0001) was observed in the highest quartile of TAT compared with the lowest quartile in the model adjusted for age, mixed ethnicity, height, muscle CSA, and body weight (Table 3). An 8% lower trabecular BMD was observed in the highest quartile of TAT compared with the lowest quartile (p < .0001; Table 3). Additional adjustment for smoking, diabetes, and walking did not change the relationship for either cortical or trabecular BMD (p < .0001 for both; results not shown). We also repeated analyses in the subset of nondiabetic men and found similar results as in the total sample of men (data not shown).
Figure 2.
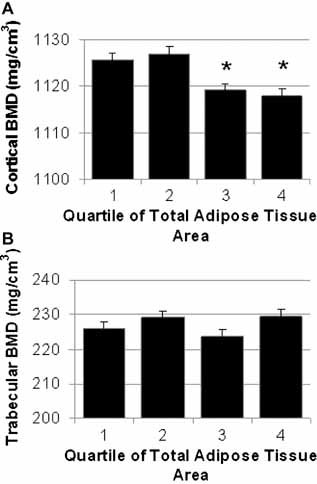
BMD at the tibia by quartile of TAT. Adjusted mean cortical (A) and trabecular (B) vBMD (+1 SE) at the tibia stratified by quartile of total adipose tissue area (mm2). All measures are adjusted for age, mixed race, height, and muscle CSA. Quartile of total adipose tissue was significantly associated with cortical BMD (p < .0001) but not trabecular BMD (p = .087). *p < .05 for pairwise comparison with quartile 1 of TAT: Quartile 1 < 1270 mm2; quartile 2 = 1270–1726 mm2; quartile 3 = 1726–2257 mm2; quartile 4 > 1257mm2.
Table 3.
BMD and Structural Parameters at the Proximal Tibia by Quartile of Total and Percent SAT
| P‐Value | Adjusted means (SE)* | ||||||
|---|---|---|---|---|---|---|---|
| Model 1 | Model 2 | Model 3 | Quartile 1 | Quartile 2 | Quartile 3 | Quartile 4 | |
| Total adipose tissue area | |||||||
| Cortical BMD (mg/cm3) | <.0001 | <.0001 | <.0001 | 1131 (1.6) | 1129(1.4) | 1118(1.4)** | 1111 (1.6)** |
| Trabecular BMD (mg/cm3) | 0.087 | 0.1047 | <.0001 | 236(2.1) | 232 (1.9) | 222 (1.9)** | 218(2.1)** |
| Percent subcutaneous adipose tissue area | |||||||
| Cortical BMD (mg/cm3) | <.0001 | <.0001 | <.0001 | 1119(1.5) | 1119(1.5) | 1122(1.4) | 1130(1.5)** |
| Trabecular BMD (mg/cm3) | <.0001 | <.0001 | <.0001 | 222 (1.9) | 224(1 .9) | 225 (1.9) | 238 (1.9)** |
Note: Model 1: unadjusted; model 2: adjusted for age, mixed ethnicity, height, and muscle CSA; model 3: adjusted for age, mixed ethnicity, height, muscle CSA, and body weight.
Adjusted means and standard errors are from model 3.
p < .05 for pairwise comparison with quartile 1 (model 3).
Interestingly, closer examination of the distribution of adipose tissue revealed that adipose tissue distribution was also associated with vBMD (Fig. 3). For example, a higher percentage of adipose tissue in the subcutaneous depot (%SAT) was associated with higher cortical and trabecular BMD (p < .001 for both). In other words, having a higher proportion of adipose tissue in the subcutaneous fat depot is associated with higher vBMD than if there is a larger proportion of adipose tissue in the nonsubcutaneous adipose tissue depots. These relationships persisted regardless of adjustment for covariates (ie, age, mixed ethnicity, height, muscle CSA, body weight, smoking, diabetes, and walking). Similar results were obtained among the subset of nondiabetic men (data not shown).
Figure 3.
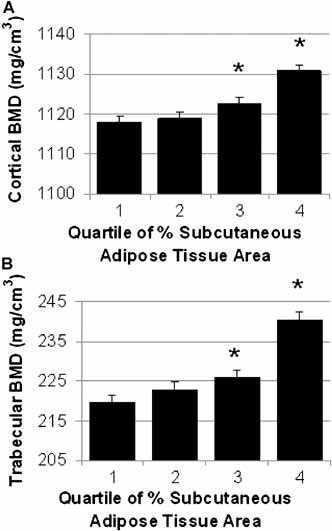
BMD at the tibia by quartile of percent SAT. Adjusted mean cortical (A) and trabecular (B) vBMD (+1 SE) at the tibia stratified by quartile of percent subcutaneous adipose tissue (%SAT). Measures are adjusted for age, mixed race, height, and muscle CSA. Quartile of %SAT was significantly associated with both cortical BMD and trabecular BMD (p < .0001 for all).
*p < .05 for pairwise comparison with quartile 1 of %SAT: Quartile 1 < 67.9%; quartile 2 = 67.9%–77.5%; quartile 3 = 77.5%–84.3%; quartile 4 > 84.3%.
Since there is a relatively high prevalence of prostate cancer in Tobago, and since an association between prostate cancer history or androgen deprivation was reported previously to be associated with cortical but not trabecular vBMD in this population,19 we repeated the analyses after excluding men with prostate cancer. Results were similar in analyses excluding men with prostate cancer (data not shown).
A subset of 447 men with pQCT had serum total or bioavailable testosterone levels available. In secondary data analyses among this subset of men, we added each hormone to model 2, which included age, mixed race, height, and muscle CSA as covariates. In this subset we found similar relationships between total adipose tissue area and percentage subcutaneous adipose tissue area with trabecular and cortical BMD at the tibia regardless of adjustment (Fig. 4).
Figure 4.
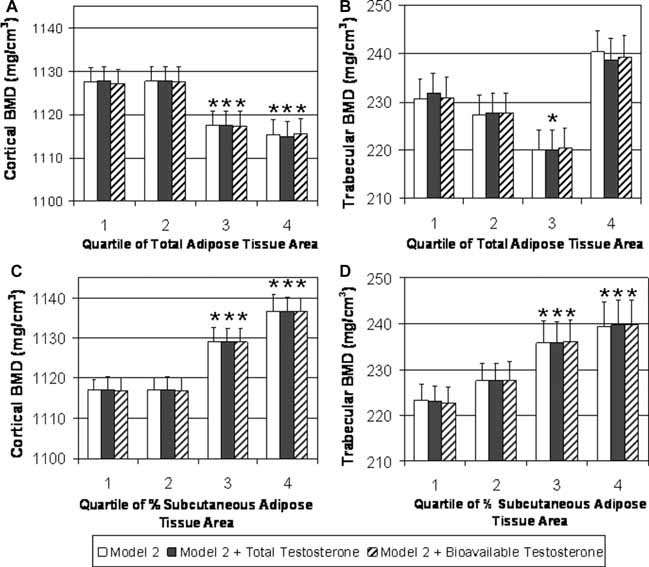
BMD at the tibia by quartile of adipose tissue in testosterone subset. A subset of 447 men had serum total and bioavailable testosterone measurements. Additional adjustment for hormones in a secondary analysis did not attenuate the relationship. (A) Cortical BMD by quartile of total adipose tissue (TAT, mm2) adjusting for age, mixed race, height, and muscle CSA (white bars); total testosterone, age, mixed race, height, and muscle CSA (black bars); and bioavailable testosterone, age, mixed race, height, and muscle CSA (dashed bars). (B) Trabecular BMD by quartile of TAT adjusting for age, mixed race, height, and muscle CSA (white bars); total testosterone, age, mixed race, height, and muscle CSA (black bars); and bioavailable testosterone, age, mixed race, height, and muscle CSA (dashed bars). (C) Cortical BMD by quartile of percent subcutaneous adipose tissue (%SAT) adjusting for age, mixed race, height, and muscle CSA (white bars); total testosterone, age, mixed race, height, and muscle CSA (black bars); and bioavailable testosterone, age, mixed race, height, and muscle CSA (dashed bars). (D) Trabecular BMD by quartile of %SAT adjusting for age, mixed race, height, and muscle CSA (white bars); total testosterone, age, mixed race, height, and muscle CSA (black bars); and bioavailable testosterone, age, mixed race, height, and muscle CSA (dashed bars). Quartile of total adipose tissue was significantly associated with cortical BMD and trabecular BMD (p ≤ .05 for both). Quartile of %SAT was significantly associated with both cortical BMD and trabecular BMD (p < .05 for both). *p < .05 for pairwise comparison with quartile 1 of total adipose tissue area and %SAT.
Discussion
Larger quantities of total adipose tissue area were associated with lower cortical and lower trabecular vBMD in the tibia in this study. Additionally, the distribution of adipose tissue was associated with cortical and trabecular BMD. We found that men with a higher proportion of their adipose tissue falling in the subcutaneous region had greater cortical BMD, whereas men with a higher percentage of nonsubcutaneous adipose tissue area had lower cortical BMD. Similar associations were observed with trabecular BMD. These results indicate that total adiposity is a potentially important correlate of vBMD among older men but that different adipose tissue depots may have opposing relationships with BMD.
This study used pQCT, which allows for a 3D measurement of vBMD that is not confounded by bone size. DXA tends to overestimate the density of larger bones, and differences in fat mass and fat distribution also may confound bone measures.20, 21 Therefore, measurement techniques such as pQCT may be more appropriate for assessing the relationship between body composition and BMD. Two other studies using CT measures of bone but DXA measures of body fat found either no association between fat mass and bone measures or an inverse relationship.11, 12 Additionally, DXA cannot resolve the cortical and trabecular bone compartments. In our analysis, a clear inverse association of TAT with cortical BMD was observed even after adjusting for important covariates.
The relationship between body fat distribution and bone is less well characterized. Studies of central adiposity measured by waist‐to‐hip ratio have observed associations between greater central adiposity and both higher and lower BMD.8, 22, 23, 24 One study investigating visceral and subcutaneous fat in the abdomen of HIV‐positive men identified an inverse association between visceral fat and lumbar spine BMD.25 A second study in children identified racial differences in the association between abdominal fat distribution and bone measures.26 Specifically, in white children, subcutaneous abdominal fat was inversely associated with lower bone mineral content (BMC), but in African‐American children, visceral fat was inversely correlated with BMC.26 A study of volumetric measurements of the femoral shaft in young women revealed a positive association between abdominal subcutaneous fat and both femoral size and strength parameters. In contrast, a negative relationship between visceral fat and femoral size and strength parameters was observed.27 Although additional information is needed about the potential influence of fat distribution on bone mass, there is evidence that not only the quantity but also the location of fat mass may influence bone mass.
There are a number of potential biologic reasons why fat mass may be related to bone mass. Fat and bone progenitor cells arise from the same mesenchymal stem cell lineage. In vivo studies of human osteoblasts support an opposing relationship between fat and bone. When cocultured with mature adipocytes, trabecular‐derived osteoblast proliferation was inhibited.28 Coculture experiments demonstrated that adipocytes and osteoblasts did not need to be in contact with each other, and additional investigation observed that polyunsaturated fatty acids, which mature adipocytes release, inhibit osteoblast proliferation.28, 29 Fat cells also release adipokines that may influence both bone and body fat, but the influence of these compounds on bone is complex. For example, leptin has been shown to increase osteoblast differentiation and mineralization activity, and recent findings indicate that lepin may accomplish this by reducing brain stem–derived serotoin synthesis.30, 31 Sex hormones also may explain the link between body fat and BMD. To address this possibility, we made additional adjustments for serum total or bioavailable testosterone concentrations. Although these hormone measurements were available in only a relatively small subset of men (n = 447), we observed significant associations between TAT and percent SAT with vBMD. Moreover, the additional adjustment for hormone levels did not attenuate this relationship. Thus it seems unlikely that serum testosterone levels explain the association between adipose tissue and vBMD.
It has been hypothesized that body fat may influence bone through increased skeletal loading, but adipocytes are also metabolically active.32, 33, 34 Our study observed higher BMD in men with a higher percentage of adipose tissue residing in the subcutaneous depot. Subcutaneous adipose tissue in the leg is thought to be less metabolically active, and it is possible that in this depot the potential benefits of mechanical loading are not outweighed by metabolic factors that result in lower BMD.35, 36
On the other hand, the association with nonsubcutatneous adipose tissue in our study may be marking a detrimental effect of intermuscular or bone marrow adiposity on bone. If adipose tissue is not in the subcutaneous depot at the proximal tibia, it is located within the muscle or bone marrow compartment, and either could have a negative impact on bone. For example, increased intermuscular fat is associated with reduced physical activity and losses in muscle strength, whereas marrow adiposity is associated with osteoporosis and lower trabecular bone formation.37, 38, 39 Lower mean attenuation coefficient of the thigh muscle, a marker of fatty infiltration in the muscle, has been associated recently with increased risk of incident hip fracture (even after accounting for BMD).40 Redistribution of fat to muscle, the marrow cavity, and other organs increases with age.41 Age also increases the presence of what Kirkland and colleagues refer to as “mesenchymal adipocyte‐like default cells,” which are dysdifferentiated mesenchymal precursor cells that behave like adipocytes and can even arise from osteoblasts.42 Having a higher percent SAT may be marking a group of individuals who are less likely to have dysdifferentiation of mesenchymal precursors or have less fat deposited in the muscle or marrow compartment.
This study was limited to middle‐aged and older Afro‐Caribbean males, and our results may not be generalizable to other populations. However, it does provide evidence for a negative association between fat mass and vBMD and demonstrates that fat distribution may affect vBMD. This analysis was limited to adiposity and bone measures of the tibia as opposed to other studies that have focused on the central skeleton. However, our study was unique in that it assessed both adiposity and skeletal parameters using pQCT and thus included a comprehensive assessment of fat depots with cortical and trabecular bone. Additional investigations using central CT or methodologies that allow us to specifically measure the marrow cavity may provide further insight into the association between body fat and bone.
Although an important influence of body weight on BMD is well known, the association between body fat and bone appears to be complex, and additional investigation is needed. Although the amount of body fat appears to be important, our study also indicates that the distribution of body fat also may be associated with BMD.
Disclosures
All the authors state that they have no conflicts of interest.
Acknowledgements
This study was supported by Grant R01‐AR049747 from the National Institute of Arthritis and Musculoskeletal and Skin Diseases. LMY‐A was supported by NIA Grant T32‐AG00181.
References
- 1. Kanis JA, Borgstrom F, De Laet C, et al. Assessment of fracture risk. Osteoporos Int. 2005; 16: 581–589. [DOI] [PubMed] [Google Scholar]
- 2. Wildner M, Peters A, Raghuvanshi VS, Hohnloser J, Siebert U. Superiority of age and weight as variables in predicting osteoporosis in postmenopausal white women. Osteoporos Int. 2003; 14: 950–956. [DOI] [PubMed] [Google Scholar]
- 3. Pluijm SM, Visser M, Smit JH, Popp‐Snijders C, Roos JC, Lips P. Determinants of bone mineral density in older men and women: body composition as mediator. J Bone Miner Res. 2001; 16: 2142–2151. [DOI] [PubMed] [Google Scholar]
- 4. Reid IR, Ames R, Evans MC, et al. Determinants of total body and regional bone mineral density in normal postmenopausal women: a key role for fat mass. J Clin Endocrinol Metab. 1992; 75: 45–51. [DOI] [PubMed] [Google Scholar]
- 5. Reid IR, Plank LD, Evans MC. Fat mass is an important determinant of whole body bone density in premenopausal women but not in men. J Clin Endocrinol Metab. 1992; 75: 779–782. [DOI] [PubMed] [Google Scholar]
- 6. Taaffe DR, Cauley JA, Danielson M, et al. Race and sex effects on the association between muscle strength, soft tissue, and bone mineral density in healthy elders: the Health, Aging, and Body Composition Study. J Bone Miner Res. 2001; 16: 1343–1352. [DOI] [PubMed] [Google Scholar]
- 7. Khosla S, Atkinson EJ, Riggs BL, Melton LJ 3rd. Relationship between body composition and bone mass in women. J Bone Miner Res. 1996; 11: 857–863. [DOI] [PubMed] [Google Scholar]
- 8. Nunez NP, Carpenter CL, Perkins SN, et al. Extreme obesity reduces bone mineral density: complementary evidence from mice and women. Obesity (Silver Spring). 2007; 15: 1980–1987. [DOI] [PubMed] [Google Scholar]
- 9. Hsu YH, Venners SA, Terwedow HA, et al. Relation of body composition, fat mass, and serum lipids to osteoporotic fractures and bone mineral density in Chinese men and women. Am J Clin Nutr. 2006; 83: 146–154. [DOI] [PubMed] [Google Scholar]
- 10. Zhao LJ, Liu YJ, Liu PY, Hamilton J, Recker RR, Deng HW. Relationship of obesity with osteoporosis. J Clin Endocrinol Metab. 2007; 92: 1640–1646. [DOI] [PMC free article] [PubMed] [Google Scholar]
- 11. Pollock NK, Laing EM, Baile CA, Hamrick MW, Hall DB, Lewis RD. Is adiposity advantageous for bone strength? A peripheral quantitative computed tomography study in late adolescent females. Am J Clin Nutr. 2007; 86: 1530–1538. [DOI] [PubMed] [Google Scholar]
- 12. Janicka A, Wren TA, Sanchez MM, et al. Fat mass is not beneficial to bone in adolescents and young adults. J Clin Endocrinol Metab. 2007; 92: 143–147. [DOI] [PubMed] [Google Scholar]
- 13. Reid IR. Relationships between fat and bone. Osteoporos Int. 2008; 19: 595–606. [DOI] [PubMed] [Google Scholar]
- 14. Zhao LJ, Jiang H, Papasian CJ, et al. Correlation of obesity and osteoporosis: effect of fat mass on the determination of osteoporosis. J Bone Miner Res. 2008; 23: 17–29. [DOI] [PMC free article] [PubMed] [Google Scholar]
- 15. Bunker CH, Patrick AL, Konety BR, et al. High prevalence of screening‐detected prostate cancer among Afro‐Caribbeans: the Tobago Prostate Cancer Survey. Cancer Epidemiol Biomarkers Prev. 2002; 11: 726–729. [PubMed] [Google Scholar]
- 16. Miljkovic‐Gacic I, Ferrell RE, Patrick AL, Kammerer CM, Bunker CH. Estimates of African, European and Native American ancestry in Afro‐Caribbean men on the island of Tobago. Hum Hered. 2005; 60: 129–133. [DOI] [PubMed] [Google Scholar]
- 17. Labrie F, Belanger A, Belanger P, et al. Androgen glucuronides, instead of testosterone, as the new markers of androgenic activity in women. J Steroid Biochem Mol Biol. 2006; 99: 182–188. [DOI] [PubMed] [Google Scholar]
- 18. Labrie F, Cusan L, Gomez JL, et al. Comparable amounts of sex steroids are made outside the gonads in men and women: strong lesson for hormone therapy of prostate and breast cancer. J Steroid Biochem Mol Biol. 2009; 113: 52–56. [DOI] [PubMed] [Google Scholar]
- 19. Sheu Y, Cauley JA, Bunker CH, et al. Correlates of trabecular and cortical volumetric BMD in men of African ancestry. J Bone Miner Res. 2009; 24: 1960–1968. [DOI] [PMC free article] [PubMed] [Google Scholar]
- 20. Carter DR, Bouxsein ML, Marcus R. New approaches for interpreting projected bone densitometry data. J Bone Miner Res. 1992; 7: 137–145. [DOI] [PubMed] [Google Scholar]
- 21. Hangartner TN, Johnston CC. Influence of fat on bone measurements with dual‐energy absorptiometry. Bone Miner. 1990; 9: 71–81. [DOI] [PubMed] [Google Scholar]
- 22. Heiss CJ, Sanborn CF, Nichols DL, Bonnick SL, Alford BB. Associations of body fat distribution, circulating sex hormones, and bone density in postmenopausal women. J Clin Endocrinol Metab. 1995; 80: 1591–1596. [DOI] [PubMed] [Google Scholar]
- 23. Tarquini B, Navari N, Perfetto F, Piluso A, Romano S, Tarquini R. Evidence for bone mass and body fat distribution relationship in postmenopausal obese women. Arch Gerontol Geriatr. 1997; 24: 15–21. [DOI] [PubMed] [Google Scholar]
- 24. Jankowska EA, Rogucka E, Medras M. Are general obesity and visceral adiposity in men linked to reduced bone mineral content resulting from normal ageing? A population‐based study. Andrologia. 2001; 33: 384–389. [DOI] [PubMed] [Google Scholar]
- 25. Huang JS, Rietschel P, Hadigan CM, Rosenthal DI, Grinspoon S. Increased abdominal visceral fat is associated with reduced bone density in HIV‐infected men with lipodystrophy. Aids. 2001; 15: 975–982. [DOI] [PubMed] [Google Scholar]
- 26. Afghani A, Goran MI. Racial differences in the association of subcutaneous and visceral fat on bone mineral content in prepubertal children. Calcif Tissue Int. 2006; 79: 383–388. [DOI] [PubMed] [Google Scholar]
- 27. Gilsanz V, Chalfant J, Mo AO, Lee DC, Dorey FJ, Mittelman SD. Reciprocal Relations of Subcutaneous and Visceral Fat to Bone Structure and Strength. J Clin Endocrinol Metab. 2009. [DOI] [PMC free article] [PubMed] [Google Scholar]
- 28. Maurin AC, Chavassieux PM, Frappart L, Delmas PD, Serre CM, Meunier PJ. Influence of mature adipocytes on osteoblast proliferation in human primary cocultures. Bone. 2000; 26: 485–489. [DOI] [PubMed] [Google Scholar]
- 29. Maurin AC, Chavassieux PM, Vericel E, Meunier PJ. Role of polyunsaturated fatty acids in the inhibitory effect of human adipocytes on osteoblastic proliferation. Bone. 2002; 31: 260–266. [DOI] [PubMed] [Google Scholar]
- 30. Thomas T, Burguera B. Is leptin the link between fat and bone mass? J Bone Miner Res. 2002; 17: 1563–1569. [DOI] [PubMed] [Google Scholar]
- 31. Yadav VK, Oury F, Suda N, et al. A serotonin‐dependent mechanism explains the leptin regulation of bone mass, appetite, and energy expenditure. Cell. 2009; 138: 976–989. [DOI] [PMC free article] [PubMed] [Google Scholar]
- 32. Forwood MR, Turner CH. Skeletal adaptations to mechanical usage: results from tibial loading studies in rats. Bone. 1995; 17: 197S–205S. [DOI] [PubMed] [Google Scholar]
- 33. Schultheis L. The mechanical control system of bone in weightless spaceflight and in aging. Exp Gerontol. 1991; 26: 203–214. [DOI] [PubMed] [Google Scholar]
- 34. Siiteri PK. Adipose tissue as a source of hormones. Am J Clin Nutr. 1987; 45: 277–282. [DOI] [PubMed] [Google Scholar]
- 35. Albu JB, Kenya S, He Q, et al. Independent associations of insulin resistance with high whole‐body intermuscular and low leg subcutaneous adipose tissue distribution in obese HIV‐infected women. Am J Clin Nutr. 2007; 86: 100–106. [DOI] [PMC free article] [PubMed] [Google Scholar]
- 36. Yim JE, Heshka S, Albu JB, Heymsfield S, Gallagher D. Femoral‐gluteal subcutaneous and intermuscular adipose tissues have independent and opposing relationships with CVD risk. J Appl Physiol. 2008; 104: 700–707. [DOI] [PMC free article] [PubMed] [Google Scholar]
- 37. Gimble JM, Robinson CE, Wu X, Kelly KA. The function of adipocytes in the bone marrow stroma: an update. Bone. 1996; 19: 421–428. [DOI] [PubMed] [Google Scholar]
- 38. Verma S, Rajaratnam JH, Denton J, Hoyland JA, Byers RJ. Adipocytic proportion of bone marrow is inversely related to bone formation in osteoporosis. J Clin Pathol. 2002; 55: 693–698. [DOI] [PMC free article] [PubMed] [Google Scholar]
- 39. Manini TM, Clark BC, Nalls MA, Goodpaster BH, Ploutz‐Snyder LL, Harris TB. Reduced physical activity increases intermuscular adipose tissue in healthy young adults. Am J Clin Nutr. 2007; 85: 377–384. [DOI] [PubMed] [Google Scholar]
- 40. Lang TF, Cauley J, Tylavsky F, Bauer D, Cummings S, Harris T. Computed Tomography Measurements of Thigh Muscle Cross‐Sectional Area and Attenuation Coefficient Predict Hip Fracture: The Health, Aging and Body Composition Study. J Bone Miner Res. 2009. [DOI] [PMC free article] [PubMed] [Google Scholar]
- 41. Kuk JL, Saunders TJ, Davidson LE, Ross R. Age‐related changes in total and regional fat distribution. Ageing Res Rev. 2009. [DOI] [PubMed] [Google Scholar]
- 42. Kirkland JL, Tchkonia T, Pirtskhalava T, Han J, Karagiannides I. Adipogenesis and aging: does aging make fat go MAD? Exp Gerontol. 2002; 37: 757–767. [DOI] [PubMed] [Google Scholar]