Abstract
Eukaryotic cells utilize complex signaling systems to detect their environments, responding and adapting as new conditions arise during evolution. The basidiomycete fungus Cryptococcus neoformans is a leading cause of AIDS-related death worldwide and utilizes the calcineurin and protein kinase C-1 (Pkc1) signaling pathways for host adaptation and expression of virulence. In the present studies, a C-terminal zinc finger transcription factor, homologous both to the calcineurin-responsive zinc fingers (Crz1) of ascomycetes and to the Pkc1-dependent specificity protein-1 (Sp1) transcription factors of metazoans, was identified and named SP1 because of its greater similarity to the metazoan factors. Structurally, the Cryptococcus neoformans Sp1 (Cn Sp1) protein was found to have acquired an additional zinc finger motif from that of Crz1 and showed Pkc1-dependent phosphorylation, nuclear localization, and whole genome epistatic associations under starvation conditions. Transcriptional targets of Cn Sp1 shared functional similarities with Crz1 factors, such as cell wall synthesis, but gained the regulation of processes involved in carbohydrate metabolism, including trehalose metabolism, and lost others, such as the induction of autophagy. In addition, overexpression of Cn Sp1 in a pkc1Δ mutant showed restoration of altered phenotypes involved in virulence, including cell wall stability, nitrosative stress, and extracellular capsule production. Cn Sp1 was also found to be important for virulence of the fungus using a mouse model. In summary, these data suggest an evolutionary shift in C-terminal zinc finger proteins during fungal evolution, transforming them from calcineurin-dependent to PKC1-dependent transcription factors, helping to shape the role of fungal pathogenesis of C. neoformans.
Keywords: Calcineurin, Pathogen-associated Molecular Pattern (PAMP), Protein Kinase C (PKC), Signal Transduction, Sp1, Transcription Factors, Transcription Regulation, Yeast Transcription
Introduction
The basidiomycete yeast Cryptococcus neoformans has emerged as one of the major causative agents of meningoencephalitis in immunocompromised hosts, such as persons with AIDS, organ transplant recipients, and patients receiving high doses of corticosteroid treatment. Systemic infections can also occur in immunocompetent individuals (1, 2). As rates of infection have diminished in developed countries, attention is increasingly being focused on the high rates of cryptococcosis in the developing countries of Africa and Asia, where cryptococcosis has been found to account for an estimated 17% of AIDS-related deaths (3). Recent studies have shown cryptococcosis to account for over 600,000 deaths annually, resulting in a disease burden worldwide approaching that of tuberculosis (4).
The three best known virulence-associated traits of C. neoformans include its ability to grow at 37 °C (5), the presence of a copper-containing laccase that is capable of producing melanin pigments (6), and a high Mr polysaccharide capsule (7–9). Although temperature and capsule are likely to have multiple structural genes involved in expression, melanin production has been shown to be dependent on two laccase enzymes encoded by LAC1 and LAC2, the former of which is the predominant enzyme under pathogenic conditions (6), making LAC1 an excellent maker for studying virulence regulation in C. neoformans.
Yeast cells, including C. neoformans, are continuously exposed to a wide variety of environmental stresses in both their natural habitats and their resident hosts. These stresses include changes in temperature, osmolarity, pH, nutrients, and exposure to reactive oxygen and nitrogen molecules. They subsequently sense and react to these changes through a complex network of signal transduction pathways, thus adapting to their surroundings and ensuring repair of cellular damage. A major cellular pathway mediating these responses is the protein kinase C (PKC1) pathway. Within this pathway, activation of Pkc1 leads to sequential phosphorylation of a mitogen-activating protein kinase (MAPK) cascade, consisting of Bck1p, two redundant MAPK kinases (Mkk1p and Mkk2p), and the MAPK, Slt2/Mpklp (10). In Saccharomyces cerevisiae, Rlm1p (11–14) and Swi4/Swi6 (15) are the main transcription factors (TFs)2 responsible for Slt2/Mpklp cell wall regulation. At least 25 genes that are involved in the biosynthesis of the cell wall and are regulated by Slt2/Mpklp and Rlm1p have been described (11).
In C. neoformans, mutation of PKC1 results in mutants that have profound cell wall integrity defects, including an inability to grow without the addition of an osmotic stabilizer, such as sorbitol, and profound growth defects in the presence of various stressors. In addition, major virulence factors are altered in pkc1Δ strains, including an inability to grow in 37 °C, aberrant capsule, and decreased melaninogenesis (16). The phenotypic features of mutants of the major genes regulated by the Pkc1 pathway have also been characterized in C. neoformans, including Bck1, Mkk2, and Mpk1 (16–17). However, although Pkc1 has been implicated in resistance to nitrosative stress and laccase expression, the transcription factor(s) responsible for the signal from Pkc1 has not been identified.
In the present studies, we sought to characterize a C-terminal zinc finger C2H2 type transcription factor protein, annotated CNAG_00156 (Broad Institute Web site; NCBI annotation XP_566613.1), that was first thought to represent a calcineurin-dependent zinc finger protein (Crz1), based on close homology to the S. cerevisiae and Candida albicans Crz1 homolog sequence. These studies were motivated by a previously described role for the Ca2+-activated calcineurin pathway in cryptococcal virulence (5) and a role for calcium activation of laccase (18) as well as enzyme inhibition by the calcineurin inhibitor, FK506.3 However, to our surprise, we could not find evidence that CNAG_00156 was part of the calcineurin pathway. Further studies to identify the relevant signal transduction pathway utilized a novel transcriptional clustering screen that identified Pkc1 as a likely signaling pathway for CNAG_00156. Biochemical and epistatic studies provided additional evidence linking the Pkc1 signal transduction pathway and the cryptococcal zinc finger transcription factor.
EXPERIMENTAL PROCEDURES
Strains, Plasmids, and Media
Strains used in this study are detailed in supplemental Table S1. All strains were grown on YPD medium (1% yeast extract, 2% Bacto-peptone, and 2% dextrose). Solid media contained 2% Bacto-agar. All PKC1 deletion strains were grown on YPD supplemented with 1 m sorbitol. Glucose starvation experiments were done as described previously (19). Selective media included either YPD containing 100 units/ml hygromycin B (InvivoGen) or asparagine minimal medium as described previously (20). A modified Bluescript SK vector (Stratagene) with the 2.4-kb hygromycin B resistance gene under the control of a cryptococcal Actprmtr (21) was a gift of G. Cox (Duke University, Durham, NC). In addition to the cryptococcal shuttle vector pORA-KUT (19), a hygromycin B-containing vector was generated by replacing the URA5 transformation marker with the hygromycin B resistance gene at the KpnI site, generating pORA-KUT (HygB).
Sequence Data Mining and Analysis
Sequence data were retrieved from the NCBI, Broad Institute Web site, and the Saccharomyces Genome Database, for Homo sapiens, C. neoformans, and S. cerevisiae, respectively. For the analysis of metazoan and fungal zinc finger motifs, sequences were retrieved using BLASTp searches with human Sp1 and C. neoformans CNAG_00156 as the query sequences. Occasionally there were BLASTp hits to multiple zinc finger motifs in target sequences. For these cases, the highest scoring hit was used as the putative homolog. The full protein sequences were aligned using MUSCLE (22), and the zinc finger motifs were manually extracted and aligned. A phylogenetic analysis of the zinc finger motifs (supplemental Fig. S3b) was performed using the heuristic parsimony algorithm of PAUP 4b10 (23). To evaluate support for the groups in the tree, 500 nonparametric bootstrap replicates were analyzed. PAUP returned 500 equally parsimonious trees for which the 50% majority rule consensus is shown. In Fig. 2B, clades consisting of major taxonomic groups from supplemental Fig. S3b were collapsed when possible. All of the variation among the equally parsimonious trees occurred within these collapsed groups, so the branches shown in the figure were found in all 500 trees.
FIGURE 2.
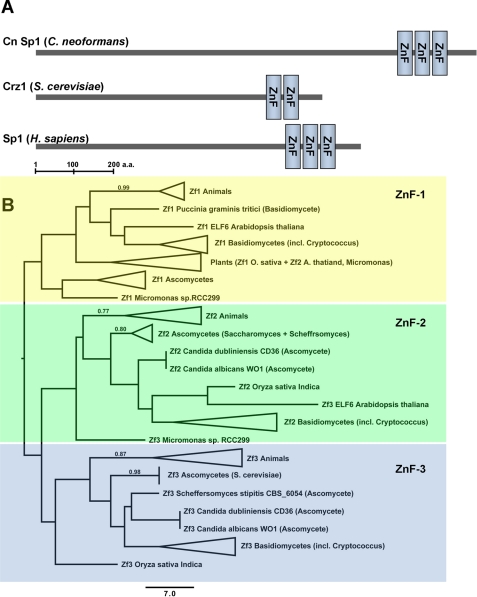
C. neoformans and the H. sapiens Sp1 share similar functional domains. A, the SMART-identified zinc finger domain pattern, showing Cn Sp1, Crz1, and H. sapiens Sp1 zinc finger domains (ZnF). B, phylogenetic analysis of metazoan and fungal zinc finger motifs (ZnF-1 to -3) of C. neoformans. Parsimonious trees were constructed using the heuristic parsimony algorithm of PAUP 4b10, as described under “Experimental Procedures.” Clades consisting of major taxonomic groups were collapsed when possible. Bootstrap support percentages greater than 70% are shown above the branches.
Generation of Cn sp1Δ and Cn sp1Δ::Cn SP1 Strains
Standard methods were used for disruption and complementation of the Cn SP1 (CNAG_00156) gene, as described previously (20). Briefly, to make the deletion construct, two PCR-amplified fragments of the Cn SP1 homolog (using primers Crz1 S1 XbaI (5′-GCTCTAGAATGGCAGATCCAGCCTCAC) plus Crz1 500 A EcoRI (5′-GGAATTCTGTTCGGACATCCTGCCTTC) and Crz1 3171 S BglII (5′-GAAGATCTCACAAGGCATTTTAATCTCAAGG) plus and Crz1 3693 A XhoI (5′-CCGCTCGAGAATCCTCTTCACTCGTTTCACTC)), the first amplified fragment digested with XbaI and EcoRI and the second digested with BglII and XhoI, were mixed with a 1.4-kb PCR fragment of the URA5 gene described previously (20), digested with BglII and EcoRI, and ligated to BlueScript SK digested with XbaI and XhoI. The final disruption allele with a 1.3-kb URA5 marker flanked on either side by a 500-bp DNA sequence homologous to genomic regions of the Cn SP1 gene was PCR-amplified and introduced into H99 ura5 cells via a biolistic approach (21) to effect a 3.7-kb deletion within the Cn SP1 coding region. Transformants were screened for a potential Cn SP1 deletion mutant by a PCR approach, and the specific disruption of the Cn SP1 gene in candidate mutants was verified by Southern blot analysis and PCR of cDNA, to verify the lack of Cn SP1 transcription (supplemental Fig. S7). To complement the Cn sp1Δ mutant strain, a 5.7-kb genomic fragment encompassing the full ORF of Cn SP1 plus ∼1500 bp of the 5′ promoter region and 500 bp of the 3′-UTR was PCR-amplified using a primer set of Crz1 US-1500 BamHI (5′-GCGGATCCATACACGACAAACACATCGCTACA) and Crz1-500 3′UTR-A-BamHI (5′-CGCGGATCCACGAT GAAAATGAAGGCTTCGACAATA) and then cloned into the modified pBluescript SK vector containing the hygromycin B resistance gene to generate the complementation construct, which was introduced into Cn sp1Δ mutant cells by a biolistic approach. Transformants were selected on hygromycin-containing YPD agar plates. Genomic insertion of the WT Cn SP1 construct in the complement was verified by uncut Southern blot.
Generation of Constituent Expression and GFP-tagged Strains of PKC1 and Cn SP1
Because the Cn SP1 and PKC1 genes contain an EcoRI site, cloning into the pORA-KUT vector required additional restriction sites. An oligonucleotide polylinker containing the restriction sites BglII-BamHI-XbaI-NarI-NheI-end codon-EcoRI was inserted between the BglII and EcoRI sites of pORA-KUT. The ∼730-bp C. neoformans Actprmtr (with or without a c-myc tag) was amplified from H99 DNA using the primer Actprmtr 1S BglII (5′-GGAAGATCTTGTCGGAGGAGAGGATGATGGTAAC), Actprmtr 730A BamHI (5′-CGCGGATCCGTTGGGCGAGTTTACTAATGGAAAAAGA), or Actprmtr0A-Myc-BamHI (5′-CGCGGATCCGAGGTCCTCCTCGGAGATGAGCTTCTGCTCCATGTTGGGCGAGTTTACTAATGGAAAAAG), cut with BglII and BamHI, and inserted into the BamHI site, obliterating its 5′-end, generating pORA-KUT-pACT. PKC1 and Cn SP1 constituent expression vectors were generated by inserting the coding region after the Actprmtr (including the c-myc tag in the Cn SP1 insert). The PKC1 coding region was amplified using primers PKC 1S BamHI (5′-CGGGATCCATGGTGCGTGGATATCTGCCA) and PKC 3784A NheI (5′-CTAGCTAGCCTAGGCTTGTGCTGCAGCCCA). The Cn SP1 coding region was amplified using primers Crz1–1S-BamHI (5′-CGGGATCCATGGCAGATCCAGCCTCAC) and Crz1 A3695 NheI (5′-CTAGCTAGCTTAATCCTCTTCACTCGTTTCACTC). Inserts were cut with BamHI and NheI and ligated into the corresponding restriction sites in pORA-KUT-pACT, generating pORA-KUT-pACT-Cn SP1 and pORA-KUT-pACT-PKC1. A C. neoformans codon-adjusted GFP fragment was amplified from a previously constructed plasmid (24) by using primers GFP 1S BglII (5′-GGAAGATCTATGTCCAAGGGTGAGGAGCTC) and GFP 741A BamHI (5′-CGGGATCCCTCGGCGGCGGCGG). The insert was cut with BamHI and BglII and inserted in the BamHI of pORA-KUT-pACT-Cn SP1, positioning the GFP on the 5′ end of the coding region, generating pORA-KUT-pACT-GFP-Cn SP1. The vectors were linearized with I-SceI and transformed by electroporation as described previously (24) as follows: pORA-KUT-pACT-PKC1 into Cn sp1Δ (Cn sp1Δ::pACT-PKC1); pORA-KUT-pACT-Cn SP1 (including the c-myc tag) into Cn sp1Δ, cna1Δ, and pkc1Δ (Cn sp1Δ::pACT-Cn SP1, cna1Δ::pACT-Cn SP1, and pkc1Δ::pACT-Cn SP1, respectively); and pORA-KUT-pACT-GFP-Cn SP1 into Cn sp1Δ (Cn sp1Δ::GFP-Cn SP1). Transformants were selected on hygromycin B and verified by sequencing. Constituent expression was tested by quantitative RT-PCR and by Western blot. Functionality of the c-myc-tagged Cn SP1 was verified by reversal of the Cn sp1Δ mutant cell wall defects (Fig. 4).
FIGURE 4.
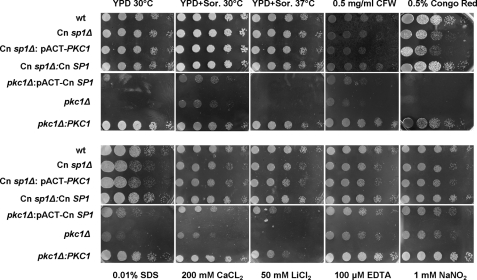
Cn sp1Δ and pkc1Δ share cell wall integrity defects. WT (H99), Cn sp1Δ, pkc1Δ, Cn sp1Δ::Cn SP1, pkc1Δ::PKC1, pkc1Δ::pACT-Cn SP1, and Cn sp1Δ::pACT-PKC1 strains were grown on YPD plus sorbitol media and suspended in PBS medium to an A600 of 0.1. Five 5-fold dilutions of each strain were spotted on YPD plus 1 m sorbitol agar plates with the various additives as described and incubated at 30 °C (except for the 37 °C experiment) for 48 h. CFW, calcofluor white.
Cell Wall Integrity Assays
Strains were grown on YPD plus 1 m sorbitol plates for 2 days at 30 °C. Then they were suspended in PBS to an A600 of 0.1 and underwent 5-fold serial dilutions in PBS. 10 μl of each dilution was applied to YPD; YPD + 1 m sorbitol at 30 and 37 °C; YPD + 1 m sorbitol with the following: 0.5 mg/ml calcofluor white (Fluorescent Brightener 28, Sigma), 0.5% Congo red (Sigma), 0.01% SDS, 200 mm CaCl2, 50 mm LiCl2, 100 μm EDTA, and 1 mm NaNO2. Plates were incubated for 2 days at 30 °C.
Caspofungin Susceptibility Testing
Due to the extreme fastidiousness of the pkc1Δ strain, we were not able to test minimum inhibitory sensitivities (MICs) with standard broth microdilution techniques; hence, we designed a specialized agar dilution assay. Cells were grown as described above and were suspended in PBS to an A600 of 0.132. Cell suspensions were diluted 1:222, and 20 μl of each strain were spotted on YPD + 1 m sorbitol agar plates with caspofungin concentrations from 0.25 to 16 mg/liter, including a no-drug control plate. Plates were observed for 48 h, and the MIC was determined at the point of visible growth.
Virulence Factor Expression and Virulence Studies
For measuring capsule formation under non-inducing conditions, cells were grown overnight on YPD + sorbitol media, stained with India ink, and observed under microscopy. Laccase activity was assessed as described previously (25). Virulence studies were conducted according to a protocol using a previously described mouse meningoencephalitis model, with five mice in each group (19). Animal studies were approved by the University of Illinois at Chicago Animal Care Committee.
Microarray Experiments
Cn Sp1 comparative screening by a C. neoformans glass microarray (Fig. 1) was as follows. For the comparative transcriptional profile experiment, H99, Cn sp1Δ, pkc1Δ, cna1Δ, pka1Δ, ssa1Δ, vad1Δ, ste12Δ, and bck1Δ strains were grown overnight in YPD (with 1 m sorbitol in pkc1Δ) in 30 °C shaker incubator to a mid-log phase and then induced by glucose starvation for 1 h. RNA was extracted and purified; cDNA was prepared, labeled, and hybridized to H99 glass microarray slides; and the slides were scanned and analyzed as described previously (26, 27). Feature signal was corrected for local background. Significance of signal was calculated as the two-tailed p value of a z-test for all replicate features, using the S.D. value of all measured features on the array. p values were corrected for false discovery rate using the Benjamini-Hochberg method (28). Clustering of signal intensities was then performed in “Expression profiler” (see the EPCLUST Web site) with correlation measure-based distance and average linkage.
FIGURE 1.
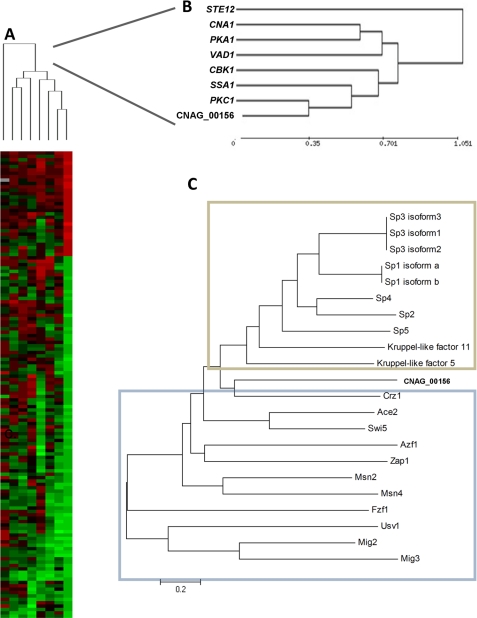
Transcriptional and protein sequence comparison of a C-terminal zinc finger (CNAG_00156). A, heat map display of a comparative microarray experiment of C. neoformans strains Cn sp1Δ (cnag_00156Δ), pkc1Δ, pka1Δ, cna1Δ, cbk1Δ, ssa1Δ, ste12Δ, and vad1Δ. Strains were grown overnight to mid-log phase and induced in 0% glucose medium for 1 h before RNA extraction. WT (H99) induced under the same conditions was used as reference for each mutant. A cluster analysis of genes significantly altered in mutant strains with p < 0.0001 is presented. B, close-up view of the cluster analysis presented in A. C, neighbor-joining phylogenic analysis of the Cn Sp1 (Cnag_00156) with S. cerevisiae (blue frame) and H. sapiens (tan frame) C-terminal zinc finger transcription factors.
Quantitative RT-PCR Experiments
C. neoformans strains were grown to a mid-log phase prior to induction. RNA was extracted before and following induction and treated with the RNase-free DNase Set (Qiagen). 5 μg of total RNA were used for cDNA generation using Invitrogen SuperScript® II reverse transcriptase and oligo(dT) primers in a 30-μl reaction mix. cDNA (1 μl) was used as a template for real-time reactions containing primer sets and iQTM SYBR® Green Supermix (Bio-Rad). The following primers were used in the epistasis studies: for Cn SP1, Crz1 qRT2939S (5′-GTTGTCCCAAAGCTATCGTCG) and Crz1 qRT3055A (5′-GACGAGCAAACTTCTTCCCACA); for PKC1, PKC cDNA 2225S (5′-CCAACAACAAGTGACGCAGAG) and PKC RT 2300A (5′-TTACCCTTACCCAGCACTGCTAA); for ACT1, actin qRT 1200S (5′-ATGTACAATGGTATTGCCGACCGTATG) and actin qRT 1455A (5′-GCTCTTCGCGATCCACATCTG) (microarray validation study primers are not shown). Quantitative PCR data were analyzed with Bio-Rad iQ5 software, and results are presented either as relative expression (ΔCt) with ACT1 as control (epistasis studies) (29) or as normalized expression (ΔΔCt) for the microarray validation studies.
Immunoprecipitation and Western Blotting
Cultures were grown overnight in YPD or in YPD containing 1 m sorbitol (150 ml) for the pkc1Δ strain at 30 °C with shaking to mid-log phase and then induced with either 10 μg/ml calcofluor white, 1 mm NaNO2, or glucose starvation for 1 h. Cells were lysed using glass beads with phenylmethylsulfonyl fluoride (final concentration of ∼1 mm) and Halt® protease and phosphatase inhibitor mixture (Pierce) and eluted with the immunoprecipitation lysis/wash buffer taken from the Pierce Classic IP kit (Pierce). The protein extract was adjusted to a final concentration of 1 mg/ml (2 mg/ml was used for pkc1Δ::pACT-Cn SP1). 700 μl of protein extract were mixed with 5 μl of monoclonal anti-c-myc antibody produced in mice (Sigma-Aldrich) and were incubated with rotation in 4 °C for 4 h. Immunoprecipitation was then carried out with the Pierce Classic IP kit following the manufacturer's instructions. From a final eluent volume of 50 μl of immunoprecipitated Cn Sp1, 30 μl were loaded for the anti-phosphorylated Cn Sp1 experiment, and 20 μl were run as loading control, using 7.5% SDS-PAGE. Gels were transferred overnight to a PVDF membrane and blocked with Invitrogen membrane blocking solution. Primary antibody blot was done with either the Invitrogen phosphoprotein antibody sampler pack at a final concentration of each antibody (anti- phosphorylated serine, threonine, and tyrosine) of 1 μg/ml to detect phosphorylated residues on Cn Sp1 or the anti c-myc antibody (1:1000) to detect total c-myc-tagged Cn Sp1. Secondary antibody blot was done with Pierce anti-rabbit HRP diluted 1:3000 and Pierce anti-mouse HRP diluted 1:5000 (phosphorylated Cn Sp1 experiment) or Pierce anti-mouse HRP diluted 1:2500 (total Cn Sp1 experiment). Signal detection was done with the Pierce SuperSignal according to the manufacturer's directions.
Chromatin Immunoprecipitation (ChIP)
ChIP was performed as described previously (30) with the following modifications. Following induction, formaldehyde was added to a final concentration of 1%, and incubation was continued at room temperature for 30 min. Cross-linking was quenched with glycine (8.5 ml of 2.5 m to ∼160 ml of culture) at room temperature for 5 min. Cells were harvested, washed three times in cold PBS, and lysed with glass bead beating. Cell extract was sonicated to produce an average size of ∼750 bp. The extract was centrifuged, and supernatant was mixed with either 5 μl of anti-c-myc or mouse IgG1 as an isotype control. Immunoprecipitation was performed as described above, except that elution was done with several washes of elution buffer (50 mm Tris-HCl, pH 8.0, 10 mm EDTA, 1% SDS), up to a total volume of 300 μl. DNA enrichment of promoter regions in the ChIP eluent was assayed by quantitative PCR as described above, with the following primers. The ACT1 genomic region was used as a control with the primers actin RT 739S (5′-ACCACTTCTGCCGAGCGAGA) and actin RT 945A (5′-GAGACCAAGGAGAGAAGGCTGG). The malate dehydrogenase promoter region at −170 to 0 bp from the ORF was used with primers pMDH 1396S (5′-CGAGTCGTAAACAACAGAATGGTC) and pMDH 1576A (5′-TACGGGTCATTCTGGGCTGG). The 1,4-α-glucan-branching enzyme promoter region at −291 to −40 from the ORF was used with primers α-glucan promoter RT 1009S (5′-CGAAAGCGGCAAGTCAGGTG) and α-glucan promoter RT 1063A (5′-GACTGAAGACGAGAAATGAGAAGGGA). The HSP12 promoter region at −300 to −210 from the ORF was used with primers HSP12 promoter RT S (5′-GCAGCAACACAAGCAGCAA) and HSP12 promoter RT A (5′-CGGCAAGAACCAGCAACAG). Promoter occupancy by Cn Sp1 was expressed as a ratio of the target promoter signal immunoprecipitated to the c-myc antibody versus the isotype control; the ratio in the ACT1 genomic region was used as a control.
Fluorescent Microscopy of GFP-tagged Cn Sp1
Cells were grown overnight to a mid-log phase prior to induction as described above. At each time point, slides were prepared with DAPI and observed under fluorescent microscopy as described (31). Triplicates of 100 cells each were observed for nuclear localization and expressed as mean ± S.D.
Statistics
Statistical significance of mouse survival times was assessed by Kruskall-Wallis analysis (analysis of variance on rank sum test). Statistical analysis was conducted using GraphPad Prism software, version 4.03.
RESULTS
CNAG_00156 Is Not a Functional Homolog of Yeast CRZ1 Despite Sequence Similarity
We identified CNAG_00156 as a potential homolog of the S. cerevisiae calcineurin-responsive transcription factor (Crz1), based on highest similarity (58.7%) to the ascomycete factor. However, during our study, this hypothesis appeared unlikely, based on three lines of evidence: 1) lack of restoration of temperature-dependent or cell wall-defective phenotypes after overexpression of CNAG_00156 in cna1Δ (cna1Δ::pACT-Cn SP1) (supplemental Fig. S1A); 2) lack of a calcineurin-dependent size shift of the CNAG_00156 protein on SDS-polyacrylamide gel, suggesting a lack of calcineurin-dependent post-translational modifications (supplemental Fig. S1C) (32, 33); 3) lack of calcium-dependent nuclear translocation of a GFP-tagged CNAG_00156 (supplemental Fig. S1D) previously demonstrated with Crz1 homologs (32, 33).
Transcriptional Profiling Reveals That cnag_00156Δ and pkc1Δ Mutant Strains Share Similar Transcriptional Profiles under Starvation Conditions
To elucidate the potential cellular pathway related to CNAG_00156, we compared the transcriptional profile of cnag_00156Δ with knock-out mutants of genes involved in laccase production, pka1Δ, pkc1Δ, ssa1Δ, and vad1Δ, as well as genes related to pathways with a known C-terminal zinc finger transcription factor in S. cerevisiae: cbk1Δ (RAM pathway) and cna1Δ. An ssa1Δ mutant in an H99 background was constructed for these studies and is described in the supplemental Methods (supplemental Fig. S7). The ste12Δ mutant, which has wild type virulence and laccase expression in the H99 background (34), was chosen as an outgroup control. Because nutrient starvation is a condition required for induction of numerous virulence-associated cellular programs, such as autophagy (20) and laccase expression (35), glucose starvation conditions were chosen for the strain comparisons.
Compared with the other mutants, the pkc1Δ strain exhibited the transcriptional profile most similar to that of cnag_00156Δ (Fig. 1, A and B, and supplemental Fig. S2), with 48 shared down-regulated genes (of 208 and 194 down-regulated genes in cnag_00156Δ and pkc1Δ, respectively), supporting a possible common pathway. Validation of sample genes from the microarray experiment was performed by Northern blot (supplemental Fig. S4) and quantitative RT-PCR studies (supplemental Fig. S5) and will be described in further detail elsewhere.
CNAG_00156 Shares Homology to C-terminal Zinc Finger Transcription Factors in S. cerevisiae and H. sapiens
Comparison of the full-length putative amino acid sequence of CNAG_00156 with other known C-terminal zinc finger TFs of S. cerevisiae failed to identify homologous yeast zinc finger proteins (Fig. 1C, blue frame) known to be related to Pkc1. Indeed, the known PKC1-related TFs in S. cerevisiae, Rlm1 and Swi4, are not C-terminal zinc finger proteins. In contrast, metazoans, represented by mammalian (H. sapiens) cells (Fig. 1C, tan frame) express several CNAG_00156 homologs with homology to the Sp TF family (58.7 and 54.5% similarity with Crz1 and Sp1, respectively). Interestingly, within the Sp TF family, Sp1 and Sp3 are known to be regulated by Pkc1 (36, 37). Based on this homology, we decided to designate CNAG_00156 as C. neoformans SP1 (Cn SP1).
Structural Analysis of Cn Sp1, H. sapiens Sp1, and S. cerevisiae Crz1
To better understand the structural relationship between Cn Sp1 and metazoan Sp1, we compared the zinc finger elements of Cn Sp1 with those of the S. cerevisiae Crz1 and the archetype H. sapiens Sp1 because this region of the protein is the most highly conserved across species and is an important functional motif. SMART analysis (38) showed that the distribution of the C-terminal zinc finger domains were of a similar pattern in both Cn Sp1 and H. sapiens Sp1 (Fig. 2A), with three domains in Cn Sp1 (944–968, 974–1001, and 1007–1034) and H. sapiens Sp1 (626–650, 656–680, and 686–708) and only two domains (569–591 and 597–619) in Crz1 from S. cerevisiae. This is an important divergence because the zinc finger domain is the principal DNA-binding element within these classes of transcription factors (39, 40).
Phylogenetic analysis of homologous C-terminal zinc finger domains across selected fungi and metazoans revealed further sequence divergence between the basidiomycete factor and those of ascomycetes, such as Crz1 (Fig. 2B and supplemental Fig. S3A). Interestingly, the first zinc finger domain of basidiomycete fungi, such as C. neoformans, appears to cluster best with metazoans rather than ascomycete yeast, such as S. cerevisiae, although the relationship was weakly supported due to the short sequences of the motif. In contrast, the second zinc finger motif appears to follow classic evolutionary relationships with basidiomycete fungi clustering with the ascomycete motif. The third zinc finger motif of C. neoformans fulfills the protein family definition of a zinc finger motif (CX1–5CX12HX3–6(H/C)) (41), similar to the metazoan zinc finger motifs (supplemental Fig. S3B). However, a previously undescribed motif bearing a resemblance to zinc finger domains was also found in the S. cerevisiae Crz1 factor. A 9-amino acid insertion between the first two cysteine residues results in its failure to be classified as a canonical zinc finger motif. It is not known whether this region in S. cerevisiae plays a role in DNA binding, although recent studies suggest the importance of three zinc motifs in DNA binding (42). Nevertheless, these studies demonstrate an evolutionary divergence between the cryptococcal Sp1 and the ascomycete Crz1.
A Cn sp1Δ Mutant Shares Virulence Factor and Cell Wall Defects with a Cryptococcal pkc1Δ Mutant
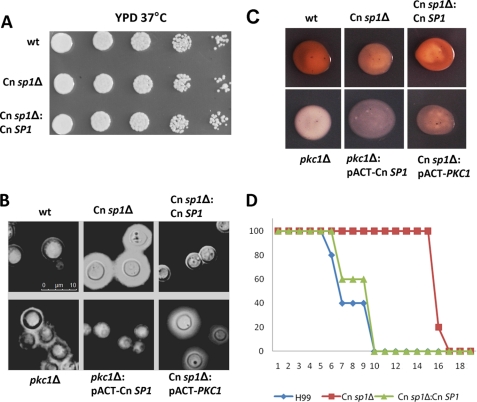
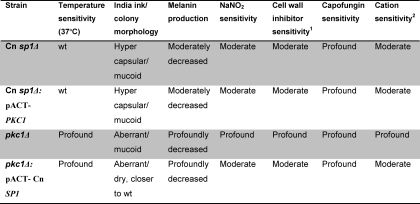
To establish a correlation between Cn SP1 and the PKC1 pathways, we compared phenotypic features of the two mutants, which showed a number of qualitative similarities. Both mutants had similar glossy-shiny colony morphologies under non-inducing conditions, due to subtly increased capsule production, as previously demonstrated by the same method for the pkc1Δ strain (16) (supplemental Fig. S6). India ink microscopy (Fig. 3B) of the two strains under the same conditions also demonstrated a shared increased capsule production in both, although the effect from the Cn sp1Δ mutation was more pronounced. Both mutants also shared decreased laccase production (Fig. 3C), which was more profound in the pkc1Δ mutant. Importantly, Cn sp1Δ exhibited attenuated virulence in a mouse model, showing the capacity for Cn SP1 to mediate PKC1-mediated effects on virulence (Fig. 3D). Although not explicitly tested for virulence in previous reports (16), the cryptococcal pkc1Δ mutant would be expected to be avirulent, based on its inability to grow at 37 °C. Both mutants also exhibited cell wall/membrane dysfunction, manifested by sensitivity to cations and cell wall inhibitors as well as to the nitrosative agent NaNO2 (Fig. 4 and Table 1). We also tested susceptibility of the strains to the pharmaceutical cell wall agent caspofungin, which showed that the Cn sp1Δ mutant displayed an intermediate sensitivity by MIC between WT and the pkc1Δ strains (WT, Cn sp1Δ::Cn SP1, and pkc1Δ::PKC1, 8 mg/ml; Cn sp1Δ, 4 mg/ml; and pkc1Δ, 0.25 mg/ml), suggesting a role for Cn SP1 in resistance to this cell wall-active antifungal agent. In summary, cell wall dysfunction was more profound in the pkc1Δ strain in comparison with the Cn sp1Δ mutant, suggesting that Cn Sp1 may partially mediate a subset of PKC1-dependent phenotypes. However, unlike the pkc1Δ strain, Cn sp1Δ did not have a growth restriction at 37 °C with sorbitol or 30 °C in the absence of sorbitol (Figs. 3A and 4), suggesting no contribution of Cn Sp1 to these PKC1-dependent phenotypes.
FIGURE 3.
Cn sp1Δ and pkc1Δ have altered virulence factors. A, WT (H99), Cn sp1Δ, and Cn sp1Δ::Cn SP1 strains were grown on YPD media and suspended in PBS to an A600 of 0.1. Five 5-fold dilutions of each strain were spotted on YPD agar plates, incubated in 37 °C, and observed for 48 h. B, WT, Cn sp1Δ, pkc1Δ, Cn sp1Δ:Cn SP1, pkc1Δ::pACT-Cn SP1, and Cn sp1Δ::pACT-PKC1 strains were grown on YPD plus sorbitol media, stained with India ink, and observed under microscopy. C, laccase activity. The above strains were plated following glucose starvation on asparagine plus neuroepinephrine media and incubated overnight. D, virulence of WT (H99), Cn sp1Δ, and Cn sp1Δ::Cn SP1 strains was evaluated in a mice model following intravenous injection of 106 cfu. *, p < 0.01 for WT versus Cn sp1Δ and Cn sp1Δ::Cn SP1 versus Cn sp1Δ; p > 0.05 for WT versus Cn sp1Δ::Cn SP1.
TABLE 1.
Constituent expression of Cn SP1 partially restores cell wall integrity in pkc1Δ
Phenotype is a comparison with wild type.
1 Sensitivity to 0.01% SDS, 0.5% Congo red, and 0.5 mg/ml calcoflour white.
2 Sensitivity to 200 mm CaCl2 and 50 mm LiCl2.
Overexpression of Cn SP1 Partially Restores Cell Wall Integrity Defects in a Cryptococcal pkc1Δ Mutant Strain
To examine epistatic relationships between PKC1 and Cn SP1, plasmids expressing each gene under the actin promoter were constructed and transformed into the other respective mutant, and overexpression was confirmed by quantitative PCR (normalized expression ± S.D.): Cn SP1 expression in pkc1Δ::pACT-Cn SP1/pkc1Δ, 2.5 ± 0.5; PKC1 expression in Cn sp1Δ::pACT-PKC1/Cn sp1Δ, 4.3 ± 1.6. Lack of PKC1 expression in the pkc1Δ::pACT-Cn SP1 strain was also confirmed by reverse transcription PCR (data not shown). The pkc1Δ::pACT-Cn SP1 strain demonstrated partially restored cell wall integrity (Fig. 4 and Table 1) in YPD without sorbitol as well as in YPD/sorbitol containing calcofluor white, SDS, CaCL2, LiCl2, and NaNO2 (Fig. 4). SP1 overexpression in the pkc1Δ mutant also partially restored the “dry” appearance of plated colonies (supplemental Fig. S6) and successfully restored the WT repressed capsule phenotype (Fig. 3B). Features that were not restored in the Cn SP1-overexpressing strain compared with the pkc1Δ strain were growth in 37 °C and in YPD/sorbitol with Congo red (Fig. 4), laccase expression (Fig. 2), and a reduced caspofungin MIC, which remained at 0.25. In contrast, overexpression of PKC1 in the Cn sp1Δ mutant did not alter any growth, capsule, or cell wall phenotypes, including caspofungin sensitivity. These results support the hypothesis that Cn SP1 acts downstream to PKC1, regulating a subpopulation of cell wall integrity functions.
Regulation of Cn SP1
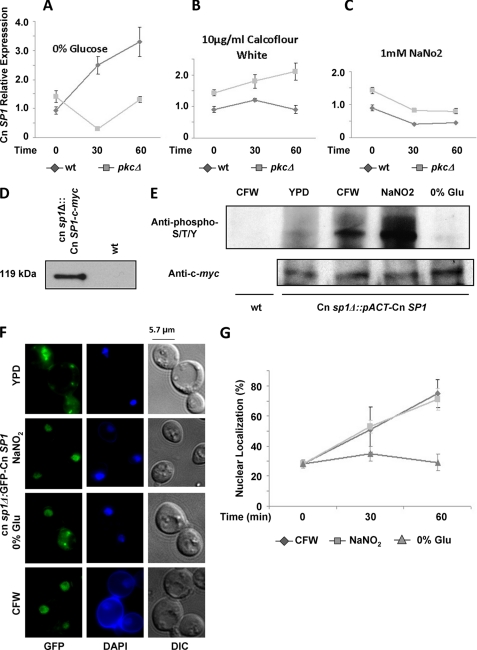
We next sought to study the effect of glucose starvation on Cn Sp1 because a recently described role for autophagy suggests that nutrient deprivation plays an important role during cryptococcal infection (20), and laccase is known to be derepressed in the absence of glucose (43). In addition, because of the possible role of Cn Sp1 in the Pkc1 pathway, we studied conditions shown previously to be Pkc1-dependent: calcofluor white and NaNO2 (16). As shown in Fig. 5A, Cn SP1 transcription is induced under glucose starvation and was found to be dependent on an intact PKC1 locus. During induction with calcofluor white and NaNO2, Cn SP1 transcript levels remained steady or were slightly reduced (Figs. 5, B and C, respectively) and were higher in the pkc1Δ compared with WT. Second, because PKC1 is known to regulate the activity of transcription factors by phosphorylation, we analyzed for this by immunoprecipitating an N-terminally c-myc-tagged Cn Sp1 in a Cn sp1Δ background (Cn sp1Δ::pACT-Cn SP1) (Fig. 5D), followed by Western blotting using an anti-phosphoserine/threonine/tyrosine antibody (Fig. 5E). Interestingly, the Pkc1-inducing conditions, calcofluor white and NaNO2, led to an increase in the phosphorylation of Cn Sp1, whereas there was no increase in phosphorylation under glucose starvation, suggesting complementary transcriptional and post-translational regulation of Cn Sp1 by Pkc1. Next, we studied the effect of these three conditions on the localization of GFP-Cn Sp1. As shown in Fig. 5F, a subset of the Cn Sp1 protein fraction is constitutively present in the nucleus, even under mid-log growth conditions in YPD. However, nuclear fractional localization of Cn Sp1 was increased during induction with calcofluor white and NaNO2 but not after glucose starvation (Fig. 5, F and G), again suggesting both transcriptional and post-translational regulation by Pkc1. Both mechanisms would be expected to result in an increase in the total nuclear quota of the Cn Sp1 protein under all three inducing conditions by this combination of mechanisms, resulting in successful Pkc1-dependent signaling through Cn Sp1.
FIGURE 5.
Cn Sp1 is regulated by Pkc1. A–C, Cn SP1 expression was assayed in WT and pkc1Δ strains, before (mid-log phase in YPD medium) and following the detailed conditions by quantitative RT-PCR. Relative expression was calculated using ACT1 as a reference gene. D, c-myc-tagged Cn Sp1 (Cn sp1Δ::pACT-Cn SP1) and WT strains were grown to mid-log phase in YPD and subjected to immunoprecipitation with anti c-myc antibody followed by Western blotting with anti c-myc Ab. E, Cn sp1Δ::pACT-Cn SP1 cells were grown to mid-log phase and immunoprecipitated following a 1-h induction in medium under the indicated conditions (detailed under “Experimental Procedures”). Western blotting was done with either anti-phosphorylated Thr/Ser/Tyr or anti-c-myc as a loading control. Immunoprecipitated WT cells were used as a negative control. F, Cn sp1Δ::GFP-Cn SP1 strains were grown to mid-log phase and induced for 1 h in medium under the indicated conditions (detailed under “Experimental Procedures”). Representative pictures of Cn sp1Δ::GFP-Cn SP1 cells before and following 1-h induction are presented. DAPI was used for nuclear co-staining. G, percentage of nuclear localization of GFP-Cn SP1 before and after 30 and 60 min of induction (n = 300 cells). CFW, calcofluor white; DIC, differential interference contrast.
Cn SP1 and PKC1 Mediate a Similar Transcriptional Response to Glucose Starvation
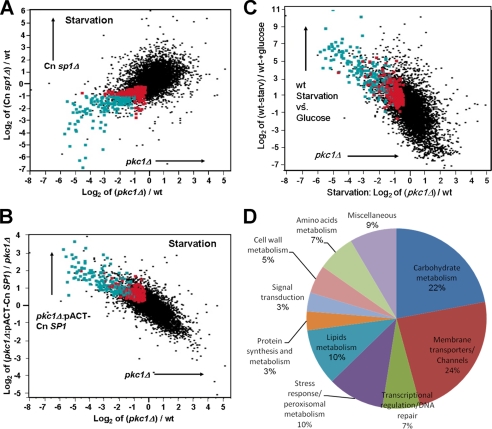
We next conducted additional whole-genome epistatic experiments of Cn SP1 and PKC1 under starvation using microarray analysis (see “Experimental Procedures”). Fig. 6a shows a y versus x plot, whereby y describes transcript level changes of the Cn sp1Δ mutant compared with that of the wild type under starvation conditions, and x describes transcriptional differences between the pkc1Δ mutant and wild type, all under starvation conditions. The finding of a significant correlation in both direction and expression levels between the Cn sp1Δ and the pkc1Δ mutants (slope of y = log2(Cn sp1Δ/WT) versus log2(pkc1Δ/wt): 0.5907 ± 0.01; p < 0.0001) suggests a genetic relationship between the two genes, whereby genes down-regulated in the first mutant also tended to be down-regulated in the second. Using these plots, we first identified genes that were significantly down-regulated in both the pkc1Δ and Cn sp1Δ strains with a false discovery rate of <0.05 (Fig. 6A, red and green dots). From these, we selected the genes that were down-regulated by at least 2-fold (Fig. 6A, green dots). Of the 6970 genes tested in the microarray, 163 met both criteria (Table 2). Consistent with these results, overexpression of Cn SP1 in the pkc1Δ mutant (pkc1Δ::pACT-Cn SP1) restored expression of a large majority of these genes, either completely or partially (>2-fold compared with pkc1Δ) in 102 genes (Fig. 6C and Table 2). Analysis of the entire transcriptome also showed a significant restoration of PKC1-dependent gene expression levels after Cn SP1 overexpression as evidenced by a reversal of the slope of Fig. 6B versus that of Fig. 6A and a regression having a significant negative slope (slope of y = log2(pkc1Δ::pACT-Cn SP1/pkc1Δ) versus log2(pkc1Δ/WT): −0.495 ± 0.005; p < 0.0001). Interestingly, careful comparison of the transcriptional profiles of the sp1Δ strain (Fig. 6A) with that of the SP1 overexpressor strain (Fig. 6C) identified numerous genes (shown in black) that were scored as non-significant but showed significant up-regulation after SP1 overexpression. One such gene, HSP12, was confirmed by Northern blot analysis to show reduced transcription in the sp1Δ mutant that was restored after SP1 overexpression (supplemental Fig. S4a). This reflects the relatively conservative nature of the false discovery methodology commonly used for determining significance in transcriptional differences and shows the utility of whole genome epistatic studies in improving the efficiency of gene discovery in microarray experiments. Hsp12 has been recently found to display cAMP-dependent gene transcription in fungal pathogens Candida albicans and C. neoformans and was found in the latter to have a role in polyene antifungal drug susceptibility (43, 44). Interestingly, the majority of the population of Cn SP1/PKC1-dependent genes (151 of 163) were also induced in the WT strain during transition from mid-log phase growth to starvation conditions (Fig. 6C), suggesting an important role for the PKC1-Cn SP1 pathway during nutrient stress.
FIGURE 6.
The Cn Sp1/Pkc1 pathway regulates gene expression following glucose starvation. A, transcriptional profile of Cn sp1Δ (y axis) and pkc1Δ (x axis) compared with WT following glucose starvation. Red dots, genes that are significantly down-regulated in Cn sp1Δ and pkc1Δ (false discovery rate <0.05) compared with WT. Green dots, a subset of the genes labeled in red that are also down-regulated by at least 2-fold compared with WT (n = 163). The genes in these groups are also presented in subsequent panels. B, transcriptional profile of pkc1Δ::pACT-Cn SP1 (compared with pkc1Δ) and pkc1Δ (compared with WT) following glucose starvation, presented on the y and x axis, respectively. Green and red, the same transcripts as in A. C, transcriptional profile of WT (pre- and poststarvation) and pkc1Δ (compared with WT in starvation) presented on the y and x axis, respectively. Green and red, the same transcripts as in A. D, pie diagram detailing the functional categories of 59 genes with known function of the 163 genes identified in A (green dots).
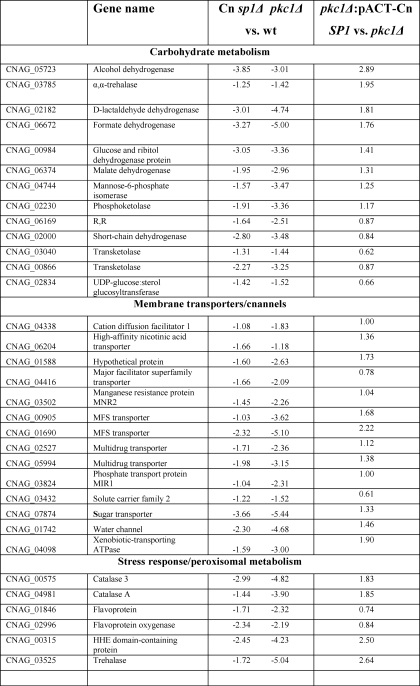
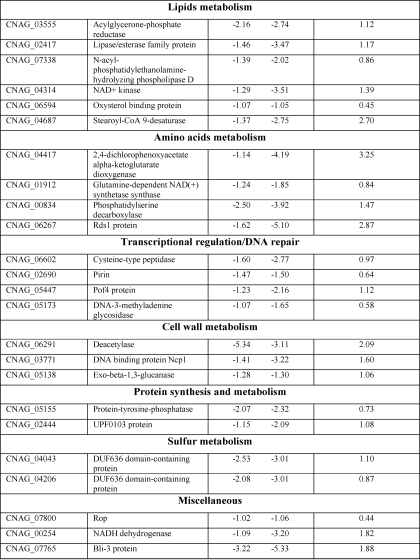
TABLE 2.
Cn Sp1/Pkc1-regulated genes
Shown is a summary of identifiable genes (n = 59) down-regulated in both Cn sp1Δ and pkc1Δ compared with WT under glucose starvation (>2-fold difference and false discovery rate of <0.05), divided by functional categories. -Fold change in expression is presented in log2. The-fold change in gene expression in pkc1Δ::pACT-Cn SP1 strain compared with pkc1Δ is also presented.
Table 2 details genes that were down-regulated >2-fold with a false discovery rate of <0.05 in both pkc1Δ and Cn sp1Δ following glucose starvation. Functionally, these genes include those involved in carbohydrate metabolism, membrane transporters and channels, and general stress response (for an overview, see Fig. 6D). Genes involved in several virulence pathways were identified, including the NTH1 gene involved in trehalose metabolism (45) and the allergen 1 gene involved in mucoid switch variants of C. neoformans (46). We validated the results presented in Table 2 and Fig. 6 by confirmation of a subset of genes by either Northern blot (supplemental Fig. S4a) or quantitative RT-PCR (supplemental Fig. S4b). We also confirmed several additional genes of interest that were found to be down-regulated in the mutants but had not met the statistical criteria similar to those of HSP12 described above (supplemental Fig. S4). For example, expression of 1,3-β-glucan synthase, a target of the antifungal caspofungin (47) and a critical cell wall synthesis enzyme in C. neoformans (48), is increased following starvation in WT but decreased in pkc1Δ and Cn sp1Δ. WT expression is partially restored in the pkc1Δ::pACT-Cn SP1 strain. This reduction may partially explain the increased susceptibility to caspofungin of both the Cn sp1Δ and the pkc1Δ mutants. However, the lack of restoration of caspofungin resistance in the pkc1Δ mutant by Cn Sp1 described above supports a role for additional genes in this unique cryptococcal resistance besides 1,3-β-glucan synthase expression, as suggested recently (49). The transcription of laccase was also reduced in the Cn sp1Δ but not in pkc1Δ (Fig. S4), despite reduced enzymatic activity in both (Fig. 3C), suggesting a complexity of regulation of this gene involving both transcriptional and post-transcriptional mechanisms.
Cn Sp1 Binds to Promoter Regions of Cn Sp1/Pkc1-dependent Genes
ChIP was performed using the Cn sp1Δ::pACT-Cn SP1 strain, which expresses Cn Sp1 as a fusion with a c-myc affinity tag (see “Experimental Procedures”). Immunoprecipitation was performed using either an anti-c-myc monoclonal antibody (Ab) or a mouse IgG1 isotype control Ab, and promoter occupancy was quantified using a quantitative PCR assay. Promoter occupancy was expressed as a ratio of the target promoter signal immunoprecipitated by the c-myc antibody versus the isotype control. Following glucose starvation, promoters of HSP12 and MDH (malate dehydrogenase) showed increased promoter occupancy ratios of 230 ± 5.9 and 295.4 ± 37.4, respectively, whereas in mid-log phase cells, Cn Sp1 occupancy was increased for the MDH but not the HSP12 promoters (29.7 ± 4.5 versus 0.61 ± 0.09, respectively). In contrast, DNA encoding the unrelated actin gene showed no enrichment after c-myc immunoprecipitation (data not shown). Furthermore, during starvation, the ratio of 1,4-α-glucan branching enzyme promoter to actin was 1.4 ± 0.34, and target gene signals were undetectable in mid-log phase cells, suggesting that this gene is not a direct target of Cn Sp1.
DISCUSSION
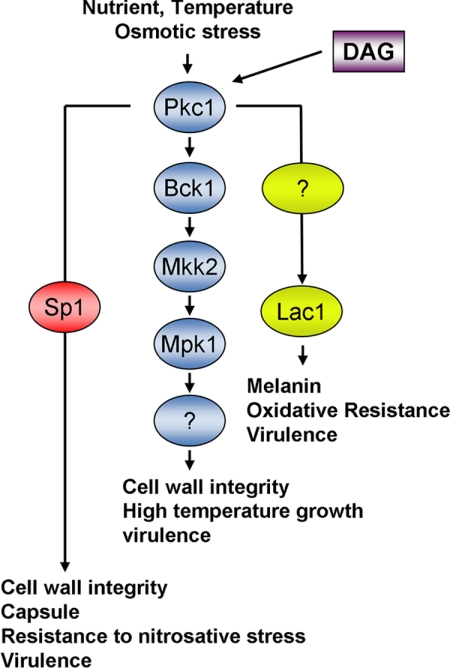
Previous work demonstrated that cryptococcal virulence and laccase expression are dependent on activation of the protein kinase C pathway by diacylglycerol (50, 51). A multiple-component pathway emanates from PKC1: one mediated through the MAPK signaling members, Bck1, Mkk2, and Mpk1, responsible for growth at high temperature and cell wall integrity and an additional unknown pathway(s) responsible for laccase expression, capsule regulation, and nitrosative stress (17). The present work confirms the existence of an additional parallel pathway and identifies a novel Pkc1-dependent C-terminal zinc finger transcription factor in fungi (Fig. 7). The reliance of the TF on Pkc1 was suggested by a screen using a microarray-based transcriptional comparison with known signal transduction mutants. An association with Pkc1 was then confirmed by a series of biochemical and epistatic experiments. The cryptococcal transcription factor was named Cn Sp1 because it is homologous to the Sp1/KLF transcription factor family within metazoans that, like Cn Sp1, contains three C-terminal Cys2His2-type zinc finger motifs.
FIGURE 7.
Role of Sp1 in the Pkc1 signaling pathway of C. neoformans. Pkc1 phosphorylates a member of the MAPK signaling pathway, Bck1, with subsequent phosphorylation of Mkk2 and the downstream component Mpk1 to mediate cell wall integrity, growth at high temperature, and virulence. Pkc1 also regulates the transcription factor Sp1 by phosphorylation, leading to activation by nuclear translocation as well as by transcriptional mechanisms, leading to regulation of osmoresistance, cell wall integrity, and virulence in parallel with the MAPK pathway as well as a unique pathway leading to resistance to nitrosative stress, capsule production, and caspofungin resistance. Laccase (Lac1) is regulated by Pkc1 via an unknown pathway. DAG, diacylglycerol. Adapted from Gerik et al. (16).
Interestingly, Cn Sp1 also bears sequence similarity to a group of ascomycete C-terminal transcription factors with closest homology, by a simple BLAST search, to the calcineurin-responsive zinc finger protein, Crz1, but these typically contain only two canonical C-terminal zinc finger motifs (Fig. 2). Calcineurin-dependent signaling is important in a number of cellular processes in C. neoformans, including growth at elevated temperature, virulence, and sexual development. Expression of the virulence factor laccase also appears to be dependent on calcineurin, as evidenced by a role in calcium-dependent expression mediated by the transcriptional co-activator, Ssa1, and by the dependence of Ssa1 on Crz1 in S. cerevisiae (52). However, our studies showed that mutants of the cryptococcal Cn Sp1 did not share phenotypes with that of the calcineurin mutant cna1Δ, did not display calcineurin-dependent size shifts on an SDS-polyacrylamide gel, and did not display calcium-dependent nuclear localization, typical of the calcineurin-dependent ascomycete factor. This led us to screen for other potential signal transduction pathways using a microarray comparison screening approach.
Analysis of the C-terminal zinc finger motifs of Cn Sp1 allowed an evolutionary comparison of similar proteins within both fungi and metazoans because this region is more highly conserved and is an important functional signature of both the Crz1 and Sp family of proteins (39, 40). These studies demonstrated a complex evolutionary divergence of the cryptococcal TF from that of ascomycetes, such as S. cerevisiae. For example, although the second cryptococcal zinc finger motif shares closest homology with the second of two zinc finger motifs of the ascomycete Crz1, the first displays closer similarity to that of the metazoan and plant Sp/KLF homologs. Examination of a third cryptococcal zinc finger motif shows that it superficially displays homology to a non-canonical zinc finger-like motif within the ascomycete factors that has not been described previously. Excluding the ascomycete site would again place the cryptococcal canonical zinc finger site closest to the metazoan canonical zinc finger motifs. However, retention of the cysteine- and histidine-containing ascomycete sequences during evolution suggests that this third non-canonical zinc finger-like motif may have retained function. Because recent structural studies suggest a role for the third zinc finger motifs in determining DNA sequence specificity and binding affinity (40, 52), this divergent ascomycete motif could play a role in differentiating the DNA sequences recognized between the mammalian and ascomycete TFs. Interestingly, analysis of promoter sequences from the HSP12 and MDH genes that showed Cn Sp1 promoter occupancy by chromatin immunoprecipitation identified the presence of consensus Sp1 binding sites (Hsp12, 490CCGCCC; MDH, 59CCGCCC) but not consensus Crz1 binding sites, again suggesting greater similarity to the metazoan TF. However, more detailed promoter dissection studies are required to confirm these findings. In addition, examination of the C. neoformans annotated database (Broad Institute Web site) identified two C-terminal zinc finger proteins (CNAG_00039 and CNAG_01014) that contained the requisite two zinc finger motifs of Crz1, but these did not share strong homology with the Crz1 protein either by BLAST or ClustalW algorithms. This suggests an evolutionary loss of the primordial Crz1 gene product function in C. neoformans. Indeed, previous attempts to identify a Crz1 homolog in C. neoformans by a number of methods, including a multicopy suppressor screen of a cryptococcal calcineurin mutant, failed to identify functional homologs of Crz1 in C. neoformans (27).
Interestingly, the Sp/KLF class of metazoan transcription factors is regulated by a variety of signal pathways, including protein kinase homologs PKCζ, which have been best studied in mammalian systems (40). These C-terminal transcription factors are also regulated by phosphorylation, similar to the cryptococcal factor. The metazoan TFs also act as coactivators of multiple pathways, including Ras and phosphatidylinositol 3-kinase pathways, suggesting interesting precedents to examine for Cn Sp1 in the future. However, it is important to be cautious in extrapolating functions to the cryptococcal Sp1, based on the distant phylogenetic relationships involved. Additional structural studies will be needed to differentiate Cn Sp1 from the metazoan factors.
Although it is difficult to make precise comparisons of functionality, it appears that the evolutionary structural drift of the fungal C-terminal zinc finger protein from Crz1 to Cn Sp1 also resulted in changes in the types of cellular functions regulated by this factor as compared with that reported previously for Crz1 from S. cerevisiae (39). For example, although a variety of cell wall synthetic functions are regulated by both Crz1 (chitin synthase type I, 1,3-β-glucan synthesis regulator RHO1) and Cn Sp1 (1,3-β-glucan synthase), Cn Sp1 appears to have picked up additional target functions in carbohydrate metabolism, including trehalose regulation and amino acid metabolism (such as the Rds1 protein, homologs of which are involved in ubiquitin-binding degradative functions (53)). In addition, expression of degradative target genes of CRZ1, such as carboxypeptidase and ATG5, the latter involved in autophagy induction (54), appears to have been lost in the evolution toward a Pkc1-dependent factor. Such changes in the regulatory landscape may have optimized relationships between environmental signals and cellular outputs that resulted in its evolution to a mammalian pathogen. Indeed, the cryptococcal Sp1 factor was found to mediate several important Pkc1-dependent phenotypes peculiar to its role as a pathogen, including capsule regulation and resistance to nitrosative stress. Importantly, Cn Sp1 was required for wild-type virulence in a mouse model. However, although the Cn sp1Δ mutant was defective in laccase expression, epistatic studies did not show restoration of the pkc1Δ laccase defect after Cn SP1 overexpression, suggesting a role for additional pathway(s) mediating Pkc1-dependent laccase expression. Interestingly, our microarray epistatic transcriptional studies suggest that a preponderance of Pkc1-mediated transcription is dependent on Cn Sp1 signaling under glucose depletion conditions. However, these data should not be interpreted as implicating Cn Sp1 in all Pkc1-mediated transcription as cross-talk, and the role of the parallel MAPK pathway may lead to less reliance on Cn Sp1 under other Pkc1-associated conditions, such as oxidative or nitrosative stress. Interestingly, the dependence of some genes, such as malate dehydrogenase, showed strong reliance on both Pkc1 and Cn Sp1 by Northern analysis, whereas glucan synthase showed less dependence, suggesting such a role for multiple interacting signals communicating with Cn Sp1. Examination of the microarray epistatic experiments appears to bear this out, with a large variation in both PKC1 and Cn SP1-dependent expression levels across the C. neoformans transcriptome. Such data show the advantage of a consideration of the whole genome in determining the regulatory impact of components of a signal transduction pathway. Induction of the glucose starvation response by Pkc1/Cn Sp1 may be particularly important in cryptococcal infections where nutrient deficiency encountered in host macrophages and brain is suggested by a role for autophagy during pathogenesis (20). Nutrient stress, in combination with host oxidative and temperature stress, is a host environmental component against which the fungus must compete for successful infection. The ability of the organism to induce transcriptional programs during nutrient limitation, such as that mediated by Pkc1-Cn Sp1 modeled here, during starvation may be a key component in niches leading to low metabolic states, such as during latent infection, demonstrated in recent clinical studies showing long periods of time within the host between initial infection and manifestation of disease during HIV-mediated immune suppression (55).
Supplementary Material
Acknowledgments
We would like to acknowledge the kind help of S. Giles for help with the annotation of the H99 C. neoformans database.
This work was supported, in whole or in part, by National Institutes of Health Grants AI45995 and AI49371 and by the Intramural Research Program of the National Institutes of Health, NIAID.

The on-line version of this article (available at http://www.jbc.org) contains supplemental Methods and supplemental Table S1 and Figs. S1–S8.
S. S. Zhang and P. R. Williamson, unpublished observation.
- TF
- transcription factor
- MIC
- minimum inhibitory sensitivity
- Cn
- C. neoformans
- Ab
- antibody.
REFERENCES
- 1. Bichile L. S., Gokhale Y. A., Sridhar V., Gill N. H. (2001) J. Assoc. Physicians India 49, 377–378 [PubMed] [Google Scholar]
- 2. Sorrell T. C., Chen S. C. A., Phillips P., Marr K. A. (2011) Cryptococcus: From Human Pathogen to Model Yeast, pp. 595–606, American Society for Microbiology Press, Washington, D.C [Google Scholar]
- 3. French N., Gray K., Watera C., Nakiyingi J., Lugada E., Moore M., Lalloo D., Whitworth J. A., Gilks C. F. (2002) AIDS 16, 1031–1038 [DOI] [PubMed] [Google Scholar]
- 4. Park B. J., Wannemuehler K. A., Marston B. J., Govender N., Pappas P. G., Chiller T. M. (2009) AIDS 23, 525–530 [DOI] [PubMed] [Google Scholar]
- 5. Odom A., Muir S., Lim E., Toffaletti D. L., Perfect J., Heitman J. (1997) EMBO J. 16, 2576–2589 [DOI] [PMC free article] [PubMed] [Google Scholar]
- 6. Salas S. D., Bennett J. E., Kwon-Chung K. J., Perfect J. R., Williamson P. R. (1996) J. Exp. Med. 184, 377–386 [DOI] [PMC free article] [PubMed] [Google Scholar]
- 7. Chang Y. C., Kwon-Chung K. J. (1994) Mol. Cell. Biol. 14, 4912–4919 [DOI] [PMC free article] [PubMed] [Google Scholar]
- 8. Chang Y. C., Penoyer L. A., Kwon-Chung K. J. (1996) Infect. Immun. 64, 1977–1983 [DOI] [PMC free article] [PubMed] [Google Scholar]
- 9. Chang Y. C., Kwon-Chung K. J. (1998) Infect. Immun. 66, 2230–2236 [DOI] [PMC free article] [PubMed] [Google Scholar]
- 10. Perez P., Calonge T. M. (2002) J. Biochem. 132, 513–517 [DOI] [PubMed] [Google Scholar]
- 11. Jung U. S., Levin D. E. (1999) Mol. Microbiol. 34, 1049–1057 [DOI] [PubMed] [Google Scholar]
- 12. Jung U. S., Sobering A. K., Romeo M. J., Levin D. E. (2002) Mol. Microbiol. 46, 781–789 [DOI] [PubMed] [Google Scholar]
- 13. Watanabe Y., Irie K., Matsumoto K. (1995) Mol. Cell. Biol. 15, 5740–5749 [DOI] [PMC free article] [PubMed] [Google Scholar]
- 14. Watanabe Y., Takaesu G., Hagiwara M., Irie K., Matsumoto K. (1997) Mol. Cell. Biol. 17, 2615–2623 [DOI] [PMC free article] [PubMed] [Google Scholar]
- 15. Kim K. Y., Truman A. W., Levin D. E. (2008) Mol. Cell. Biol. 28, 2579–2589 [DOI] [PMC free article] [PubMed] [Google Scholar]
- 16. Gerik K. J., Bhimireddy S. R., Ryerse J. S., Specht C. A., Lodge J. K. (2008) Eukaryot. Cell 7, 1685–1698 [DOI] [PMC free article] [PubMed] [Google Scholar]
- 17. Gerik K. J., Donlin M. J., Soto C. E., Banks A. M., Banks I. R., Maligie M. A., Selitrennikoff C. P., Lodge J. K. (2005) Mol. Microbiol. 58, 393–408 [DOI] [PubMed] [Google Scholar]
- 18. Zhang S., Hacham M., Panepinto J., Hu G., Shin S., Zhu X., Williamson P. R. (2006) Mol. Microbiol. 62, 1090–1101 [DOI] [PubMed] [Google Scholar]
- 19. Waterman S. R., Hacham M., Panepinto J., Hu G., Shin S., Williamson P. R. (2007) Infect. Immun. 75, 714–722 [DOI] [PMC free article] [PubMed] [Google Scholar]
- 20. Hu G., Hacham M., Waterman S. R., Panepinto J., Shin S., Liu X., Gibbons J., Valyi-Nagy T., Obara K., Jaffe H. A., Ohsumi Y., Williamson P. R. (2008) J. Clin. Invest. 118, 1186–1197 [DOI] [PMC free article] [PubMed] [Google Scholar]
- 21. Cox G. M., Toffaletti D. L., Perfect J. R. (1996) J. Med. Vet. Mycol. 34, 385–391 [PubMed] [Google Scholar]
- 22. Edgar R. C. (2004) Nucleic Acids Res. 32, 1792–1797 [DOI] [PMC free article] [PubMed] [Google Scholar]
- 23. Swofford D. L. (2003) PAUP*: Phylogenetic Analysis Using Parsimony (*and Other Methods), Version 4, Sinauer Associates, Sunderland, MA [Google Scholar]
- 24. Liu X., Hu G., Panepinto J., Williamson P. R. (2006) Mol. Microbiol. 61, 1132–1146 [DOI] [PubMed] [Google Scholar]
- 25. Liu L., Tewari R. P., Williamson P. R. (1999) Infect. Immun. 67, 6034–6039 [DOI] [PMC free article] [PubMed] [Google Scholar]
- 26. Park Y. D., Panepinto J., Shin S., Larsen P., Giles S., Williamson P. R. (2010) J. Biol. Chem. 285, 34746–34756 [DOI] [PMC free article] [PubMed] [Google Scholar]
- 27. Kraus P. R., Boily M. J., Giles S. S., Stajich J. E., Allen A., Cox G. M., Dietrich F. S., Perfect J. R., Heitman J. (2004) Eukaryot. Cell 3, 1249–1260 [DOI] [PMC free article] [PubMed] [Google Scholar]
- 28. Benjamini Y., Hochberg Y. (1995) J. R. Stat. Soc. Ser. B 57, 289–300 [Google Scholar]
- 29. Chow E. D., Liu O. W., O'Brien S., Madhani H. D. (2007) Curr. Genet. 52, 137–148 [DOI] [PubMed] [Google Scholar]
- 30. Ren B., Robert F., Wyrick J. J., Aparicio O., Jennings E. G., Simon I., Zeitlinger J., Schreiber J., Hannett N., Kanin E., Volkert T. L., Wilson C. J., Bell S. P., Young R. A. (2000) Science 290, 2306–2309 [DOI] [PubMed] [Google Scholar]
- 31. Zhu X., Gibbons J., Garcia-Rivera J., Casadevall A., Williamson P. R. (2001) Infect. Immun. 69, 5589–5596 [DOI] [PMC free article] [PubMed] [Google Scholar]
- 32. Boustany L. M., Cyert M. S. (2002) Genes Dev. 16, 608–619 [DOI] [PMC free article] [PubMed] [Google Scholar]
- 33. Karababa M., Valentino E., Pardini G., Coste A. T., Bille J., Sanglard D. (2006) Mol. Microbiol. 59, 1429–1451 [DOI] [PubMed] [Google Scholar]
- 34. Yue C., Cavallo L. M., Alspaugh J. A., Wang P., Cox G. M., Perfect J. R., Heitman J. (1999) Genetics 153, 1601–1615 [DOI] [PMC free article] [PubMed] [Google Scholar]
- 35. Williamson P. R. (1994) J. Bacteriol. 176, 656–664 [DOI] [PMC free article] [PubMed] [Google Scholar]
- 36. Rafty L. A., Khachigian L. M. (2001) Nucleic Acids Res. 29, 1027–1033 [DOI] [PMC free article] [PubMed] [Google Scholar]
- 37. Cramer T., Jüttner S., Plath T., Mergler S., Seufferlein T., Wang T. C., Merchant J., Höcker M. (2008) Cell. Signal. 20, 60–72 [DOI] [PubMed] [Google Scholar]
- 38. Schultz J., Milpetz F., Bork P., Ponting C. P. (1998) Proc. Natl. Acad. Sci. U.S.A. 95, 5857–5864 [DOI] [PMC free article] [PubMed] [Google Scholar]
- 39. Cyert M. S. (2003) Biochem. Biophys. Res. Commun. 311, 1143–1150 [DOI] [PubMed] [Google Scholar]
- 40. Wierstra I. (2008) Biochem. Biophys. Res. Commun. 372, 1–13 [DOI] [PubMed] [Google Scholar]
- 41. Klug A., Schwabe J. W. (1995) FASEB J. 9, 597–604 [PubMed] [Google Scholar]
- 42. Lee J., Kim J., Seok C. (2010) J. Phys. Chem. B 114, 7662–7671 [DOI] [PubMed] [Google Scholar]
- 43. Maeng S., Ko Y. J., Kim G. B., Jung K. W., Floyd A., Heitman J., Bahn Y. S. (2010) Eukaryot. Cell 9, 360–378 [DOI] [PMC free article] [PubMed] [Google Scholar]
- 44. Sheth C. C., Mogensen E. G., Fu M. S., Blomfield I. C., Mühlschlegel F. A. (2008) Fungal Genet. Biol. 45, 1075–1080 [DOI] [PubMed] [Google Scholar]
- 45. Ngamskulrungroj P., Himmelreich U., Breger J. A., Wilson C., Chayakulkeeree M., Krockenberger M. B., Malik R., Daniel H. M., Toffaletti D., Djordjevic J. T., Mylonakis E., Meyer W., Perfect J. R. (2009) Infect. Immun. 77, 4584–4596 [DOI] [PMC free article] [PubMed] [Google Scholar]
- 46. Jain N., Li L., Hsueh Y. P., Guerrero A., Heitman J., Goldman D. L., Fries B. C. (2009) Infect. Immun. 77, 128–140 [DOI] [PMC free article] [PubMed] [Google Scholar]
- 47. Kartsonis N. A., Nielsen J., Douglas C. M. (2003) Drug Resist. Updat. 6, 197–218 [DOI] [PubMed] [Google Scholar]
- 48. Thompson J. R., Douglas C. M., Li W., Jue C. K., Pramanik B., Yuan X., Rude T. H., Toffaletti D. L., Perfect J. R., Kurtz M. (1999) J. Bacteriol. 181, 444–453 [DOI] [PMC free article] [PubMed] [Google Scholar]
- 49. Maligie M. A., Selitrennikoff C. P. (2005) Antimicrob. Agents Chemother. 49, 2851–2856 [DOI] [PMC free article] [PubMed] [Google Scholar]
- 50. Heung L. J., Luberto C., Plowden A., Hannun Y. A., Del Poeta M. (2004) J. Biol. Chem. 279, 21144–21153 [DOI] [PubMed] [Google Scholar]
- 51. Heung L. J., Kaiser A. E., Luberto C., Del Poeta M. (2005) J. Biol. Chem. 280, 28547–28555 [DOI] [PubMed] [Google Scholar]
- 52. Yoshimoto H., Saltsman K., Gasch A. P., Li H. X., Ogawa N., Botstein D., Brown P. O., Cyert M. S. (2002) J. Biol. Chem. 277, 31079–31088 [DOI] [PubMed] [Google Scholar]
- 53. Yashiroda H., Kaida D., Toh-e A., Kikuchi Y. (1998) Gene 225, 39–46 [DOI] [PubMed] [Google Scholar]
- 54. Yang Z., Klionsky D. J. (2010) Nat. Cell Biol. 12, 814–822 [DOI] [PMC free article] [PubMed] [Google Scholar]
- 55. Dromer F., Mathoulin S., Dupont B., Laporte A. (1996) Clin. Infect. Dis. 23, 82–90 [DOI] [PubMed] [Google Scholar]
Associated Data
This section collects any data citations, data availability statements, or supplementary materials included in this article.


