

Abstract
The genetic code is redundant with most amino acids using multiple codons. In many organisms, codon usage is biased toward particular codons. Understanding the adaptive and nonadaptive forces driving the evolution of codon usage bias (CUB) has been an area of intense focus and debate in the fields of molecular and evolutionary biology. However, their relative importance in shaping genomic patterns of CUB remains unsolved. Using a nested model of protein translation and population genetics, we show that observed gene level variation of CUB in Saccharomyces cerevisiae can be explained almost entirely by selection for efficient ribosomal usage, genetic drift, and biased mutation. The correlation between observed codon counts within individual genes and our model predictions is 0.96. Although a variety of factors shape patterns of CUB at the level of individual sites within genes, our results suggest that selection for efficient ribosome usage is a central force in shaping codon usage at the genomic scale. In addition, our model allows direct estimation of codon-specific mutation rates and elongation times and can be readily applied to any organism with high-throughput expression datasets. More generally, we have developed a natural framework for integrating models of molecular processes to population genetics models to quantitatively estimate parameters underlying fundamental biological processes, such a protein translation.
Keywords: ribosome overhead cost, protein production rate
For many organisms, the preferential usage of certain codons, commonly referred to as codon usage bias (CUB), is strongly correlated with corresponding tRNA abundances and expression levels (1, 2). Explanations for these correlations abound; the most favored ones include selection against translational errors (3–5), selection for translational efficiency (6–8), effects on protein folding (9), and stability of mRNA secondary structures (10, 11). Because different combinations of these factors could lead to very similar patterns of codon usage, their relative importance in shaping the evolution of CUB is unknown (10, 12, 13). We believe that this uncertainty over their relative importance is, in large part, attributable to a lack of mechanistic models of processes hypothesized to give rise to these patterns (exceptions are found in refs. 5, 6, 13, and 14). Although most theories of codon usage predict that the degree of bias in codon usage should increase with gene expression (1, 4, 15), they lack any specific quantitative predictions about the rate and nature of these changes. This is because most commonly used indices of CUB, such as frequency of optimal codons (Fop) (1), codon adaptation index (CAI) (16), and codon bias index (CBI) (17), are both heuristic and aggregate measures of CUB and fail to define explicitly the factors responsible for the evolution of CUB. In contrast, we show that a mechanistic model of protein translation that explicitly includes the effects of biased mutation, genetic drift, and selection for efficient ribosome usage can explain the genome-wide codon usage patterns in Saccharomyces cerevisiae. Although ours is not the first attempt at using mechanistic models to explain CUB in a population genetics context (5, 6), it is unique in its ability to estimate codon-specific parameters and quantitatively predict how codon frequencies change with gene expression. We find that our model can explain ∼92% of the observed variation in CUB across the S. cerevisiae genome.
Model
Protein synthesis is the most energetically expensive process within a cell (19). During the log-phase of growth in S. cerevisiae, about 60% of transcriptional machinery is devoted to making about 2,000 ribosomes every minute (20). Because ribosomes are large complexes with a finite life span and are expensive to manufacture, one would expect strong selection for their efficient usage during protein translation (6, 21–23). Coding sequences that use faster codons free up ribosomes from the mRNA, leading to smaller polysome sizes as well as an increase in the pool of free ribosomes. Given that protein translation is limited by the initiation rate, an increased pool of free ribosomes will lead to an overall increase in the translation initiation and protein production rate (6, 24). Thus, we explicitly define selection for translation efficiency as selection for an increased pool of free ribosomes (6, 22). In the absence of other factors, selection for translation efficiency should favor coding sequences that use codons with shorter elongation times and the strength of this selection should increase with gene expression (6, 7, 23, 25). If selection for translational efficiency is a major force driving the evolution of CUB in S. cerevisiae, we should be able to predict the CUB of a gene based on the differences in elongation times of synonymous codons, mutational bias, and its expression level.
Based on the work of Gilchrist (5) and Gilchrist et al. (15), we begin our model by first noting that in the absence of translation errors, the expected cost-benefit ratio (cost for short) for production of a single functional protein is simply
 |
where xi is the number of codons of type i among the 61 sense codons used within a given coding sequence 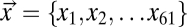 , ti is the expected elongation time for codon i, and C is a scaling factor that represents the overhead cost of ribosome usage in ATPs per second. Codons that have shorter elongation times will lead to lower costs η, and hence are expected to be selected over their coding synonyms. Based on the work of Gilchrist (5), we assume an exponential fitness function
 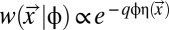 , where q is the scaling constant seconds per ATP determining the relationship between the rate of ATP usage and fitness w and φ is a measure of gene expression, specifically protein production rate (proteins per second). Modeling the cost of protein production in terms of ATP implicitly assumes that the organism is resource-limited and there exists selection for efficient ATP usage to maximize reproductive output. However, if the organism is not limited by resources, one would expect selection to maximize reproductive rate instead (26); in such a case, parameters C and q would be ATP-independent. This would, however, not affect the behavior of our model.
It is also important to note the distinction between the protein production rate and the translation rate of a ribosome across an mRNA. This lack of distinction has been the source of confusion over the role of gene expression in shaping patterns of codon usage in the past (6, 24). In addition, although the protein production rate of a gene changes during a single cell's lifetime, the φ value used here is the target time-averaged rate at which the protein will be produced. In this scenario, a change from an optimal codon to a suboptimal codon does not affect φ but, instead, affects the cost of meeting the target φ. Using the cost of producing a protein η as the phenotype, we calculate the probability of observing a particular coding sequence given its expression level,  .
.  is defined for each coding sequence in the synonymous codon genotype space Sc for a given protein. Under the Fisher–Wright process (27–29), this probability is
 |
where Ne is the effective population size and μi is the sum of mutation rates to codon i from its synonymous codons (29). Simply put,  , the probability of observing a particular synonymous codon genotype for a given protein, is a combined function of mutation bias
  , natural selection for translational efficiency w, and genetic drift Ne. Given an expression level φ, the probability of observing a set of codons for one amino acid is independent of the probability of observing a set of codons for another amino acid (SI Text, Analytical Solutions of the Model). This independence allows us to calculate the expected frequencies of codons within an amino acid independent of codon compositions of other amino acids. The resulting expected frequency of codon i of amino acid aak that has nk synonymous codons is given by
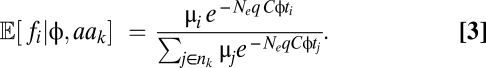 |
Eq. 3 describes how the expected frequency of a given codon changes with gene expression φ at its mutation-selection-drift equilibrium. To compare our model predictions with observed codon usage frequencies, we looked at the 4,674 verified nuclear genes that lack internal stops in S. cerevisiae (5) (Dataset S1). Because time-average target protein production rates of genes are not available for any organism, we use estimates of protein production rates during log growth as proxies. Empirical estimates of protein production rate φ were obtained from a study by Gilchrist (5), which combines mRNA abundance (30) and ribosome occupancy datasets (31, 32) (Dataset S1). The effective population size was set to Ne = 1.36 × 10⁷ based on the effective population size of its closely related species Saccharomyces paradoxus (19). Note that because Ne is scaled by qC in Eq. 3, any error in our estimate of Ne will only affect our estimates of qC and not the behavior of our predictions.
Results
Model Behavior.
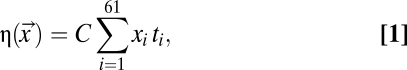
The general behavior of our model is illustrated in Fig. 1, which shows the simple case of one amino acid with two codons. It demonstrates how expected frequencies of the codons change with gene expression with respect to differences in the elongation times of the codons Δtij = ti − tj as well and their relative mutation rate μi/μj. As expected, codon usage in genes with low expression is primarily determined by their relative mutation rates, whereas codon usage in genes with high expression is determined by the differences in their elongation times. When both natural selection for translation efficiency and mutation biases favor the same codon, the lines representing expected frequencies of codons (Fig. 1, red lines) do not cross. However, when the direction of mutation bias is opposite to that of natural selection, the lines representing expected frequencies of codons cross (Fig. 1, blue lines).
Fig. 1.

Effect of varying relative mutation rate (μi/μj), elongation time (Δtij), and protein production rate (φ) on the expected codon frequencies (E[f]) in a hypothetical two-codon amino acid. (A) Effect of changing μi/μj on E[f] with φ. Solid lines represent the codon with a longer elongation time t1, and dotted lines represent the codon with a shorter elongation time t2. Mutation bias has a greater effect on E[f] at low φ, whereas at very high φ, the E[f] of codons converge to the same values, irrespective of μi/μj. (B) Effect of changing ti − tj on their expected frequencies E[f] with respect to φ. Solid lines represent the codon with a lower relative mutation rate μ1, and dotted lines represent the codon with a higher mutation rate μ2. Differences in elongation times between the two codons ti − tj has little effect on E[f] at low φ. However, at high φ, as ti − tj changes, so does the difference in their expected frequencies E[f].
Model Fit to S. cerevisiae Genome.
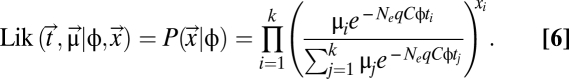
Using Eq. 2, we calculated the maximum likelihood estimates for the composite parameter qC, codon-specific differences in elongation time Δtij, and relative mutation rate μi/μj using 4,674 genes of the S. cerevisiae genome (more details are provided in Materials and Methods and Tables S1 and S2). Although our model uses 2(k − 1) parameters for each amino acid with k codons, we show that it is far from being overparameterized because it uses genome-scale datasets (SI Text, Argument Against Model Overparametrization). The fit of our model predictions with observed data is illustrated in Fig. 2. Specifically, Fig. 2 shows how the observed and predicted codon frequencies change with gene expression φ for all the amino acids that use multiple codons. Because the set of synonymous codons for Ser occurs in blocks of two and four codons separated by more than a single mutation step, we treat each of the blocks as separate amino acids, Ser2 and Ser4, respectively. The fit of our model can be quantified on a per-amino acid basis based on the Pearson correlation ρM between the mean of binned observed codon frequencies and predicted codon frequencies at the mean φ value. The ρM values ranged from 0.72 to 0.99, with a median value of 0.936.
Fig. 2.

Observed and predicted changes in codon frequencies with gene expression, specifically protein production rate φ. A–S correspond to specific amino acids, where codons ending in A or T are shown in shades of blue and codons ending in G or C are shown in shades of red. Solid dots and vertical bars represent mean ±1 SD of observed codon frequencies of genes in a given bin. The expected codon frequencies under our model are represented by solid lines. (T) Histogram of genes in each bin. We used k − 1 codons of an amino acid with k codons in estimating correlation coefficients. ρM represents the Pearson correlation between the mean of observed codon frequencies within a bin and predicted codon frequencies at mean φ value. ρc represents the Pearson correlation between observed codon counts and predicted codon counts of all genes at their individual φ value.
Although many indices of adaptation have been proposed to estimate the degree of codon bias within a gene, there exists no method or index that makes predictions on codon counts of individual genes. For instance, if a particular gene has a protein production rate φ, what should the distribution of its codons be given its amino acid sequence? To address this question directly, we used our estimates of Δtij and μi/μj (Tables S1 and S2) to evaluate on a per-gene basis the expected codon frequencies for each amino acid using Eq. 3 (Dataset S2). We find that the correlation between observed and predicted codon counts is ρc = 0.959 (Fig. 3), explaining ∼92% of observed variation in codon counts. Even at the level of individual amino acids, the correlation coefficients ρc ranged from 0.81 to 0.99. All but two amino acids had ρc > 0.9, indicating that the high correlation was consistent across all amino acids. In summary, we find that our model does an excellent job of predicting how the observed codon frequencies in S. cerevisiae change with gene expression φ.
Fig. 3.

Correlation between observed codon counts and predicted codon counts of individual genes. We used codon counts of k − 1 codons of an amino acid with k codons. Ignoring Met and Trp (one-codon amino acids) and splitting Ser into two blocks of four and two codons, there are 19 unique amino acid sets. Hence, the number of data points used is 4,674 × (59 − 19) = 186,960. We find a very high correlation (ρ = 0.959, P < 1015) between our model predictions and observed counts. (Inset) Distribution of correlation coefficients at the level of individual amino acids, indicating that our high correlation is not biased by specific amino acids and that we have a high correlation across all amino acids.
One key insight from this work is that in S. cerevisiae for amino acids with more than two codons, the frequencies of preferred codons with similar elongation time Δtij ~ 0 can change in a nonmonotonic manner with gene expression φ. For instance, in the case of Thr, the frequency of codon ACT increases from low to moderate levels of gene expression log(φ) but decreases at high gene expression and is replaced by codon ACC. This nonmonotonic behavior is the result of complex interplay between mutation biases and translation selection. Specifically, although both codons ACC and ACT have shorter elongation times than their other coding synonyms ACG and ACA, codon ACC has the shortest elongation time. However, unlike codon ACC, ACT is favored by mutation bias; thus, its frequency initially increases with gene expression. We call this phenomenon “mutational inertia,” whereby the frequency of a suboptimal codon transiently increases with gene expression attributable to mutation bias. This nonmonotonic behavior runs counter to traditional explanations, where the frequency of an optimal codon is expected to monotonically increase and that of a suboptimal codon is expected to monotonically decrease with gene expression (16, 33). We observed these effects of mutational inertia in most amino acids with more than two codons. Although nonmonotonic changes in codon frequencies with gene expression have been documented previously (34), the mechanisms responsible for this behavior have not been put forth. We believe this interesting and complex interplay between mutation biases and selection for efficient translation has been obscured because of an overemphasis on indices in studies of CUB. Our study illustrates the advantages of the model-based approach used here over heuristic approaches. In addition and as indicated by the crossing of lines representing codon frequencies, 7 of 10 amino acids with two codons in Fig. 2 D–J show mutation biases in a direction opposite to that of natural selection. In other words, codons with high frequencies in low-expression genes are not the same as the ones preferred in high-expression genes. Along with explaining these previously described patterns (35–37), we quantify the changes in codon frequencies with gene expression.
In addition to describing the genome-scale patterns of codon usage, our model allows for estimation of relative mutation rate μi/μj and differences in elongation times of these codons Δtij on a per-amino acid basis directly from the genome sequence and expression datasets. Interestingly, we find that estimates of relative mutation rates sometimes differed between amino acids. For instance, in the case of two-codon amino acids (Lys, Gln, and Glu), the NNA codons were always favored over NNG codons. However, the relative mutation rate μNNG/μNNA ranged from 0.45 to 0.68, with a mean of 0.546. These small but significant differences (t test, P < 10−9 for every pair of amino acids) in the estimation of relative mutation rate may be attributable, in part, to the fact that our model does not allow for nonsynonymous substitutions, some of which may behave in a nearly neutral manner, especially in genes with low φ values.
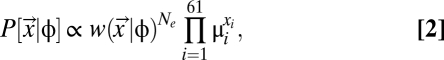
We also compared our estimates of Δtij with estimates based on tRNA gene copy numbers as a proxy for tRNA abundances and wobble penalties (Materials and Methods). We find that these independently obtained estimates of Δtij are highly correlated (ρ = 0.801; Fig. 4).
Fig. 4.

Correlation between our model-based estimates of Δtij with Δtij estimated using tRNA gene copy numbers. We find a strong correlation (ρ = 0.801, P < 10−9) between our model estimates and estimates of Δtij based on tRNA gene copy numbers, indicating that our estimates can be related to other biological estimates, such as tRNA abundances, directly.
Model Fit vs. Model Predictions.
To demonstrate the predictive value of our model, we randomly partitioned the S. cerevisiae genome into two sets of 2,337 genes each with no significant bias in their distribution of gene expression levels φ (t test, P > 0.4). Parameters estimated using half of the genome were found to be highly correlated with our previous estimates based on the entire genome (ρ > 0.99 for both Δtij and μi/μj; Fig. S1). We then used the parameters estimated using the first set of genes to predict gene-specific codon counts in the second set of genes. The correlation coefficient between observed and predicted codon counts at the level of individual genes was 0.96 (Figs. S2 and S3). Because we do not have ribosome occupancy datasets to estimate protein production rates for most organisms, we estimated Δtij and μi/μj using mRNA abundances (5, 30) as proxies for protein production rate φ. We found a very high correlation between parameters estimated using mRNA abundances and protein production rates (ρ > 0.97; Figs. S4 and S5). Because our model is based on mechanistic principles of protein translation, these parameters can be directly related to specific biological processes underlying protein translation. Our work demonstrates that, in principle, these parameters can be estimated directly from genomic and expression datasets, as shown above. Estimation of these parameters can thus be easily extended to any sequenced organisms for which genome-scale mRNA expression datasets exist.
Discussion
Broader Interpretation of Δtij.
The high correlation between estimates of Δtij from independent sources of genomic information (Fig. 4) suggests that our interpretation of the term Δtij is consistent with selection for translation efficiency as a major force in shaping patterns of codon usage. However, from a purely mathematical standpoint, the parameter Δtij is akin to the additive fitness component used by Sella and Hirsh (29), scaled by φ. Thus, its value can broadly be interpreted as an expression level-dependent selective coefficient associated with the specific codon pair. In the future, this broader interpretation should allow us to compare our genome-based estimates of Δtij with values expected under alternate hypotheses of the factors responsible for shaping codon usage patterns. For example, in the case of Cys, an interpretation of Δtij is difficult to justify based on a naive model of estimating elongation times from tRNA abundances. In S. cerevisiae, Cys is coded by a single tRNA, where the noncanonical codon TGT is recognized by wobble and assumed to be elongated at a slower rate than its synonym TGC (13, 38). Thus, our estimates of tTGT − tTGC < 0 cannot be explained on the basis of elongation times alone, because the sign of ΔtTGT,TGC is opposite to that expected based on tRNA abundances and wobble. A variety of factors could potentially explain this discrepancy. First, because of its unique ability to form disulfide linkages, Cys might be under stronger selection to minimize missense errors than other amino acids. The fact that a codon with a slower elongation rate might be better at minimizing missense errors has also been predicted in a large number of other microorganisms (13). Second, as noted by Bennetzen and Hall (17), codons with side-by-side GC nucleotides may be selected against because of the high binding energies between codon-anticodon pairs. Despite the fact that Δtij can potentially be interpreted many ways, the high correlation between our predicted Δtij and estimates of Δtij based simply on tRNA gene copy numbers and wobble parameters (Fig. 4) indicates a mechanistic link between our estimates of Δt and differences in elongation times of codons.
In summary, our work shows that genome-scale patterns of codon usage can be largely explained by the effects of genetic drift, mutational biases, and natural selection for efficient usage of ribosomes (i.e., translational efficiency). Although a variety of indices have been proposed to estimate the degree of adaptation of a gene based on its CUB, our method makes predictions in the opposite direction as well (i.e., predicting codon counts of a gene, given its expression level). Our model of translation efficiency also allows us to estimate codon-specific elongation times (selection coefficients) as well as relative mutation rates. In addition, we make quantitative predictions on how individual codon frequencies should change with gene expression in yeast. Although selection for translational efficiency appears to be sufficient to explain most of the genome-scale patterns of codon usage, this does not preclude the effects of other selective forces on the evolution of CUB. For instance, selection for translation accuracy (minimizing translation missense errors) has long been argued to be a dominant force in driving the evolution of CUB (3, 39, 40). However, current data suggest that only ∼10–50% of missense errors disrupt protein function (41, 42), and therefore cannot explain the high frequencies of ∼100% of mutationally disfavored codons in Phe, Asn, and Tyr amino acids (Fig. 2). Moreover, the assumptions underlying Akashi's test (3) used to support the translation accuracy hypothesis are not always justified (13). Nevertheless, selection for translation accuracy can explain codon usage at functionally and/or structurally critical sites of a protein (40). Because codons that minimize missense errors may not necessarily be the ones that minimize elongation times (13), our model is likely insufficient to explain the codon usage at these sites. Similarly, adaptation against nonsense errors has been documented in S. cerevisiae (14, 15) and other organisms (43). In addition, factors indirectly related to protein translation, such as mRNA secondary structures at the 5′ region of a gene, have been shown to be under selection for efficient binding of ribosomes to mRNAs, and hence can affect the frequency of codon usage at these sites (10, 11).
Clearly, although a number of selective mechanisms have been proposed to explain and likely contribute to specific patterns of codon usage, the combined effects of these forces in shaping genomic patterns of codon usage are not well understood (4, 24). To decipher the relative importance of these forces on the evolution of CUB, mechanistic models that explicitly take into account tRNA competition and intraribosomal dynamics (13) as well as effects of amino acid substitutions on protein structure and function (42) need to be developed. As with our previous work (5), our model demonstrates the strength of such an approach and provides a natural framework for expansion to include other selective forces as well. More generally, this approach will allow us to estimate parameters underlying fundamental biological processes, such as protein translation, quantitatively and to improve our understanding of how evolutionary forces shape genomic patterns and processes.
Materials and Methods
Estimation of Δtij and μi/μj from Observed Data.
In the case of an amino acid with k codons, the change in codon frequencies across the entire range of gene expression can be determined by 2(k − 1) parameters for codon-specific mutation rates and elongation times. For instance, in the case of amino acids with two codons, the frequency of any one codon depends only on the difference in the elongation times of the two codons and the ratio of their mutation rates
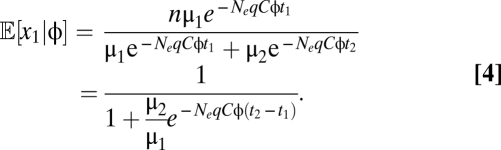 |
Codon usage in genes with low-expression φ is thought to be determined primarily by mutation biases (i.e., NeqCφ ≈ 0). Because absolute mutation rates to each codon cannot be estimated directly, as it is only their ratios that affect codon usage, we estimated μi/μj by setting the mutation rate of an arbitrarily chosen codon to 1. Codon counts in low-expression genes can then be assumed to follow a multinomial distribution with parameters determined by their mutation rates. Thus, in the case of an amino acid with two codons whose codon counts are x1 and x2, the maximum likelihood estimate of relative mutation rate is approximately
 |
Similarly, elongation times of codons affect codon usage only as their differences (t1 − t2). Thus, during parameter estimation of elongation times, we set the elongation time of an arbitrarily chosen codon within each amino acid to 1 and estimated the differences in elongation times of other codons with respect to that codon. We used the NEWUOA optimization algorithm (44), which is utilized in R to estimate Δtij and μi/μj for an amino acid with k codons and qC, by maximizing the following likelihood function (additional details are provided in SI Text, Analytical Solutions of the Model).
 |
In addition, we estimated the maximum likelihood value of 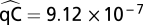 .
.
Estimation of Δtij from tRNA Gene Copy Numbers.
To compare our estimates of Δtij with an independent source of genomic information, we estimated Δtij using tRNA gene copy numbers and wobble effects. Following the work of Dong et al. (2) and Kanaya et al. (45), we use tRNA gene copy numbers in yeast obtained from GtRNAdb (46) as proxies for tRNA abundances. We assume that the expected waiting time at a codon ti is inversely proportional to its cognate tRNA abundances based on an exponential waiting process
 |
where wob is the wobble penalty attributable to codon-anticodon mismatch and a is a scaling constant. When a codon is recognized by its canonical tRNA, we set wob = 1. Based on the work of Curran et al. (47) and Curran and Lim (48), we assume a purine-purine or pyrimidine-pyrimidine wobble penalty to be 39% and a purine-pyrimidine wobble penalty to be 36%. We set the scaling constant a such that the harmonic mean of elongation rates of all codons is 10 aa per second (5, 14).
Supplementary Material
Acknowledgments
We thank J. Plotkin, B. O'Meara, F. Ubeda de Torres, I. Juric, and two anonymous reviewers for comments on the manuscript. M.A.G. thanks B. Burstein and S. Gardial for their indirect support of this work. Support for this project was provided by the Department of Ecology and Evolutionary Biology at the University of Tennessee, Knoxville; the National Institute for Mathematical and Biological Synthesis; and the Tennessee Science Alliance. P.S. received additional funding from a National Institute for Mathematical and Biological Synthesis Graduate Research Assistantship.
Footnotes
The authors declare no conflict of interest.
This article is a PNAS Direct Submission.
This article contains supporting information online at www.pnas.org/lookup/suppl/doi:10.1073/pnas.1016719108/-/DCSupplemental.
References
- 1.Ikemura T. Correlation between the abundance of Escherichia coli transfer RNAs and the occurrence of the respective codons in its protein genes: A proposal for a synonymous codon choice that is optimal for the E. coli translational system. J Mol Biol. 1981;151:389–409. doi: 10.1016/0022-2836(81)90003-6. [DOI] [PubMed] [Google Scholar]
- 2.Dong H, Nilsson L, Kurland CG. Co-variation of tRNA abundance and codon usage in Escherichia coli at different growth rates. J Mol Biol. 1996;260:649–663. doi: 10.1006/jmbi.1996.0428. [DOI] [PubMed] [Google Scholar]
- 3.Akashi H. Synonymous codon usage in Drosophila melanogaster: Natural selection and translational accuracy. Genetics. 1994;136:927–935. doi: 10.1093/genetics/136.3.927. [DOI] [PMC free article] [PubMed] [Google Scholar]
- 4.Drummond DA, Wilke CO. The evolutionary consequences of erroneous protein synthesis. Nat Rev Genet. 2009;10:715–724. doi: 10.1038/nrg2662. [DOI] [PMC free article] [PubMed] [Google Scholar]
- 5.Gilchrist MA. Combining models of protein translation and population genetics to predict protein production rates from codon usage patterns. Mol Biol Evol. 2007;24:2362–2372. doi: 10.1093/molbev/msm169. [DOI] [PubMed] [Google Scholar]
- 6.Bulmer M. The selection-mutation-drift theory of synonymous codon usage. Genetics. 1991;129:897–907. doi: 10.1093/genetics/129.3.897. [DOI] [PMC free article] [PubMed] [Google Scholar]
- 7.Akashi H, Eyre-Walker A. Translational selection and molecular evolution. Curr Opin Genet Dev. 1998;8:688–693. doi: 10.1016/s0959-437x(98)80038-5. [DOI] [PubMed] [Google Scholar]
- 8.Coleman JR, et al. Virus attenuation by genome-scale changes in codon pair bias. Science. 2008;320:1784–1787. doi: 10.1126/science.1155761. [DOI] [PMC free article] [PubMed] [Google Scholar]
- 9.Kimchi-Sarfaty C, et al. A “silent” polymorphism in the MDR1 gene changes substrate specificity. Science. 2007;315:525–528. doi: 10.1126/science.1135308. [DOI] [PubMed] [Google Scholar]
- 10.Kudla G, Murray AW, Tollervey D, Plotkin JB. Coding-sequence determinants of gene expression in Escherichia coli. Science. 2009;324:255–258. doi: 10.1126/science.1170160. [DOI] [PMC free article] [PubMed] [Google Scholar]
- 11.Tuller T, Waldman YY, Kupiec M, Ruppin E. Translation efficiency is determined by both codon bias and folding energy. Proc Natl Acad Sci USA. 2010;107:3645–3650. doi: 10.1073/pnas.0909910107. [DOI] [PMC free article] [PubMed] [Google Scholar]
- 12.Arava Y, Boas FE, Brown PO, Herschlag D. Dissecting eukaryotic translation and its control by ribosome density mapping. Nucleic Acids Res. 2005;33:2421–2432. doi: 10.1093/nar/gki331. [DOI] [PMC free article] [PubMed] [Google Scholar]
- 13.Shah P, Gilchrist MA. Effect of correlated tRNA abundances on translation errors and evolution of codon usage bias. PLoS Genet. 2010;6:e1001128. doi: 10.1371/journal.pgen.1001128. [DOI] [PMC free article] [PubMed] [Google Scholar]
- 14.Gilchrist MA, Wagner A. A model of protein translation including codon bias, nonsense errors, and ribosome recycling. J Theor Biol. 2006;239:417–434. doi: 10.1016/j.jtbi.2005.08.007. [DOI] [PubMed] [Google Scholar]
- 15.Gilchrist MA, Shah P, Zaretzki R. Measuring and detecting molecular adaptation in codon usage against nonsense errors during protein translation. Genetics. 2009;183:1493–1505. doi: 10.1534/genetics.109.108209. [DOI] [PMC free article] [PubMed] [Google Scholar]
- 16.Sharp PM, Li WH. An evolutionary perspective on synonymous codon usage in unicellular organisms. J Mol Evol. 1986;24:28–38. doi: 10.1007/BF02099948. [DOI] [PubMed] [Google Scholar]
- 17.Bennetzen JL, Hall BD. Codon selection in yeast. J Biol Chem. 1982;257:3026–3031. [PubMed] [Google Scholar]
- 18.dos Reis M, Savva R, Wernisch L. Solving the riddle of codon usage preferences: A test for translational selection. Nucleic Acids Res. 2004;32:5036–5044. doi: 10.1093/nar/gkh834. [DOI] [PMC free article] [PubMed] [Google Scholar]
- 19.Wagner A. Energy constraints on the evolution of gene expression. Mol Biol Evol. 2005;22:1365–1374. doi: 10.1093/molbev/msi126. [DOI] [PubMed] [Google Scholar]
- 20.Warner JR. The economics of ribosome biosynthesis in yeast. Trends Biochem Sci. 1999;24:437–440. doi: 10.1016/s0968-0004(99)01460-7. [DOI] [PubMed] [Google Scholar]
- 21.Kurland C. Strategies for efficiency and accuracy in gene expression. Trends Biochem Sci. 1987;12:126–128. [Google Scholar]
- 22.Lovmar M, Ehrenberg M. Rate, accuracy and cost of ribosomes in bacterial cells. Biochimie. 2006;88:951–961. doi: 10.1016/j.biochi.2006.04.019. [DOI] [PubMed] [Google Scholar]
- 23.Hershberg R, Petrov DA. Selection on codon bias. Annu Rev Genet. 2008;42:287–299. doi: 10.1146/annurev.genet.42.110807.091442. [DOI] [PubMed] [Google Scholar]
- 24.Plotkin JB, Kudla G. Synonymous but not the same: The causes and consequences of codon bias. Nat Rev Genet. 2011;12:32–42. doi: 10.1038/nrg2899. [DOI] [PMC free article] [PubMed] [Google Scholar]
- 25.Akashi H. Translational selection and yeast proteome evolution. Genetics. 2003;164:1291–1303. doi: 10.1093/genetics/164.4.1291. [DOI] [PMC free article] [PubMed] [Google Scholar]
- 26.MacArthur R, Wilson E. The Theory of Island Biogeography. Princeton: Princeton Univ Press; 1967. [Google Scholar]
- 27.Wright S. Evolution of the Genetics of Population. The Theory of Gene Frequencies. Vol 2. Chicago: Univ of Chicago Press; 1969. [Google Scholar]
- 28.Gavrilets S. Fitness Landscapes and the Origin of Species: Monographs in Population Biology. Vol 41. Princeton: Princeton Univ Press; 2004. [Google Scholar]
- 29.Sella G, Hirsh AE. The application of statistical physics to evolutionary biology. Proc Natl Acad Sci USA. 2005;102:9541–9546. doi: 10.1073/pnas.0501865102. [DOI] [PMC free article] [PubMed] [Google Scholar]
- 30.Beyer A, Hollunder J, Nasheuer HP, Wilhelm T. Post-transcriptional expression regulation in the yeast Saccharomyces cerevisiae on a genomic scale. Mol Cell Proteomics. 2004;3:1083–1092. doi: 10.1074/mcp.M400099-MCP200. [DOI] [PubMed] [Google Scholar]
- 31.Arava Y, et al. Genome-wide analysis of mRNA translation profiles in Saccharomyces cerevisiae. Proc Natl Acad Sci USA. 2003;100:3889–3894. doi: 10.1073/pnas.0635171100. [DOI] [PMC free article] [PubMed] [Google Scholar]
- 32.MacKay VL, et al. Gene expression analyzed by high-resolution state array analysis and quantitative proteomics: Response of yeast to mating pheromone. Mol Cell Proteomics. 2004;3:478–489. doi: 10.1074/mcp.M300129-MCP200. [DOI] [PubMed] [Google Scholar]
- 33.Duret L, Mouchiroud D. Expression pattern and, surprisingly, gene length shape codon usage in Caenorhabditis, Drosophila, and Arabidopsis. Proc Natl Acad Sci USA. 1999;96:4482–4487. doi: 10.1073/pnas.96.8.4482. [DOI] [PMC free article] [PubMed] [Google Scholar]
- 34.Bulmer M. Are codon usage patterns in unicellular organisms determined by selection-mutation balance? J Evol Biol. 1988;1:15–26. [Google Scholar]
- 35.Sharp PM, Devine KM. Codon usage and gene expression level in Dictyostelium discoideum: Highly expressed genes do ‘prefer’ optimal codons. Nucleic Acids Res. 1989;17:5029–5039. doi: 10.1093/nar/17.13.5029. [DOI] [PMC free article] [PubMed] [Google Scholar]
- 36.Musto H, Romero H, Zavala A. Translational selection is operative for synonymous codon usage in Clostridium perfringens and Clostridium acetobutylicum. Microbiology. 2003;149:855–863. doi: 10.1099/mic.0.26063-0. [DOI] [PubMed] [Google Scholar]
- 37.Peixoto L, Fernández V, Musto H. The effect of expression levels on codon usage in Plasmodium falciparum. Parasitology. 2004;128:245–251. doi: 10.1017/s0031182003004517. [DOI] [PubMed] [Google Scholar]
- 38.Gromadski KB, Rodnina MV. Kinetic determinants of high-fidelity tRNA discrimination on the ribosome. Mol Cell. 2004;13:191–200. doi: 10.1016/s1097-2765(04)00005-x. [DOI] [PubMed] [Google Scholar]
- 39.Drummond DA, Bloom JD, Adami C, Wilke CO, Arnold FH. Why highly expressed proteins evolve slowly. Proc Natl Acad Sci USA. 2005;102:14338–14343. doi: 10.1073/pnas.0504070102. [DOI] [PMC free article] [PubMed] [Google Scholar]
- 40.Drummond DA, Wilke CO. Mistranslation-induced protein misfolding as a dominant constraint on coding-sequence evolution. Cell. 2008;134:341–352. doi: 10.1016/j.cell.2008.05.042. [DOI] [PMC free article] [PubMed] [Google Scholar]
- 41.Markiewicz P, Kleina LG, Cruz C, Ehret S, Miller JH. Genetic studies of the lac repressor. XIV. Analysis of 4000 altered Escherichia coli lac repressors reveals essential and non-essential residues, as well as “spacers” which do not require a specific sequence. J Mol Biol. 1994;240:421–433. doi: 10.1006/jmbi.1994.1458. [DOI] [PubMed] [Google Scholar]
- 42.Guo HH, Choe J, Loeb LA. Protein tolerance to random amino acid change. Proc Natl Acad Sci USA. 2004;101:9205–9210. doi: 10.1073/pnas.0403255101. [DOI] [PMC free article] [PubMed] [Google Scholar]
- 43.Qin H, Wu WB, Comeron JM, Kreitman M, Li WH. Intragenic spatial patterns of codon usage bias in prokaryotic and eukaryotic genomes. Genetics. 2004;168:2245–2260. doi: 10.1534/genetics.104.030866. [DOI] [PMC free article] [PubMed] [Google Scholar]
- 44.Powell MJD. The NEWUOA software for unconstrained optimization without derivatives. In: Di Pillo G, Roma M, editors. Large-Scale Nonlinear Optimization. New York: Springer; 2006. pp. 255–297. [Google Scholar]
- 45.Kanaya S, Yamada Y, Kudo Y, Ikemura T. Studies of codon usage and tRNA genes of 18 unicellular organisms and quantification of Bacillus subtilis tRNAs: Gene expression level and species-specific diversity of codon usage based on multivariate analysis. Gene. 1999;238:143–155. doi: 10.1016/s0378-1119(99)00225-5. [DOI] [PubMed] [Google Scholar]
- 46.Chan PP, Lowe TM. GtRNAdb: A database of transfer RNA genes detected in genomic sequence. Nucleic Acids Res. 2009;37(Database issue):D93–D97. doi: 10.1093/nar/gkn787. [DOI] [PMC free article] [PubMed] [Google Scholar]
- 47.Curran JF, Yarus M. Rates of aminoacyl-tRNA selection at 29 sense codons in vivo. J Mol Biol. 1989;209:65–77. doi: 10.1016/0022-2836(89)90170-8. [DOI] [PubMed] [Google Scholar]
- 48.Lim VI, Curran JF. Analysis of codon:anticodon interactions within the ribosome provides new insights into codon reading and the genetic code structure. RNA. 2001;7:942–957. doi: 10.1017/s135583820100214x. [DOI] [PMC free article] [PubMed] [Google Scholar]
Associated Data
This section collects any data citations, data availability statements, or supplementary materials included in this article.