

Abstract
Immunological synapses are specialized intercellular contacts formed by several types of immune cells in contact with target cells or antigen-presenting cells. A late-stage immune synapse is commonly a bulls-eye pattern of immune cell receptor-ligand pairs surrounded by integrin complexes. Based on crystal structures, the intermembrane distance would be ∼15 nm for many immune cell receptor-ligand pairs, but ∼40 nm for integrin-ligand pairs. Close proximity of these two classes of intermembrane bonds would require significant membrane bending and such proteins can segregate according to their size, which may be key for receptor triggering. However, tools available to evaluate the intermembrane organization of the synapse are limited. Here, we present what we believe to be a novel approach to test the importance of size in the intercellular organization of proteins, using live-cell microscopy of a size-series of fluorescently-labeled molecules and quantum dots to act as molecular rulers. Small particles readily colocalized at the synapse with MHC class I bound to its cognate natural killer cell receptor, whereas particles larger than 15 nm were increasingly segregated from this interaction. Combined with modeling of the partitioning of the particles by scaled-particle adsorption theory, these molecular rulers show how membrane-bending elasticity can drive size-dependent exclusion of proteins within immune synapses.
Introduction
When receptors on one cell bind to ligands on another cell across a synapse or tight intercellular contact, minimization of membrane-curvature free energy may be sufficient to segregate receptor-ligand complexes that span different lengths. This segregation of integral membrane proteins based on the size of their extracellular domains has been suggested to play a key role in the spatial organization and signaling of immune cell receptors (1,2).
Immune synapses are specialized cell-cell contacts involving many immune cell-types, including T cells, B cells, and natural killer (NK) cells. Immune synapses typically have an area of a few tens of square micrometers, and although their structure may vary (3,4), the prototypical mature or late-stage immune synapse has a concentric ring-shaped organization, where the immune receptor-ligand complexes which have short extracellular domains accumulate in the central region and the longer integrin complexes accumulate around this (1). The complexes of many immune cell receptors bound to their ligands on the target cell—such as complexes of T cell receptor with peptide-loaded major histocompatibility complex proteins (pMHC), Killer immunoglobulin-like receptors (KIR) with pMHC, and natural killer cell receptor D with MHC class I polypeptide-related sequence A—have an extracellular span of ∼10–15 nm whereas complexes formed by integrins have longer extracellular dimensions of ∼40 nm (1,5,6). It remains unclear, however, to what extent size-dependent segregation of proteins occurs at immune synapses and over what length-scale. Although some results suggest that the large-scale segregation of differently-sized protein-protein interactions can occur in the absence of functional actin polymerization in NK cells (7,8), the coupling of receptors to the actin cytoskeleton in T cells is crucial for the formation of the concentric synapse structure and central location of some receptors (9,10).
Small receptor-ligand pairs favoring a narrow synaptic cleft are also expected to segregate from unbound proteins with large extracellular domains such as CD43 and the phosphatase CD45 (2). The kinetic-segregation hypothesis suggests that immune cells become activated when the ligated receptors become segregated from large phosphatases, resulting in a shift in the balance between the local kinetics of receptor phosphorylation and dephosphorylation (2,11).
The impetus for this study was that despite the potential importance of size-dependent exclusion in immune cell biology, the experimental tools to address it—particularly in cell-cell conjugates—were severely limited. So far, perhaps the most successful approach employed to study the role of size exclusion in immune synapses and immune cell signaling involves using protein constructs whose extracellular parts have been elongated or truncated (12–15): it has demonstrated that protein elongation can drive spatial segregation (14,16). This method can also determine whether altering the size of proteins affects signaling. However, the creation and characterization of the constructs and transfected cell lines is cumbersome.
Other methods used previously have limitations. One limitation of many previous methods is that they commonly report on the intermembrane distance over a relatively long spatial-scale, rather than directly testing the extent of segregation between differently sized molecules. This is a limitation in the context of testing the kinetic-segregation hypothesis, because the extent of membrane-elasticity-mediated segregation will depend not only on the preferred intermembrane distances of the receptor-ligand complexes and but also on the relative abundances of the proteins and the local membrane-bending modulus and spontaneous curvature. If a tension-free membrane had no resistance to bending (zero-bending modulus), there would be no free energy penalty for packing the proteins next to each other—whatever their length difference.
In this case, the membrane would just bend, over a nanometer-scale length, to accommodate the proteins. Similarly, the free energy is affected if membrane heterogeneity leads to nanoscale domains, e.g., membrane invaginations or small protrusions that could accommodate longer pairs of proteins close to shorter ones. Thus, although the length difference of protein complexes is the driving factor, the extent of protein-segregation by size is also defined by local membrane properties which may vary on a nanometer-scale. In addition, FRET-based approaches can only probe short intermembrane separations as these measurements are limited by the Förster radii of the probe pairs (typically <10 nm) (17), and, more importantly, FRET-based approaches require assumptions about the geometry and distribution of fluorophores which are difficult to verify in complex systems such as intercellular conjugates. Perhaps most importantly, probes initially located in opposing cell membranes may swap between cells, which would hamper the interpretation of results (18).
Reflection or fluorescence interference contrast microscopy can probe intermembrane distance in planar, well-defined geometries, such as the interface formed between cells and protein-rich supported lipid bilayers (1). Unfortunately, this method cannot easily be extended to cell-cell conjugates. In addition, supported lipid bilayer-based systems may produce results that are quantitatively different from those of a synapse between two cells because the supported bilayer typically adheres to the glass support and only the free bilayer of the cell can readily bend to accommodate individual proteins or receptor-ligand pairs of different sizes (see, for example, Das et al. (19), and discussion therein; see also Appendix S2 in the Supporting Material for an example of expected differences). Electron microscopy has sufficient spatial resolution to analyze membrane organization, and it has been applied to immune synapses (12,16) and neuronal synapses (20), but it cannot yet be applied to live cells, and artifacts resulting from sample preparation are difficult to avoid.
Here, we present what we believe to be a new approach to assessing size-dependent organization of immune synapses using a range of fluorescent particles that are the same order of magnitude in size as receptor-ligand interactions in immune synapses. Advantages of this method include that the fluorescent particle size can be easily varied on a nanometer-scale. This approach can be applied to intercellular conjugates as well as model systems, and it reports directly on size-dependent partitioning and thus includes possible effects from local variation of membrane-bending modulus and spontaneous curvature, unlike intermembrane distance measurements. Our results demonstrate that increasing the fluorescent particle diameter beyond the size of KIR/HLA-Cw6 causes increased exclusion from where this receptor/ligand pair accumulates at the human NK cell immune synapse. To our knowledge, these data provide new evidence for the mechanism of size-dependent organization of proteins within immune synapses, which in turn may have important consequences for understanding the mechanism of immune receptor signaling and signal integration.
Materials and Methods
Size series of dye-conjugated proteins and fluorescent particles
Wild-type tetravalent streptavidin conjugated to Alexa Fluor 405 was obtained from Invitrogen (Carlsbad, CA). IF2-streptavidin (IF2-SA) consists of a domain of the Escherichia coli translation initiation factor IF2 fused to the N-terminus of streptavidin and was expressed in E. coli, yielding a tetravalent tetramer. IF2-SA was purified via its C-terminal His6 tag using Ni-NTA, as described in Sørensen et al. (21). IF2-SA was dye-labeled using Alexa Fluor 555 succinimidyl ester (Invitrogen) according to manufacturer's instructions. CdSe/ZnS core-shell quantum dots (Qdot605 ITK, Invitrogen) were ligand-exchanged with a linker consisting of dihydrolipoic acid (DHLA) with a poly(ethylene glycol) (PEG) spacer of eight units and a terminal amine (20%) or hydroxyl group (80%), synthesized and purified as described in Liu et al. (22). Monovalent streptavidin (mSA) was expressed and purified as previously described (23,24). The mSA was conjugated to QDs via a His-tag by incubating a fourfold molar excess with QDs for 1 h at 25°C (22,25), termed here DHLA-PEG-QD or Qdot605S. Streptavidin-coated Qdot605 or Qdot585 were both from Invitrogen.
Dynamic light scattering
Dynamic light scattering was performed using a Viscotek 802 (Malvern Instruments, Malvern, Worcestershire, UK). All samples and buffers were filtered through a Nanosep 0.2-μm filter (Pall Corporation, Port Washington, NY) before analysis. Typical count rates were 100–300 kHz. Each autocorrelation function was acquired for 10 s, and averaged for 10 measurements. The resulting autocorrelation function was fitted using OmniSize 3.0 software (Malvern Instruments). Data were fit using the autocorrelation function data between 10−6 s and 10 s, with dextran as a mass model. Hydrodynamic diameters were obtained from a mass-weighted size distribution analysis and reported as the mean of triplicate measurements. Dynamic light scattering measurements were performed in phosphate-buffered saline (PBS) (pH 7.4) for proteins and in 50 mM sodium borate buffer (pH 8.3) for QDs.
Cells
The human NK lymphoma cell line YT subclone YTS transfected to express KIR2DL1 (YTS/KIR2DL1) (26) was used as a model NK cell for immune synapse formation with target cells. Human B-cell lymphoma-derived cell line 721.221 (221) (27) transfected to express HLA-Cw6-GFP (221/Cw6-GFP) was used as described previously (7). Cell line 221 expressing ICAM-1-GFP (221/ICAM-1-GFP) were generated by electroporation of 221 (Microporator; Invitrogen) with the plasmid pEGFP-N1-ICAM-1-EGFP, and selected using 1.0 mg/ml G418 for three weeks before cloning by limited dilution. All cells were grown in RPMI medium containing 10% fetal calf serum, 50 U/ml penicillin, and 50 μg/ml streptomycin.
HLA-Cw6-GFP expression level of the cells
The numbers of protein molecules expressed by the transfectants were estimated by staining with labeled antibody and calibration of the number of bound antibodies using standard beads with a defined number of binding sites for mouse IgG (Quantum Simply Cellular; Bangs Laboratories, Fishers, IN), as described previously (8). HLA numbers were determined by staining with Cy5-labeled anti-HLA mAb (clone W6/32), and ICAM-1 numbers by Cy5-labeled anti-ICAM-1 mAb (a kind gift of Leo Carlin, Kings College London). The mean number of surface molecules expressed by the cells was estimated by fluorescence-activated cell sorting, and then set to equal the mean of membrane-associated GFP fluorescence intensity.
Labeling cells with the fluorescent size-series
For labeling of cells, 24 μM ammonium salt of 1,2-distearoyl-sn-glycero-3-phosphoethanolamine-n-[biotinyl(polyethylene glycol)-2000] (DSPE-PEG2k-biotin; Avanti Polar Lipids, Alabaster, AL) in serum-free RPMI was prepared using a protocol slightly modified from that previously described (28). Briefly, appropriate volume of stock solution in CHCl3 was dried in a test tube, and the residue was dissolved in dimethylformamide (0.5% of the final volume), with serum-free RPMI added to give the desired concentration, and extensive vortexing combined with incubation at 60°C for 1 h was followed by a brief (2–3 min) sonication in a bath sonicator. The resulting solution was stored at 4°C, always for less than a week, before use.
Cells were collected by centrifugation, and the resulting pellet was washed once with serum-free RPMI before resuspending the cells in the DSPE-PEG2k-biotin solution at a density of 2.0 × 10⁷ cells/ml in 100 μL volume. Cells were briefly vortexed and then kept in DSPE-PEG2k-biotin solution in an incubator for 45 min (with brief vortexing twice during this time) before cells were pelleted, and washed once with serum-free RPMI and once with Dulbecco's phosphate-buffered saline (PBS) without Ca2+ or Mg2+. The quantum dot and streptavidin-labeling solutions were prepared in Dulbecco's PBS containing 1% biotin-free bovine serum albumin (previously dialyzed against PBS to remove traces of free biotin); the dye concentrations were 50 nM for quantum dots and 67 μg/ml for streptavidin. A quantity of 30 μL of labeling solution was applied to cells from the previous step (with cell density of 6.7 × 10⁷/ml). Cells were incubated in labeling solutions on ice for 8–10 min and vortexed once before and twice during the incubation. Cells were then pelleted, and washed once with Dulbecco's PBS, resuspended in Dulbecco's PBS, and counted using a hemocytometer.
Killing assay
NK cell cytotoxicity against different target cells was assessed using standard 35S-Met release assays (29) performed in triplicate.
Imaging
For imaging, 1–2 × 10⁵ (labeled) YTS/KIR2DL1 cells and an equal number of (labeled) 221/Cw6-GFP or 221/ICAM-1-GFP cells were mixed, pelleted, and resuspended in 120 μL RPMI medium that was then spread onto an eight-well chambered cover glass (Lab-Tek II; Nalge-Nunc International, Rochester, NY). Cells were imaged by confocal microscopy (TCS SP5 RS; Leica, Wetzlar, Germany) using a 63× water-immersion objective (NA 1.33) and a 405-nm laser line for excitation of Alexa-Fluor-405 and Qdot585, 488 nm for GFP and other quantum dots, and 543 nm for Alexa-555. All imaging was done in sequential mode with relatively narrow emission bandpasses to avoid bleedthrough. The stacks were collected with spatial sampling frequencies ≈1/210 nm−1 in the vertical direction and ≈1/105 nm−1 in the horizontal directions.
Image analysis
See additional Material and Methods text and Fig. S1, Fig. S2, and Fig. S3 in the Supporting Material.
Statistical testing
One-way ANOVA and post hoc tests were used as noted (MATLAB, The MathWorks, Natick, MA). The significance level α = 0.01 was used for ANOVA and α = 0.05 for post hoc tests, and p-values in post hoc tests were evaluated based on the Tukey-Kramer criterion.
Results and Discussion
NK cell activation is regulated by a balance of activating and inhibitory signals through a multitude of germ-line encoded receptors which recognize ligands expressed on the surface of other cells (30). These receptor/ligand pairs organize in specific supramolecular arrangements at the intercellular contact or immune synapse. For this study we used, as a well-defined model system, the human NK cell line YTS transfected to express the inhibitory NK cell receptor KIR2DL1 (YTS/KIR2DL1) and for the target cell, the B cell line 721.221 transfected to express the cognate class I MHC protein HLA-Cw6 tagged with GFP (221/Cw6-GFP). A series of fluorescent particles of different sizes and colors were then prepared, to vary around the predicted size of the extracellular portion of class I MHC protein bound to its cognate NK cell receptor, KIR2DL1, i.e., ∼15 nm (31). The hydrodynamic diameters of the particles were determined by light scattering measurements to be 5.9 nm for streptavidin-Alexa (SA), 10.6 nm for IF2-streptavidin-Alexa555 (IF2-SA), 15.4 nm for the small Qdot605S (DHLA-PEG-QD), 18.6 nm for Qdot585, 21.2 nm for Qdot605, and 23.4 nm for Qdot655 (Fig. S4). Fig. 1 shows a schematic representation of the relative particle dimensions. The largest fluorescent particle, Qdot655, did not influence cytolysis of 221/Cw6-GFP cells by YTS or YTS/KIR2DL1 cells (Fig. S5), confirming that the fluorescent particle does not interfere with NK cell activation or inhibition.
Figure 1.
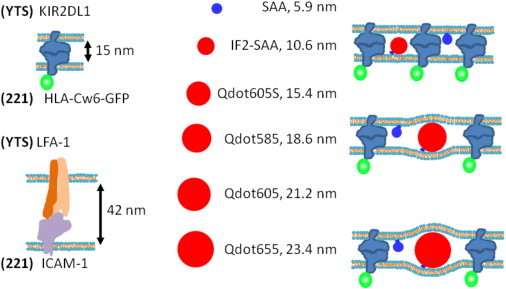
Schematic representation of the dimensions of the fluorescent size series and the synapse. The color of the fluorescent particle (and GFP) shows the respective color channel in the merged microscope images. (Right) The membrane curvature defect (or the lack of it) required to accommodate the fluorescent particle in the KIR2DL1-HLA-Cw6-GFP-rich region is shown schematically for 10.6, 18.6, and 23.4 nm fluorescent particles. Because all the particles are smaller than the extracellular length of the integrin LFA-1 ligated to ICAM-1, based on fundamental physical principles, the particles that require a curvature defect to fit in the region of ligated KIR2DL1-HLA-Cw6 should partition to a greater extent in the integrin-rich peripheral zone of the synapse as compared to the central zone rich in KIR2DL1-HLA-Cw6.
Partitioning of the fluorescent particle size-series
The cells were labeled with a biotinylated lipid, which was then bound by streptavidin-conjugated fluorescent particles, as described in Materials and Methods, above. In most cases, the streptavidin-Alexa405 (SA, always shown in the blue image channel) was attached to the surface membranes of YTS/KIR2DL1 and other fluorescent particles (always shown in the red image channel) were attached to the surface membranes of 221/Cw6-GFP (Fig. 2, A–E). To check that results were not dependent upon which cell was labeled by each quantum dot, we also used staining the opposite way round, i.e., with SA on 221/Cw6-GFP membranes and the largest particle (Qdot655) on the YTS/KIR2DL1 cells (Fig. 2 F). The two cell types were mixed at 1:1 ratio, incubated for 30 min before commencing the imaging, and then the chambers were scanned for the presence of synapses.
Figure 2.
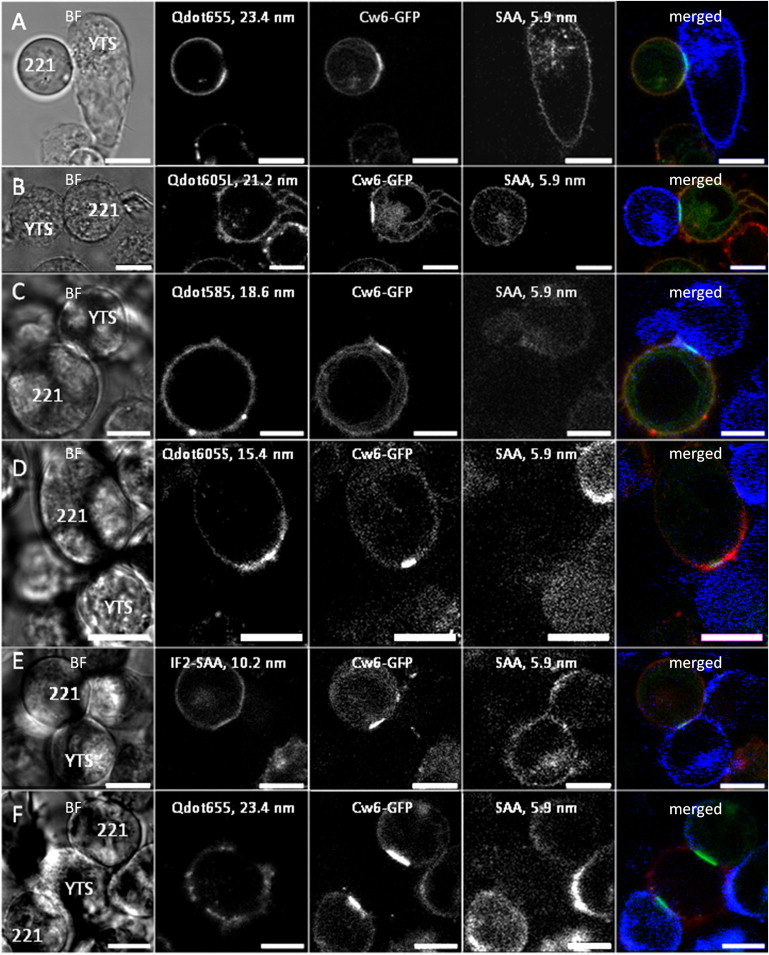
Largest fluorescent particles do not penetrate the HLA-Cw6-GFP-rich central zone of the synapse. Example images of immune synapses formed between NK cells and target cells stained with different-sized fluorescent particles are shown. The channels are shown in the order: bright-field (BF), red channel (larger fluorescent particle), green channel (HLA-Cw6-GFP), blue channel (streptavidin-Alexa, SA), and the merged fluorescence channels. The brightness and contrast were adjusted to increase the visibility in the printed format. In series A–E, the 5.9-nm fluorescent particle (SA) is on YTS/KIR2DL1 cells and the particle on the 221/Cw6-GFP cell has diameter 23.4 nm (A), 21.2 nm (B), 18.6 nm (C), 15.4 nm (D), and 10.6 nm (E). (F) The 5.9-nm fluorescent particle (SA) is on the 221/Cw6-GFP cell and the 23.4-nm fluorescent particle is on the YTS/KIR2DL1 cell. Scale bars = 10 μm.
A series of optical slices throughout all synapses were collected and analyzed to test for the partitioning of the differently-sized fluorescent particles between the HLA-Cw6-GFP-rich clusters and the rest of the synapse. By simply looking at images of conjugates between YTS/KIR2DL1 and 221/Cw6-GFP, it was very clear that the two largest fluorescent particles were significantly excluded from the HLA-Cw6-GFP-rich clusters, whereas the smaller fluorescent particles were not excluded (Fig. 2, A–E). For example, Alexa-labeled streptavidin (d = 5.9 nm) readily penetrated the synapse whereas the larger Qdot655 fluorescent particle (d = 23.4 nm) was excluded from the synapse (Fig. 2, A and F), irrespective of the type of the cell the particles resided on.
To quantify differences in the location of differently sized fluorescent particles across many synapses, we calculated the correlation coefficient between the particle fluorescence intensity and HLA-Cw6-GFP. For each synapse, average correlation coefficients across several Z (or optical) slices were used (see Materials and Methods: Image Analysis, and Fig. S1, both in the Supporting Material). This analysis reveals that the correlation coefficient of fluorescent particle/GFP fluorescence intensity for the largest particles is significantly less than for smaller particles (Fig. 3 A). We also calculated the ratio of fluorescence intensity for each fluorescent particle in the central region where GFP accumulated and elsewhere in the synapse. This ratio of intensities was clearly lower for the larger fluorescent particles, further indicating their exclusion from the regions where GFP-tagged class I MHC protein accumulated (Fig. 3 B).
Figure 3.
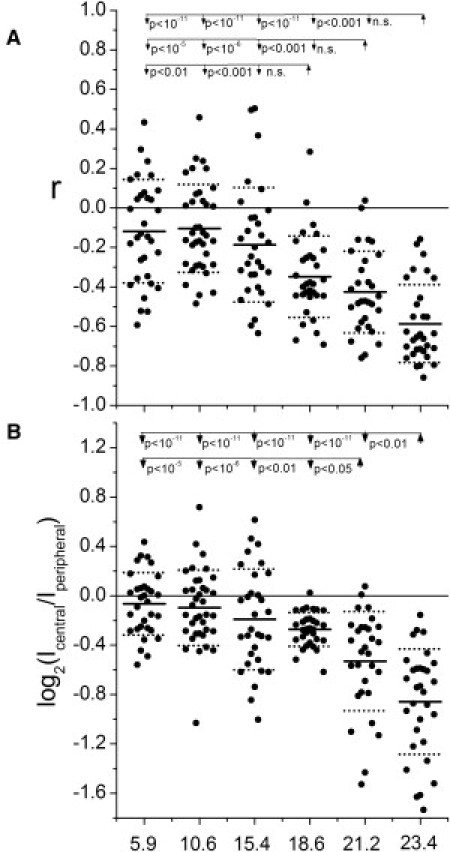
Large fluorescent particles are excluded from Cw6-GFP-rich regions. The correlation coefficients (A) and ratios of fluorescence intensity at the central/peripheral regions of the synapse (i.e., Cw6-GFP-rich/Cw6-GFP-poor) (B) for the individual synapses are shown (black circles) for different-sized fluorescent particles (as indicated) tethered to the surface of 221/Cw6-GFP cells. The N numbers (left to right) are 32, 37, 31, 32, 30, and 31. The ANOVA p-values for testing if all the values with the different fluorescent particles could represent sampling from a single distribution were zero within the numerical precision of computing in MATLAB for both sets of data (A and B). The post hoc test p-values compared to smaller particles are shown for fluorescent particles that had statistically significant differences to any of the smaller fluorescent particles.
Immune synapse characteristics
We determined the ratio of HLA-Cw6-GFP in the central/peripheral zone of the synapse, the synapse area, and the fraction of the synapse occupied by HLA-Cw6-GFP. Although a few statistically significant differences were seen, none of these parameters changed systematically in the presence of fluorescent particles, confirming that the fluorescent particles did not induce any significant, systematic changes in synapse organization (Fig. S6).
Fluorescent particle partitioning is independent of the cell type to which particles are tethered
We next analyzed if the cell on which the nanoparticle is initially tethered to affects the nanoparticle's partitioning between the HLA-Cw6-GFP-rich central zone of the synapse and the HLA-Cw6-GFP-poor peripheral zone. Comparison of YTS/KIR2DL1 and 221/Cw6-GFP cells labeled with either streptavidin-Alexa405 (the smallest fluorescent particle, 5.9 nm) or Qdot655 (the largest fluorescent particle, 23.4 nm) showed no statistically significant differences in partitioning for the same type of fluorescent particle on different cells, which supported a generic physical basis of fluorescent particle partitioning (Fig. 4).
Figure 4.
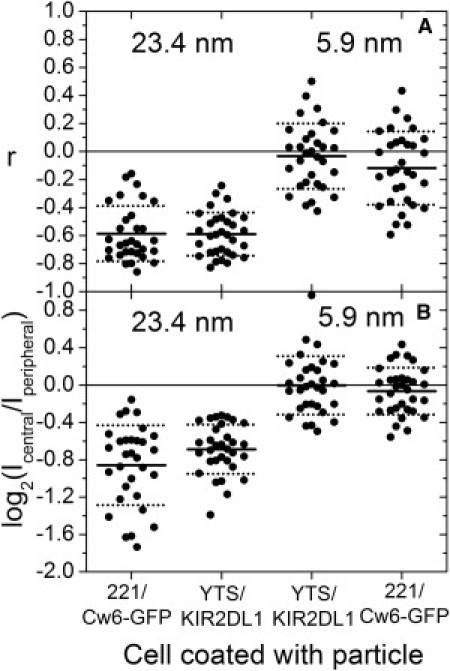
Fluorescent particle partitioning is unaffected by the cell type on which fluorescent particles reside. The comparison of fluorescent particle to Cw6-GFP correlation coefficients (A) and fluorescent particle central/peripheral intensity ratios (B) for the largest (Qdot655 (23.4 nm); left) and smallest (SA (5.9 nm); right) fluorescent particles on 221/Cw6-GFP and YTS/KIR2DL1 cells showed no statistically significant differences. The number of synapses (N) for 221/Cw6-GFP-Qdot655-YTS/KIR2DL1-SA is 31, and it is 32 for 221/Cw6-GFP-SA-YTS/KIR2DL1-Qdot655.
Correlation of fluorescence intensities between fluorescent particles and ICAM-1-GFP
An important prediction of size-dependent organization of proteins in the immune synapse is that the integrin interaction between LFA-1 and ICAM-1 should span a larger synaptic cleft than the KIR2DL1/HLA-Cw6 interaction. Thus, we next tested the fluorescent particle/GFP intensity correlations in conjugates of YTS/KIR2DL1 cells and 721.221 cells transfected to express ICAM-1-GFP (221/ICAM-1-GFP). In conjugates between 221/ICAM-1-GFP and YTS/KIR2DL1, ICAM-1-GFP did not preferentially accumulate in either the periphery or center of these lytic synapses but instead was fairly homogeneously accumulated across the synapse (Fig. S7). Nevertheless, analysis showed that fluorescent particles were not at all excluded from ICAM-1-GFP-enriched regions, as evaluated from the correlation coefficients (Fig. S8).
Mechanisms of fluorescent particle exclusion from the HLA-Cw6-GFP-rich central clusters
Two (related) effects may contribute to the partitioning of fluorescent particles between the central and peripheral zones of synapse. The first is the membrane-curvature free energy cost of a local membrane curvature defect—a bump or dimple—that is required to fit a large fluorescent particle amid the receptor-ligand pairs with shorter combined length of their extracellular domains (schematically represented in Fig. 5 A). This requirement results in repulsion between the fluorescent particle and the receptor-ligand pair. This membrane-bending elasticity-mediated interaction would not affect particles smaller than 15 nm, would to some extent exclude particles only slightly larger than 15 nm, and would strongly exclude particles of greater size (see schematic curve in Fig. 5 A; see Appendix S2 in the Supporting Material for the calculation of the schematic curve).
Figure 5.
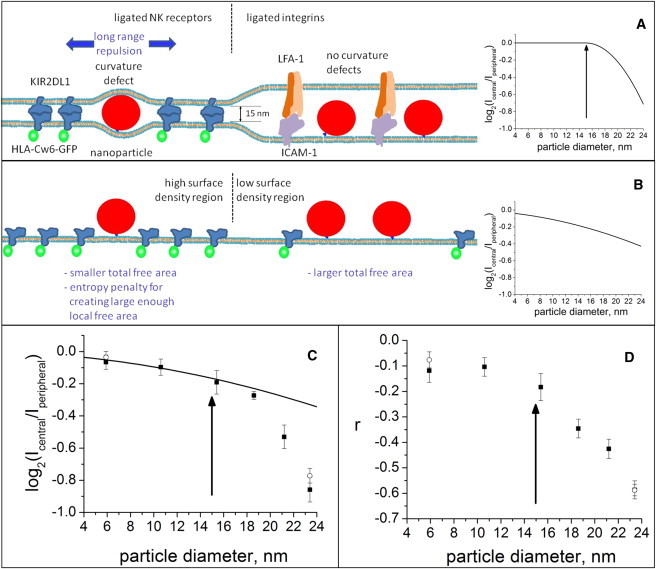
Effects of membrane-bending elasticity and lateral crowding on fluorescent particle partitioning between the central HLA-Cw6-GFP-rich and peripheral HLA-Cw6-GFP-poor domains. (A) In the case of bending elasticity-mediated repulsion, particles larger than 15 nm will cause a curvature defect in the membranes in the central zone, and hence no bending-mediated exclusion is expected to take place for smaller particles (a schematic representation of expected log2([central]/[peripheral]) versus fluorescent particle diameter is on the right), whereas after 15 nm (arrow) the larger fluorescent particles are expected to become increasingly strongly excluded. (B) In the case of lateral crowding-related exclusion (schematic illustration on the left), the fluorescent particles are expected to become increasingly excluded with increasing diameter (a schematic representation of expected log([central]/[peripheral]) versus fluorescent particle diameter is on the right) and a 15-nm particle diameter is expected to have no special significance. Note that in an actual synapse these mechanisms occur together, as the surface density of receptor-ligand complexes affects the lateral dimensions of the curvature defect. (C) The mean of base 2 logarithm of the central/peripheral fluorescent particle intensity ratios (mean ± SE) from the data sets shown in Fig. 3 and Fig. 4 are plotted against fluorescent particle diameter. (Solid squares) Data for fluorescent particles on 221/Cw6-GFP cells only (Fig. 3 data). (Open circles) Data for fluorescent particles on both 221/Cw6-GFP and YTS/KIR2DL1 cells (Fig. 3 and Fig. 4 data combined). (Continuous line) Prediction from scaled particle theory for lateral-crowding-mediated exclusion of fluorescent particles (see scheme in panel B). Note that the model does not include a single adjustable parameter. (Arrow) Point where membrane-bending-mediated exclusion is expected to begin to affect the partitioning of the fluorescent particle, and hence the data is expected to begin to deviate from lateral-crowding-based scaled particle theory prediction. (D) The mean correlation coefficient (mean ± SE) from the data set shown in Fig. 3 plotted against fluorescent particle radius. (Arrow) Fluorescent particle diameter where the correlation coefficient is expected to begin to decrease for membrane-bending-mediated exclusion. The symbols are as in panel C.
The second contribution to fluorescent particle organization is lateral crowding by receptor-ligand pairs that can sterically hinder the accumulation of fluorescent particles (Fig. 5 B). For this effect, when there is a low surface concentration of membrane-attached fluorescent particles, the partitioning of the fluorescent particles into the synapse is related to the probability of finding a lateral free area large enough to accommodate the fluorescent particle. This effect is considered in scaled particle adsorption theory (32,33) that models the interactions on the surface as a two-dimensional fluid of different-sized hard core disks. For this effect 15 nm plays no special importance, though increased exclusion with increasing particle size is expected (schematic in Fig. 5 B). Both effects will operate concurrently because tight packing of particular receptor-ligand interactions will also strongly drive the membrane shape in a particular synapse region. Thus, for the larger fluorescent particles the membrane-bending-mediated repulsion in the synapse center will add to the short-ranged crowding effect. In keeping with this, the data we present here does contain features of both effects (Fig. 5 C).
To more carefully test the extent that lateral crowding influenced the location of fluorescent particles, we compared our results to a theoretical prediction. As a first approximation, we consider the receptor/ligand pairs and fluorescent particles to be circular disks and consider only HLA-Cw6-GFP to contribute significantly to crowding. With the further assumption that the surface density of the fluorescent particles is low, the formula for the expected distribution of fluorescent particles between the receptor ligand-rich and receptor/ligand-poor zones of the synapse can be easily obtained from Chatelier and Minton (32) (see the Supporting Material for the derivation of Eq. 1) as
| (1) |
where RNP and RCw6 are the central/peripheral ratios for the fluorescent particle and HLA-Cw6-GFP, respectively; ΦCw6 is the area fraction occupied by HLA-Cw6-GFP in the peripheral zone, ΦCw6 = ΓCw6π(rCw6)2, i.e., the number density of HLA-Cw6-GFP/area multiplied by the area of an HLA-Cw6-GFP molecule; and fD is the ratio of the diameters of the fluorescent diameter and HLA-Cw6-GFP. Based on our data, the ratio of HLA-Cw6-GFP in the central to peripheral zone, i.e., RCw6, is on average 2.57 (2.52–2.62), the number density ΓCw6 of receptors in the peripheral zone of the synapse is ∼210/μm2 (180–240), and using the crystal structure of KIR2DL1-HLA-Cw4 complex (5) the transverse projection diameter of the extracellular domain of KIR2DL1-HLA-Cw6-GFP complex (2 × rCw6) may be approximated to be 5.7 nm (5.0–6.4 nm). The line in Fig. 5 C shows the mean estimate. Note that this line is not a fit to any part of the data, but merely reflects the theoretically expected relationship between particle size and partitioning into the central and peripheral synapse regions, driven by lateral crowding.
Importantly, this simple model for lateral crowding predicts the data well for particles up to 15.4 nm (see Fig. 5 C). Data for larger particles deviates increasingly from the prediction with increasing particle size. Allowing the diameter of HLA-Cw6-GFP, the number density of HLA-Cw6-GFP, or both of them to be freely adjustable parameters does not allow Eq. 1 to fit the data (Fig. S9). Crucially, the point at which the simulated line deviates from the data is exactly the point at which the effect of membrane bending would be expected to become apparent (Fig. 5) based on the size of the extracellular portion of HLA-C/KIR. Modeling the bending contribution is complex, as membrane bending-mediated forces are nonadditive, and they result in complex many-body effects that do not allow for analytical solutions (34).
This means that the influence of two receptor-ligand pairs on another one does not equal the sum of effects exerted by each receptor-ligand pair alone (34), and it is usually impossible to reach a minimum energy configuration except by extensive simulation of the system. Thus, we aimed to obtain order-of-magnitude estimates from a simplified geometry, to evaluate how fluorescent particle partitioning would relate to membrane-bending, elasticity-mediated effects. For these order-of-magnitude estimates, we considered a tension-free bilayer with an axisymmetric bump or curvature defect of lateral radius a and maximum height h above the membrane reference height.
The lateral radius is defined so that the membrane returns to zero curvature at zero height at distance a from the center of the bump (see Fig. S10 and Appendix S2 in the Supporting Material). This simple analysis shows that the level of exclusion could well be explained by membrane-bending elasticity; this demonstrates that although crowding alone cannot account for our data, combined with the membrane-bending-mediated mechanism it is expected to result exactly in this kind of curve shape. For particles smaller than ∼15 nm (the extracellular length of the receptor-ligand complex), the partitioning of the fluorescent particles is driven merely by lateral crowding. But a far stronger effect occurs for larger particles being excluded from the region rich in HLA-Cw6-GFP, to minimize membrane bending.
One key difference between the globular particles used in our study and the extracellular domains of membrane proteins is that the long extracellular domains often have fairly thin, slender shapes. Accordingly, whereas globular particles cannot escape the effects of membrane curvature by tilting with respect to membrane-normal, this will be possible for proteins. Essentially, there are three ways in which a long, slender protein could tilt so as to fit within a domain with short intermembrane distance.
First, the extracellular domain of a protein may be flexible: it may include flexible, disordered, joint- or hingelike regions that allow the extracellular domain of the protein to tilt with respect to membrane normal.
Second, the protein could tilt while maintaining its contact angle with membrane, i.e., the protein could localize to one slope of a membrane curvature defect; this mode of tilting likely has relatively small effects of distribution.
Third, a protein could tilt by immersing some of its juxtamembrane intra- and extracellular residues inside the lipid bilayer, i.e., by the excess length becoming accommodated within the bilayer core; for this scenario, the energetics depends on specific protein juxtamembrane sequences, but in general these tend to be very polar (e.g., the transmembrane helix of CD45 is flanked by charged residues), and their insertion deep into lipid membrane seems highly unlikely.
Accordingly, with the exception of proteins with highly flexible extracellular domains, the quantitative differences between globular particles and thin, slender proteins may not be large.
Conclusion
Our data demonstrate that fluorescent particles are excluded from the central, HLA-Cw6-GFP-rich clusters in the synapse according to their size. Moreover, these data provide quantitative data on the level of exclusion. Overall, our data strongly support the hypothesis that at short length-scales the exclusion of particles, including proteins, from regions of the synaptic cleft results from a membrane-bending, elasticity-driven process. It is important to clarify, however, that this does not imply that the protein clusters or microclusters are created solely because of this bending elasticity-related force. Other, active mechanisms can also play a role and indeed, there is also ample evidence for the role of the cytoskeleton in the transport of clusters toward the center of the synapse and organization of the synapse in general (9,10). Nevertheless, our data provide what we believe to be a new line of evidence for the importance of protein size in the supramolecular organization of immune cell synapses.
Clearly, our data provide no direct evidence for a kinetic-segregation model at the level of influencing intercellular signaling. Importantly, our study has focused on size-dependent protein segregation across the whole synapse and thus, an intriguing next goal is to probe the specific environment of membrane microclusters where immune cell signaling is thought to occur within the synapse. Moreover, these data demonstrate that the fluorescent particle partitioning provides a useful, widely applicable tool for the study of membrane-bending, elasticity-mediated interactions in intercellular contacts.
Acknowledgments
The authors acknowledge the use of functions submitted to MATLAB File Exchange (not already cited in text): the fast three-dimensional Gaussian convolution algorithm (http://www.mathworks.com/matlabcentral/fileexchange/25397-imgaussian) by Dirk-Jan Kroon and the fast three-dimensional ordinance filter (http://www.mathworks.com/matlabcentral/fileexchange/22044-ordfilt3) by Toby Collins. We thank J. Millan and F. Sanchez-Madrid (Universidad Autonoma di Madrid, Spain) for the kind gift of the pEGFP-N1-ICAM-1-EGFP plasmid.
J.-M.A. was supported by European Research Council FP7 Marie Curie Intra-European Fellowship “Membrane Nanotubes” (grant No. 235806) and a personal grant from the Osk. Huttunen Foundation. A.L.K. and M.H. were supported by the Wellcome Trust (grant No. 085457-Z-08-Z).
Footnotes
Juha-Matti Alakoskela's present address is Department of Biomedical Engineering and Computational Science, Aalto University, Aalto, Finland.
Karsten Köhler's present address is Cambridge Institute for Medical Research, Cambridge, UK.
Supporting Material
References
- 1.Groves J.T. Bending mechanics and molecular organization in biological membranes. Annu. Rev. Phys. Chem. 2007;58:697–717. doi: 10.1146/annurev.physchem.56.092503.141216. [DOI] [PubMed] [Google Scholar]
- 2.Davis S.J., van der Merwe P.A. The kinetic-segregation model: TCR triggering and beyond. Nat. Immunol. 2006;7:803–809. doi: 10.1038/ni1369. [DOI] [PubMed] [Google Scholar]
- 3.Davis D.M. Assembly of the immunological synapse for T cells and NK cells. Trends Immunol. 2002;23:356–363. doi: 10.1016/s1471-4906(02)02243-3. [DOI] [PubMed] [Google Scholar]
- 4.Davis D.M., Dustin M.L. What is the importance of the immunological synapse? Trends Immunol. 2004;25:323–327. doi: 10.1016/j.it.2004.03.007. [DOI] [PubMed] [Google Scholar]
- 5.Fan Q.R., Long E.O., Wiley D.C. Crystal structure of the human natural killer cell inhibitory receptor KIR2DL1-HLA-Cw4 complex. Nat. Immunol. 2001;2:452–460. doi: 10.1038/87766. [DOI] [PubMed] [Google Scholar]
- 6.Li P., Morris D.L., Strong R.K. Complex structure of the activating immunoreceptor NKG2D and its MHC class I-like ligand MICA. Nat. Immunol. 2001;2:443–451. doi: 10.1038/87757. [DOI] [PubMed] [Google Scholar]
- 7.Davis D.M., Chiu I., Strominger J.L. The human natural killer cell immune synapse. Proc. Natl. Acad. Sci. USA. 1999;96:15062–15067. doi: 10.1073/pnas.96.26.15062. [DOI] [PMC free article] [PubMed] [Google Scholar]
- 8.Almeida C.R., Davis D.M. Segregation of HLA-C from ICAM-1 at NK cell immune synapses is controlled by its cell surface density. J. Immunol. 2006;177:6904–6910. doi: 10.4049/jimmunol.177.10.6904. [DOI] [PubMed] [Google Scholar]
- 9.DeMond A.L., Mossman K.D., Groves J.T. T cell receptor microcluster transport through molecular mazes reveals mechanism of translocation. Biophys. J. 2008;94:3286–3292. doi: 10.1529/biophysj.107.119099. [DOI] [PMC free article] [PubMed] [Google Scholar]
- 10.Hartman N.C., Nye J.A., Groves J.T. Cluster size regulates protein sorting in the immunological synapse. Proc. Natl. Acad. Sci. USA. 2009;106:12729–12734. doi: 10.1073/pnas.0902621106. [DOI] [PMC free article] [PubMed] [Google Scholar]
- 11.Burroughs N.J., Lazic Z., van der Merwe P.A. Ligand detection and discrimination by spatial relocalization: a kinase-phosphatase segregation model of TCR activation. Biophys. J. 2006;91:1619–1629. doi: 10.1529/biophysj.105.080044. [DOI] [PMC free article] [PubMed] [Google Scholar]
- 12.Choudhuri K., Wiseman D., van der Merwe P.A. T-cell receptor triggering is critically dependent on the dimensions of its peptide-MHC ligand. Nature. 2005;436:578–582. doi: 10.1038/nature03843. [DOI] [PubMed] [Google Scholar]
- 13.Choudhuri K., Parker M., van der Merwe P.A. Peptide-major histocompatibility complex dimensions control proximal kinase-phosphatase balance during T cell activation. J. Biol. Chem. 2009;284:26096–26105. doi: 10.1074/jbc.M109.039966. [DOI] [PMC free article] [PubMed] [Google Scholar]
- 14.Köhler K., Xiong S., Davis D.M. Matched sizes of activating and inhibitory receptor/ligand pairs are required for optimal signal integration by human natural killer cells. PLoS ONE. 2010;5:e15374. doi: 10.1371/journal.pone.0015374. [DOI] [PMC free article] [PubMed] [Google Scholar]
- 15.Brzostek J., Chai J.G., Gould K.G. Ligand dimensions are important in controlling NK-cell responses. Eur. J. Immunol. 2010;40:2050–2059. doi: 10.1002/eji.201040335. [DOI] [PMC free article] [PubMed] [Google Scholar]
- 16.Milstein O., Tseng S.-Y., Dustin M.L. Nanoscale increases in CD2-CD48-mediated intermembrane spacing decrease adhesion and reorganize the immunological synapse. J. Biol. Chem. 2008;283:34414–34422. doi: 10.1074/jbc.M804756200. [DOI] [PMC free article] [PubMed] [Google Scholar]
- 17.Lakowicz J.R. 2nd Ed. Kluwer Academic/Plenum Publishers; New York, NY: 1999. Principles of Fluorescence Spectroscopy. [Google Scholar]
- 18.Davis D.M. Intercellular transfer of cell-surface proteins is common and can affect many stages of an immune response. Nat. Rev. Immunol. 2007;7:238–243. doi: 10.1038/nri2020. [DOI] [PubMed] [Google Scholar]
- 19.Das C., Sheikh K.H., Connell S.D. Nanoscale mechanical probing of supported lipid bilayers with atomic force microscopy. Phys. Rev. E. 2010;82:041920–041926. doi: 10.1103/PhysRevE.82.041920. [DOI] [PubMed] [Google Scholar]
- 20.Zuber B., Nikonenko I., Dubochet J. The mammalian central nervous synaptic cleft contains a high density of periodically organized complexes. Proc. Natl. Acad. Sci. USA. 2005;102:19192–19197. doi: 10.1073/pnas.0509527102. [DOI] [PMC free article] [PubMed] [Google Scholar]
- 21.Sørensen H.P., Sperling-Petersen H.U., Mortensen K.K. A favorable solubility partner for the recombinant expression of streptavidin. Protein Expr. Purif. 2003;32:252–259. doi: 10.1016/j.pep.2003.07.001. [DOI] [PubMed] [Google Scholar]
- 22.Liu W., Howarth M., Bawendi M.G. Compact biocompatible quantum dots functionalized for cellular imaging. J. Am. Chem. Soc. 2008;130:1274–1284. doi: 10.1021/ja076069p. [DOI] [PMC free article] [PubMed] [Google Scholar]
- 23.Howarth M., Chinnapen D.J., Ting A.Y. A monovalent streptavidin with a single femtomolar biotin binding site. Nat. Methods. 2006;3:267–273. doi: 10.1038/NMETHXXX. [DOI] [PMC free article] [PubMed] [Google Scholar]
- 24.Howarth M., Ting A.Y. Imaging proteins in live mammalian cells with biotin ligase and monovalent streptavidin. Nat. Protoc. 2008;3:534–545. doi: 10.1038/nprot.2008.20. [DOI] [PMC free article] [PubMed] [Google Scholar]
- 25.Howarth M., Liu W., Ting A.Y. Monovalent, reduced-size quantum dots for imaging receptors on living cells. Nat. Methods. 2008;5:397–399. doi: 10.1038/nmeth.1206. [DOI] [PMC free article] [PubMed] [Google Scholar]
- 26.Cohen G.B., Gandhi R.T., Baltimore D. The selective downregulation of class I major histocompatibility complex proteins by HIV-1 protects HIV-infected cells from NK cells. Immunity. 1999;10:661–671. doi: 10.1016/s1074-7613(00)80065-5. [DOI] [PubMed] [Google Scholar]
- 27.Shimizu Y., Geraghty D.E., DeMars R. Transfer and expression of three cloned human non-HLA-A,B,C class I major histocompatibility complex genes in mutant lymphoblastoid cells. Proc. Natl. Acad. Sci. USA. 1988;85:227–231. doi: 10.1073/pnas.85.1.227. [DOI] [PMC free article] [PubMed] [Google Scholar]
- 28.Wang T.Y., Leventis R., Silvius J.R. Artificially lipid-anchored proteins can elicit clustering-induced intracellular signaling events in Jurkat T-lymphocytes independent of lipid raft association. J. Biol. Chem. 2005;280:22839–22846. doi: 10.1074/jbc.M502920200. [DOI] [PubMed] [Google Scholar]
- 29.Mandelboim O., Reyburn H.T., Strominger J.L. Protection from lysis by natural killer cells of group 1 and 2 specificity is mediated by residue 80 in human histocompatibility leukocyte antigen C alleles and also occurs with empty major histocompatibility complex molecules. J. Exp. Med. 1996;184:913–922. doi: 10.1084/jem.184.3.913. [DOI] [PMC free article] [PubMed] [Google Scholar]
- 30.Vivier E., Raulet D.H., Ugolini S. Innate or adaptive immunity? The example of natural killer cells. Science. 2011;331:44–49. doi: 10.1126/science.1198687. [DOI] [PMC free article] [PubMed] [Google Scholar]
- 31.Boyington J.C., Motyka S.A., Sun P.D. Crystal structure of an NK cell immunoglobulin-like receptor in complex with its class I MHC ligand. Nature. 2000;405:537–543. doi: 10.1038/35014520. [DOI] [PubMed] [Google Scholar]
- 32.Chatelier R.C., Minton A.P. Adsorption of globular proteins on locally planar surfaces: models for the effect of excluded surface area and aggregation of adsorbed protein on adsorption equilibria. Biophys. J. 1996;71:2367–2374. doi: 10.1016/S0006-3495(96)79430-4. [DOI] [PMC free article] [PubMed] [Google Scholar]
- 33.Minton A.P. Adsorption of globular proteins on locally planar surfaces. II. Models for the effect of multiple adsorbate conformations on adsorption equilibria and kinetics. Biophys. J. 1999;76:176–187. doi: 10.1016/S0006-3495(99)77187-0. [DOI] [PMC free article] [PubMed] [Google Scholar]
- 34.Kim K.S., Neu J., Oster G. Curvature-mediated interactions between membrane proteins. Biophys. J. 1998;75:2274–2291. doi: 10.1016/S0006-3495(98)77672-6. [DOI] [PMC free article] [PubMed] [Google Scholar]
Associated Data
This section collects any data citations, data availability statements, or supplementary materials included in this article.