

Abstract
Background
Deep brain stimulation (DBS) surgery is used for treating movement disorders, including Parkinson disease, essential tremor, and dystonia. Successful DBS surgery is critically dependent on precise placement of DBS electrodes into target structures. Frequently, DBS surgery relies on normalized atlas-derived diagrams that are superimposed on patient brain magnetic resonance imaging (MRI) scans, followed by microelectrode recording and macrostimulation to refine the ultimate electrode position. Microelectrode recording carries a risk of hemorrhage and requires active patient participation during surgery.
Objective
To enhance anatomic imaging for DBS surgery using high-field MRI with the ultimate goal of improving the accuracy of anatomic target selection.
Methods
Using a 7-T MRI scanner combined with an array of acquisition schemes using multiple image contrasts, we obtained high-resolution images of human deep nuclei in healthy subjects.
Results
Superior image resolution and contrast obtained at 7 T in vivo using susceptibility-weighted imaging dramatically improved anatomic delineation of DBS targets and allowed the identification of internal architecture within these targets. A patient-specific, 3-dimensional model of each target area was generated on the basis of the acquired images.
Conclusion
Technical developments in MRI at 7 T have yielded improved anatomic resolution of deep brain structures, thereby holding the promise of improving anatomic-based targeting for DBS surgery. Future study is needed to validate this technique in improving the accuracy of targeting in DBS surgery.
Keywords: Deep brain stimulation, Globus pallidum, 7-Tesla, Subthalamic, Susceptibility-weighted, Thalamus
Deep brain stimulation (DBS) surgery is used for the treatment of patients with movement disorders, including Parkinson disease, essential tremor, and dystonia. With the recent US Food and Drug Administration (FDA) approval of DBS for obsessive-compulsive disorder and the likelihood of FDA approval for the treatment of epilepsy, the indications for DBS are rapidly increasing. To date, > 75 000 patients worldwide have undergone DBS surgery, and this number is expected to increase significantly. The success of this surgical procedure is critically dependent on the precise placement of the DBS electrode into the brain target structure of interest.
To date, most DBS surgeries have relied on a procedure that involves first an indirect targeting method in which normalized atlas-derived diagrams using set distances from the line connecting the anterior and posterior commissures1,2 are superimposed on a patient's brain magnetic resonance imaging (MRI) scan and approximate distances and coordinates are used for target localization. Indirect targeting can then be modified by anatomic information derived from the particular patient's MRI scan. However, no consensus exists about how best to normalize atlas-derived coordinates to a specific patient's brain3; significant variability exists in the location of thalamic and basal ganglia nuclei in humans4-7; and the target structures are small, measuring < 10 mm in most dimensions.7 All these factors lead to targeting errors in the operating room. Furthermore, current clinical imaging methods are not always sufficiently accurate for placing a DBS electrode and do not allow visualization of nuclei within the thalamus, the division between the lateral and medial segments of globus pallidus (GP) interna (GPi), or even a clear differentiation of the subthalamic nucleus (STN) from the adjacent substantia nigra (SN), distinctions that are critical to optimal electrode placement. As a result, multiple passes with microelectrodes through the brain are performed to refine and confirm the DBS electrode location within the target of interest. Although providing critical information about regional neurophysiology and thus the optimal location for the DBS electrode, these microelectrode recordings carry a risk of hemorrhage and require active patient participation during the procedure.
An alternative approach might be surgery based on improving the visualization of the target structure.1,4,8,9 Currently, however, inadequate image resolution and contrast preclude the use of an anatomic imaging-based targeting method for structures as Vim (ventralis intermedius) or for optimally resolving STN from SN. If anatomic imaging-based targeting methods could be improved, the accuracy of target identification on MRI would increase, allowing more accurate selection of the anatomic target.
Given recent advances in medical imaging, especially the advent of high-field-strength imaging techniques, our objective was to develop a new approach for the visualization of DBS targets that are FDA approved for the treatment of movement disorders. Using a state-of-the-art high-field (7-T) MRI scanner and capitalizing on the high resolution and enhanced image contrast afforded by high-field MRI, in conjunction with the use of susceptibility-weighted imaging (SWI)10,11 for enhancing MRI contrast, we set out to improve the in vivo detection of DBS target structures. Ultimately, the methods developed here, in addition to improving DBS surgery, will be advantageous for use in a wide range of neurosurgical procedures that could similarly benefit from direct visualization of small, low-contrast brain structures or abnormalities.
Technique Development
Subject Enrollment
After obtaining approval from the Institutional Review Board of the University of Minnesota Medical Center, we obtained consent from and enrolled 6 healthy subjects. These subjects had no prior medical history of neurological disorders, and anatomic imaging for the purposes of this study revealed no structural abnormalities.
Acquisition of 7T Images
Subjects were scanned with the 7-T magnet at the Center for Magnetic Resonance Research at the University of Minnesota. The 7-T magnet (Magnex Scientific, UK) is driven by a Siemens console (Erlangen, Germany) and uses a Siemens Avanto body gradient set capable of 40 mT/m and a maximum slew rate of 200 T/m/s or a head gradient insert capable of 80 mT/m in 135 milliseconds. A 16-channel transmit/receive head coil was used with the radio-frequency power split evenly between the channels.12 Images were acquired in an axial orientation.
The following MRI parameters were used and are summarized in the Table
Table. Magnetic Resonance Imaging Parameters for Each Sequence Used in This Studya.
| FOV, mm | Matrix | Resolution, mm | Slices, n | TR/TE, ms | Flip Angle, degrees | Bandwidth, Hz/pixel | PI, n | Repetitions, n | Total Acquisition Time, min | |
|---|---|---|---|---|---|---|---|---|---|---|
| SWI-1 (3D)b | 192 × 192 | 512 × 512 | 0.375 × 0.375 × 1 | 72 | 28/20 | 10 | 120 | 4 | 1 | 7 |
| SWI-2 (3D)c | 256 × 160 | 384 × 240 | 0.67 × 0.67 × 0.67 | 88 | 28/20 | 10 | 120 | 2 | 4 | 15 |
| T2 (2D) | 192 × 192 | 512 × 512 | 0.375 × 0.375 × 1 | 30 | 7150/68 | 180 | 121 | 0 | 1 | 7 |
| T1/PD (3D) | 256 × 192 × 176 | 256 × 192 × 176 | 1 × 1 × 1 | 176 | 2560/4.29 | 6 | 190 | 2 | 1 | 3.5 |
FOV, field of view; PI, parallel imaging acceleration factor; SWI, susceptibility-weighted imaging; 3D, 3 dimensional; TR/TE, repetition time/echo time; 2D, 2 dimensional; PD, proton density.
SWI-1, high in-plane resolution.
SWI-2, istopic voxel resolution.
SWI Acquisitions
A 3-dimensional (3D) flow-compensated gradient-echo sequence at 2 image resolutions was acquired. For high in-plane resolution, the parameters were as follows: 72 slices, field-of-view (FOV) = 192 × 192 mm2; matrix size = 512 × 512 (0.375 × 0.375 × 1.0 mm3); repetition time/echo time (TR/TE) = 28/20 milliseconds; flip angle = 10°; bandwidth =120 Hz per pixel; 6/8 partial Fourier (phase and slice); with parallel imaging using an acceleration factor of 4 (generalized autocalibrating partially parallel acquisition [GRAPPA]) along the phase-encoding direction. One average was used for a total acquisition time of approximately 7 minutes. For isotropic acquisition, the parameters were as follows: 88 slices; FOV =256 × 160 mm2; matrix = 384 × 240 (0.67 × 0.67 × 0.67 mm3); TR/TE = 28/20 milliseconds; 6/8 partial Fourier (phase and slice); and an acceleration factor of 2 (GRAPPA) along the phase-encoding direction. Four averages were used for a total acquisition time of 15 minutes.
T2-Weighted Acquisitions
A 2-dimensional turbo spin-echo sequence was used with the following image parameters: 30 slices; FOV = 192 × 192 mm2; matrix =512 × 512 (0.375 × 0.375 × 2.0 mm3); TR/TE = 7150/68 milliseconds; 180° flip angle; and bandwidth = 121 Hz per pixel. The total acquisition time was approximately 7 minutes for 1 average.
T1-Weighted Acquisitions
T1-weighted images with 1-mm isotropic resolution were acquired with a standard Siemens 3D magnetization-prepared rapid acquisition of gradient echo sequence using the following parameters: FOV = 256 × 192 × 176 mm2 (256 × 192 × 176); TR = 2560 milliseconds; inversion time = 1500 milliseconds; TE = 4.29 milliseconds; nominal flip angle = 6°; and total acquisition time was approximately 3.5 minutes with an acceleration factor of 2 (GRAPPA) along the phase-encoding direction. In addition, a proton-density–weighted volume was acquired with parameters identical to the magnetization-prepared rapid acquisition of gradient-echo acquisition except that the inversion preparation pulse and adjacent delays were removed, for a total acquisition time of approximately 2 minutes.13
Image Analysis and 3D Reconstructions
Image analysis, visualization, volume rendering, and manual segmentation were performed with Amira software (Mercury Computer Systems, Chelmsford, Massachusetts). This program can integrate and simultaneously display multiple image data sets and provides tools for manual and automatic registration and segmentation. Bilinear interpolation was applied to all images.
Results
Advantages of Higher Magnetic Field
It is well accepted that using higher magnetic field strengths, ie, stronger magnets, from 1.5 T, which is in widespread clinical use, up to 7 T results not only in an increase in the signal-to-noise ratio (SNR) of the images14 but, more important, in a significant enhancement in image contrast, which allowed the identification of various structures not visualized at 1.5 or even 3 T. One such example is shown in Figure 1. A healthy subject was scanned with both a 3-T and 7-T magnet with matched resolution and acquisition times. T2-weighted images through the level of the STN are shown. A qualitative comparison of the images acquired at the 2 field strengths indicates that 7-T imaging offers better SNR (smoother and less grainy) and superior contrast, especially at the level of the mid brain.14
Figure 1.
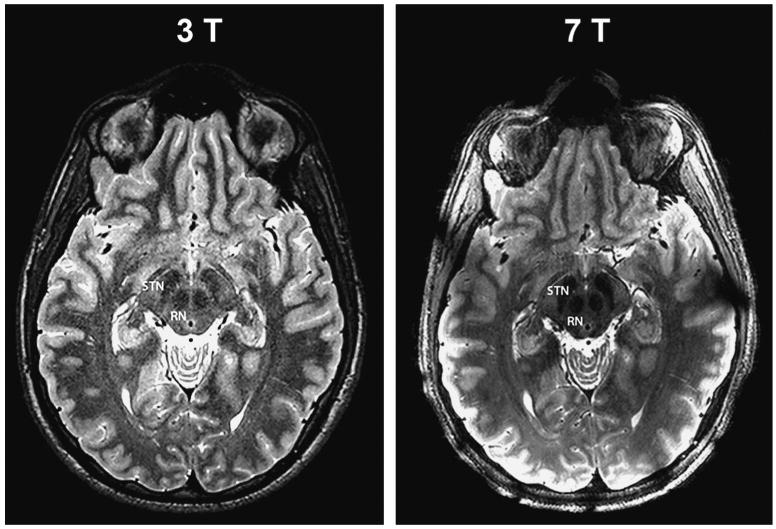
Advantages of higher magnetic field. High-resolution T2-weighted images through the level of the subthalamic nucleus (STN) of a single healthy subject acquired on 3-T and 7-T magnets with matched resolution and acquisition time (0.375 × 0.375 × 2.0 mm3; total acquisition time, 7 min). The 7-T image offers better signal-to-noise ratio (smoother and less grainy) and superior contrast especially at the level of the mid-brain. RN, red nucleus.
Image Contrasts at 7 T
In addition to currently available MRI contrasts that are in wide use, eg, T1- and T2- weighted images, a new imaging method known as SWI15 has recently emerged with promising results. Magnetic susceptibility is defined as the magnetic response of a substance when placed in an external magnetic field. SWI contrast uses the information from local susceptibility variations in the different tissue compartments provided by the phase image. Initially, SWI was used to image cerebral vasculature via reconstructions of whole-head venograms. Recently, SWI has been shown, especially at high magnetic fields, to exhibit unique and superior contrast within tissue compared with conventional T1- and T2-weighted images, allowing clearer delineation of structures within gray matter.16 The exact source of the contrast in SWI remains to be determined but is believed to arise from the following: deoxygenated blood resulting from the paramagnetic nature of deoxyhemoglobin, brain iron in the form of ferritin or hemosiderin, and/or calcium, which is diamagnetic.17
Figure 2 demonstrates the advantages of SWI at high magnetic field. In a single imaging session, T1- and T2-weighted and SWI images were acquired on the 7-T magnet across similar regions. Three representative axial slices are shown. To emphasize the contrast differences between the images, an inset of the magnified midbrain region (white box) is shown below each image. In border regions between white and gray matter, the T1-weighted image has superb white-gray matter contrast that allows clear segmentation of these 2 main compartments of the brain; however, within the thalamus, GP, and midbrain regions, T1-weighted images are essentially “flat” with no obvious contrast or identifiable structures (see Figure 2A, 2D, and 2G). T2-weighted images, on the other hand, show clear structural information within the basal ganglia and thalamus (Figure 2B, 2E, and 2H). The most obvious feature is the enhanced anatomic resolution of GP, red nucleus (RN), STN, and SN in the more ventral slices. Even more striking are the SWIs. A wealth of information exists in each of these images (Figure 2C, 2F, and 2I). In Figure 2F and 2I, the fibers of the cerebral peduncles can be distinguished (insets, right column); in Figure 2F, we can identify the convergence of STN and SN and can distinguish the architecture within the RN. In more ventral slices (Figure 2I), small vessels surrounding the SN can be easily identified.
Figure 2.
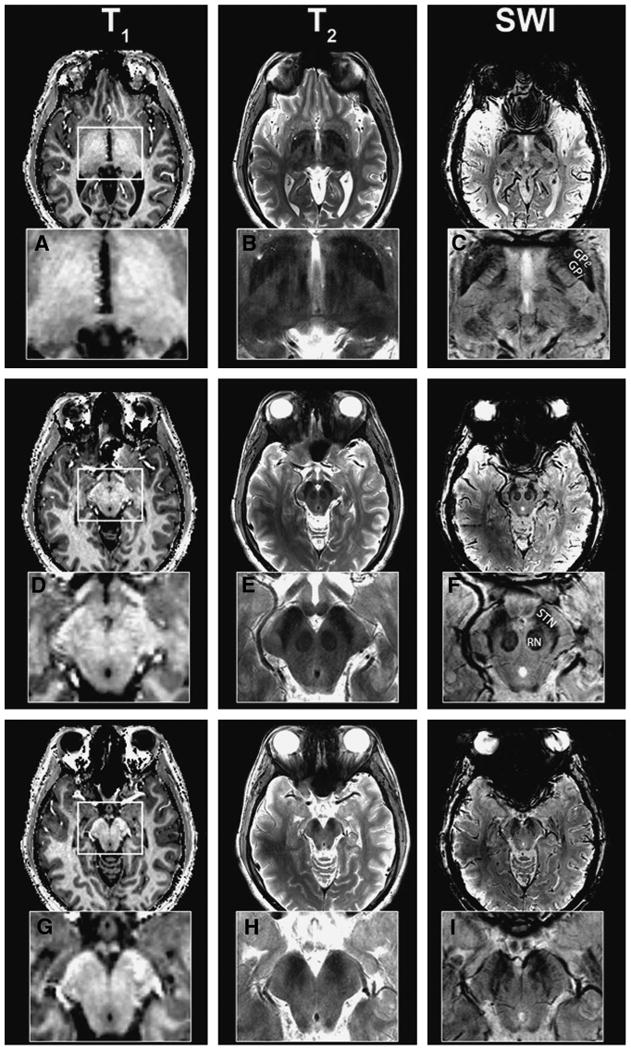
Image contrasts at 7 T. Axial brain images obtained with susceptibility-weighted imaging (SWI) at 7 T at the level of globus pallidus interna (GPi) and thalamus (A-C), subthalamic nucleus (STN; D-F), and substantia nigra (SN) caudal to STN (G-I). To emphasize the contrast differences, an inset of the magnifed midbrain region (white box) is shown. T1-weighted images have no obvious identifiable structures (A, D, G); T2-weighted images (B, E, H) delineate major nuclei; SWI images (C, F, I) exhibit an abundance of fine structural details within the same region (see text).
Direct Visualization of STN and SN
Because of the extraordinary contrast provided, SWI at high-field strength allows direct visualization of several major targets for DBS surgery. Figure 3 shows axial (Figure 3A) and coronal (Figure 3B) SWI slices acquired on a 7-T magnet. A clear boundary dividing the STN from the SN can be seen in both the axial and coronal views. Note also how well defined the perimeter of the STN appears in both hemispheres. In addition, close inspection of RN (Figure 3A) reveals not a uniform but rather a complex internal structure, with several levels of contrast that can be identified within the nucleus.
Figure 3.
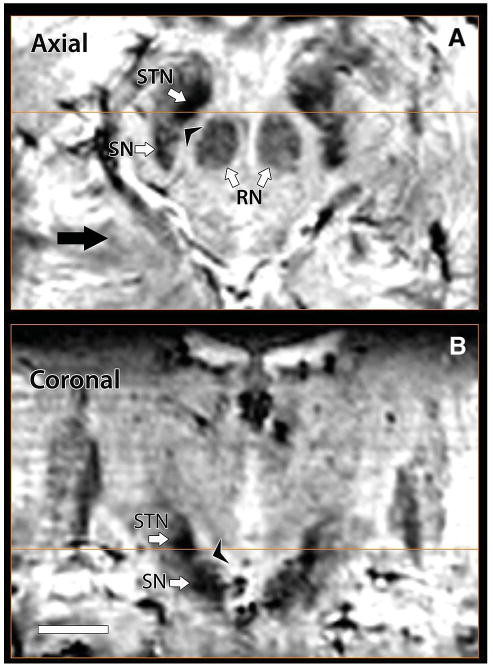
Direct visualization of subthalamic nucleus (STN) and substantia nigra (SN). In 7T susceptibility-weighted imaging axial (A) and coronal (B) images, a boundary between STN and SN can be seen; note also how clearly defined the perimeter of STN appears in both hemispheres. Additionally, examination of red nucleus (RN) reveals a complex internal structure (A).
Direct Visualization of GPi and GP Externa
Using the enhanced contrast of SWI at 7T, we can now clearly separate GPi from GPe. Figure 4 demonstrates 1 such case. GPi is marked and readily identifiable on the 3 orthogonal slices (Figure 4B-4D) immediately caudal to the intercommissural line connecting the anterior and posterior commissures. In all 3 orientations, a clear separation between GP externa (GPe) and GPi can be identified. Figure 4A demonstrates the thin layer (lamina pallidi medialis; arrows) that separates GPi from GPe in the axial plane. Furthermore, SWI contrast at high resolution also enables the identification of the lamina pallidi incomplete, the border between the internal and external segments of GPi, as demonstrated in Figure 5. Figure 5A shows a magnified view of the left GP (from Figure 4D); Figure 5B demonstrates the corresponding histologically defined outline from the Schaltenbrand and Wahren18 atlas (plate 26). Black arrows point to the border between GPe and GPi (lamina pallidi medialis), and the white arrows point to lamina pallidi incompleta.
Figure 4.
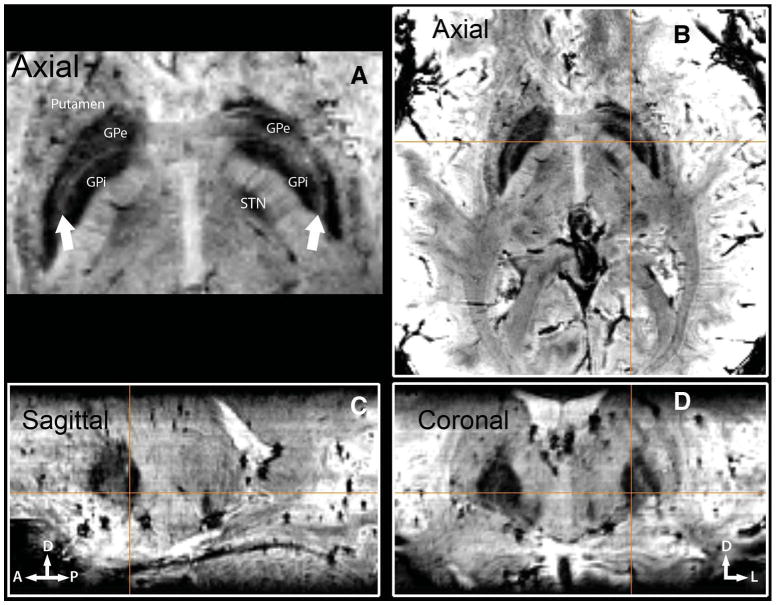
Direct visualization of globus pallidus interna (GPi) and globus pallidus externa (GPe). Three-plane imaging demonstrating the feasibility of distinguishing GPi from GPe in vivo with susceptibility-weighted imaging at 7 T. GPi is marked and displayed on all 3 orthogonal slices (B-D), immediately caudal to the anterior and posterior commissure line. A, lamina pallidi medialis. The thin layer (arrows) separating GPi from GPe.
Figure 5.
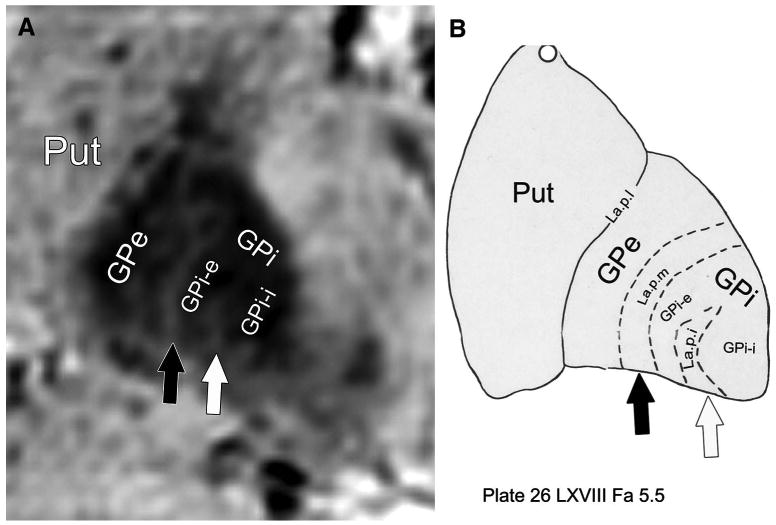
In vivo visualization of lamina pallidi incompleta (La.p.i.). Detection of the lamina pallidi incompleta, the border between the internal (GPi-i) and external (GPi-e) segments of globus pallidus interna, is demonstrated. A, a magnified view of the left GP (from Figure 4D). B, the corresponding histologically defined outline (plate 26 from the Schaltenbrand and Wahren atlas18). Black arrow points to the border between globus pallidus externa (GPe) and GPi (lamina pallidi medialis [La.p.m.]); white arrow, to the lamina pallidi incompleta. Put, putamen.
Direct Visualization of Internal Thalamic Nuclei In Vivo
The use of SWI at 7 T provided an unprecedented amount of information and image contrast within gray matter. Figure 6 is an example of the level of detail available. In Figure 6A, an axial SWI slice through thalamus is shown at the level of the anterior-posterior commissure plane. Figure 6B shows the corresponding histologically defined anatomic landmarks from the Schaltenbrand and Wahren18 atlas (plate 53). Figure 6C shows a magnified section of the thalamus overlaid with outlines of histologically identified structures (outlines of plate 53). Note the clear visualization of the anterior and medial boundaries of the pulvinar. Furthermore, the arrowhead shape of the ventral caudalis (Vc; Figure 6B, red outline), which is the main somatosensory relay nucleus of the thalamus, is easily identified in Figure 6C (see also the region of Vc in the unmarked right hemisphere). In addition, Vim (Figure 6B, green outline) can be resolved in Figure 6C on the basis of contrast modulation within the thalamus. It should be emphasized that these images were acquired in vivo from a living human subject, whereas previous visualization at this level of detail has used postmortem histological analysis.2 To the best of our knowledge, these are the first anatomic MRI images at 7 T that clearly delineate and allow the identification of internal thalamic nuclei in vivo, although previous reports have documented a hypointense band at 3 T, consistent with Vim.19,20 Because placement of a DBS electrode too close to the posterior border of Vim where it abuts Vc results in intolerable stimulation-induced paresthesias, the ability to directly visualize Vc on MRI is of immediate clinical relevance for the treatment of patients with tremor.
Figure 6.
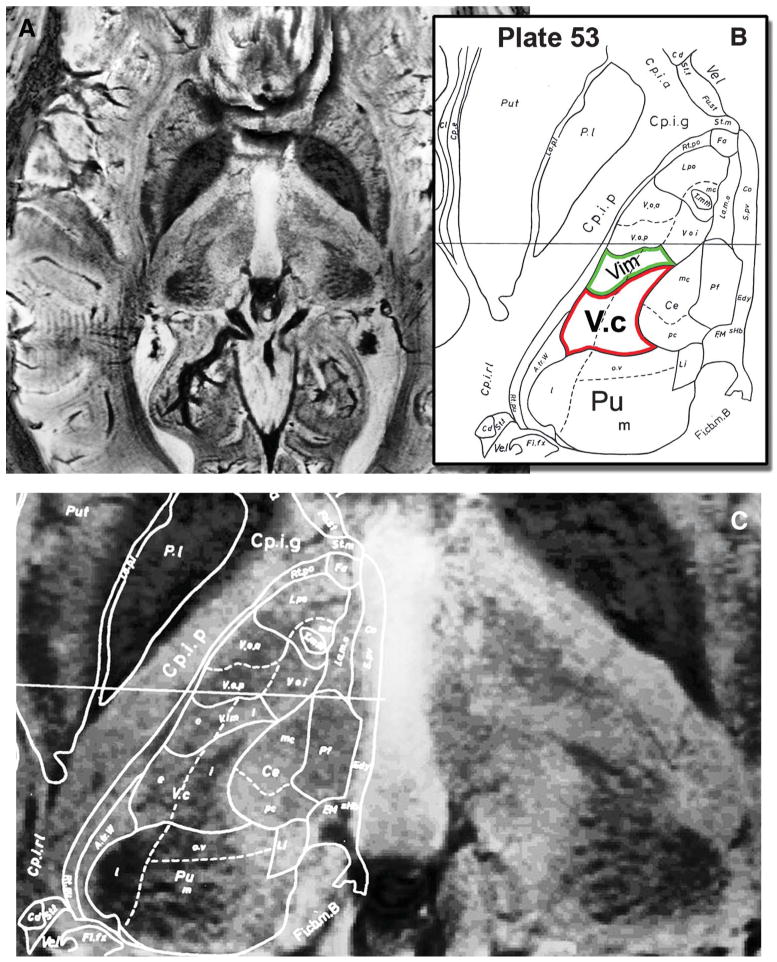
Direct visualization of internal thalamic nuclei in vivo. A, an axial susceptibility-weighted imaging slice through the thalamus at the level of the anterior and posterior commissure plane is shown. B, the corresponding histologically defined outline (plate 53 from the Schaltenbrand and Wahren atlas18) that is superimposed on the magnetic resonance image in C. Note the clear visualization of the anterior and medial aspects of the pulvinar (Pu), the arrowhead shape of ventral caudalis (Vc; red outline; compare with unmarked right hemisphere), and the image contrast modulation within the thalamus corresponding to Vim (green outline).
A 3D Model of the Mesencephalon, Thalamus, and Surrounding Regions
Taking advantage of the high image contrast and SNR attainable at 7 T, high-resolution isotropic voxels (0.67 × 0.67 × 0.67 mm3) were acquired. The acquisition of isotropic voxels enables segmentation without the need for image interpolation or resampling of the data; these latter techniques have the potential to degrade and distort the precise representation of brain structures. From the 7-T data, we constructed a 3D model of the mesencephalon, thalamus, and surrounding regions. Identification and delineation of anatomic structures were derived from the combination of highly detailed SWI and T2-weighted images that allowed the 3D visualization of DBS targets and surrounding structures. Figure 7 demonstrates such an approach. Volume renderings of GP (green), RN (red), STN (yellow), and SN (blue) are fused with a T2-weighted image. Note the clear spatial representation that the model provides regarding the localization, dimensions, and orientation of the key nuclei within the region.
Figure 7.
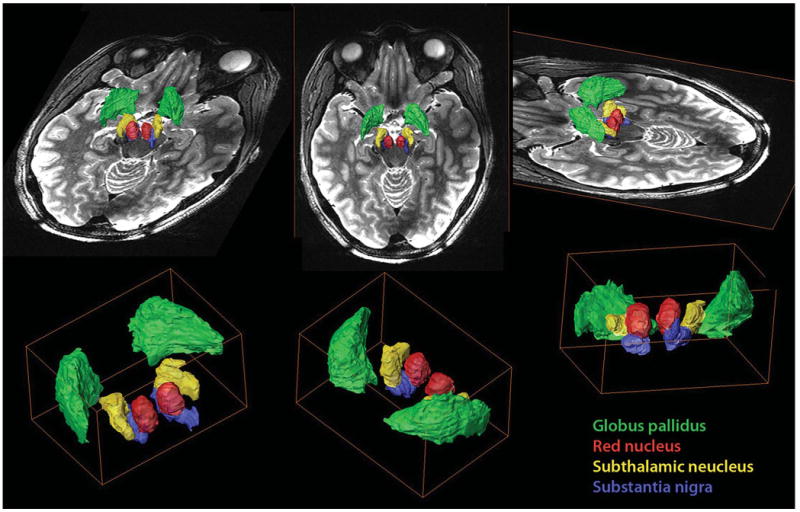
A 3-dimensional model of the mesencephalon, thalamus, and surrounding regions. Volume renderings of the globus pallidus (green), red nucleus (red), subthalamic nucleus (yellow), and substantia nigra (blue) fused with a T2-weighted image. Note the clear spatial representation that the model provides regarding the localization, dimensions, and orientation of the key nuclei within the region. The model depicts the main anatomic components in the region and their relationship to the corresponding deep brain stimulation target.
Discussion
Using a state-of-the-art high-field (7-T) MRI scanner, we developed an approach for enhancing direct detection capabilities of current DBS target structures, including Vim within the thalamus, STN, and GPi. Qualitatively, image assessment reveals highly detailed structures that are readily distinguished from their surrounding, thus allowing clear delineation of the nuclei in question and providing internal architecture with high detail. The anatomic resolution of adjacent structures such as Vc, pulvinar, SN, and RN is also noted to be enhanced compared with previous imaging techniques.
Various groups have used SWI to image the mesencephalon21 at 3-T-field-strength, high-field MRI (8 T) in live human subjects for imaging the deep gray nuclei (although without SWI)22 and high-field MRI (9.4 T) to image the STN and surrounding structures in cadaveric brain sections.2 Our use of a high-field scanner, combined with the fusion of multicontrast images and image post-processing in a live human subject, could prove to be highly advantageous for directly visualizing FDA-approved targets for DBS surgery. In this study, we demonstrated a clear delineation of the STN from the SN, the GPi from the GPe, and even the detection of the lamina pallidi incomplete within the GPi. Furthermore, using SWI, we have shown in vivo for the first time the identification of internal thalamic nuclei such as the anterior and medial aspect of the pulvinar and the boundary of Vc, thalamic structures that previously have been visualized only on postmortem specimens or with diffusion tensor imaging at lower field strength.23 Given that the success of DBS surgery is critically dependent on the proper placement of the DBS electrode within the target structure of interest and that 46% of patients evaluated at a single center for “DBS failure” proved to have suboptimally placed electrodes,24 efforts aimed at improving visualization of these target structures and their internal architecture may lead to improvements in accurate selection of the anatomic target.
Compounding the targeting problem is the fact that the STN is a small nucleus, measuring approximately 6 mm anteroposteriorly, 4 mm mediolaterally, and 5 mm dorsoventrally.25 Within this small area, the motor territory, which is the intended target for DBS surgery, lies in the posterolateral portion of the nucleus, whereas the limbic territory lies anteromedially. Immediately above the STN lies the zona incerta; posteromedially is the medial lemniscus and RN; posteroventrally is the Edinger-Westphal nucleus, which sends fibers to the tract of the third cranial nerve; ventrally is the substantia nigra pars reticulate; and laterally and anteriorly is the internal capsule. The proximity of these surrounding structures and of discrete motor and limbic territories within the STN accounts for the specific stimulation-induced side effects noted when the DBS electrode is placed in a suboptimal location within the STN1 or even at supraclinical voltages of stimulation delivered through an optimally positioned DBS electrode.
Although not as small as the STN, the GPi is similarly divided into motor and limbic territories and lies in close proximity to neighboring structures such as the optic tract ventrally, GPe laterally and dorsally, and the internal capsule posteromedially. Within the GPi lies lamina pallidi incompleta, which separates the internal and external segments of GPi.26 Vim (ventralis intermedius or motor thalamus), which cannot be distinguished from surrounding thalamic nuclei on conventional (1.5- or 3-T) MRI scans, is a narrow structure measuring approximately 2 to 4 mm in the anteroposterior dimension, 7 to 10 mm in dorsoventral extent, and 4 to 6 mm in mediolateral extent. Vc lies immediately posterior to Vim and is the principal sensory nucleus of the thalamus; medial lemniscus lies ventrally, internal capsule laterally, and ventro-oralis posterior anteriorly, and the dorsal tier nuclei are situated dorsal to Vim. Vim is organized in a somatotopic fashion, with face lying medially and leg laterally.26 Again, the close proximity of these surrounding structures both within and adjacent to the thalamus means that an electrode that is, for instance, too close to the posterior border with Vc can yield stimulation-induced paresthesias that limit the therapeutic effect of an implanted DBS electrode within Vim.
Ultimate spatial localization of the DBS electrode should be based on the electrophysiological properties of the tissue, ie, the underlying neuronal activity, rather than the anatomically defined location. However, because of the parcellation of brain tissue, there is a clear association between anatomically or structurally defined brain areas and their functional properties. Ideally, one would like to map in a noninvasive fashion the functional properties of target areas and use this information to guide electrode placement, which would eliminate the need for microelectrode recording. In the future, we hope to define the exact target location based on the functional properties of the tissue using noninvasive imaging techniques such as functional MRI, but first we need to develop methods for improved imaging and the identification of these targets and surrounding structures, as explored in this investigation.
Electrophysiological methods to confirm target location include microelectrode recording, stimulation through the microelectrode, and/or macrostimulation through the DBS electrode to confirm the location of the electrode within the target of interest and to verify that the electrode is not too close to surrounding brain structures (eg, the internal capsule) to be clinically useful. Microelectrode recording entails multiple passes through the brain with a microelectrode to obtain extracellular, single-unit recordings en route to and within the target. Although providing useful information, microelectrode recording is associated with procedural hemorrhage27 and is facilitated by the patient being awake for this portion of the procedure3 because anesthetic agents result in suppression of background and neuronal firing rates, abolition of cell discharges that are synchronous with tremor (“tremor cells”), and an increase in the frequency of cell bursting activity,28,29 all of which can obfuscate the identification of target structures based on microelectrode recording. It is worth reiterating that although microelectrode recordings remain the gold standard for identifying the STN, GPi, and Vim intraoperatively, an elevated rate of symptomatic intracranial hemorrhage has been correlated with an increasing number of microelectrode penetrations and is as high as 3.3% in some series.27 Improved MRI may allow more accurate selection of anatomic targets and might reduce the need for microelectrode recording in these procedures. It should be pointed out that many centers have minimized the number of electrode passes made per side and that this is still associated with marginally more risk than using MRI alone to localize the target. The ability to further reduce the number of passes—say, from 2 or 3 to 1 per side—will even further decrease the risk of penetration of the brain with a microelectrode and decrease operative time for those centers in which multiple simultaneous multi-electrode recording tracks are not performed.
Two caveats, however, must be raised. First, the use of image-based targeting without microelectrode recording currently obligates the use of macrostimulation to confirm the location of the DBS electrode, except in situations when the patient is better served by being under a general anesthetic for the procedure (eg, severe generalized dystonia). Second, MRI-based targeting alone, without the use of confirmatory electrophysiology (microelectrode recording and/or macrostimulation), raises the confounding issue of brain shift; ie, the target location on an MRI acquired in the supine position is not the same as the target location in the operating room when the patient is in a more upright position. Both of these issues need to be addressed for image-based targeting to supplant the use of microelectrode recording for localization of the optimal electrode position.
Capitalizing on the advantages of high-field strength and the new acquisition technique described here, a comprehensive and detailed patient-specific 3D model of the target area can be developed. For DBS surgery, such a structural model could be used intraoperatively at the time of electrode trajectory planning to increase the likelihood of optimal DBS electrode placement. Additionally, such a 3D rendering could facilitate postoperative programming and the interpretation of stimulation-induced side effects by highlighting in 3D the anatomic relationship between the DBS electrode, target nucleus, and surrounding structures. Such information could facilitate decisions about how to adjust stimulation parameters.
In a similar manner, diffusion tensor imaging tractography of adjacent white matter fiber bundles and the vasculature in the vicinity of the target region, as well as along the trajectory of the DBS electrode, could also be added to a 3D model of the main components in the region. As a direct result, such a model might ultimately minimize or eliminate microelectrode penetrations, thereby significantly reducing hemorrhage risk and white matter tract damage. A wide variety of clinical applications could be anticipated to benefit from such a model.
Ideally, imaging for clinical application needs to provide 3 qualities: the highest possible SNR, the highest possible image resolution with adequate contrast, and the minimum possible image distortion. Although the preliminary results presented here are very encouraging, several methodological issues still need to be refined and optimized, eg, image resolution. The preliminary data presented here were acquired with 2 image resolutions; the first data set used high in-plane resolutions (0.375 × 0.375 × 1.0 mm3) that provide excellent levels of detail, and the second data set was acquired with isotropic resolution (0.67 × 0.67 × 0.67 mm3). Although the second data set lacks the fine detail seen in the first data set, it possesses more than twice the image SNR compared with the higher in-plane resolution data set. More important, its isotropic voxels provide the ability for accurate segmentations of the target areas without the need for image interpolation or resampling of the data, techniques that have the potential to degrade and distort the precise representation of structures in the 3D model. Ongoing efforts to optimize image resolution with adequate image contrast while providing sufficient SNR must be balanced with the need to minimize image distortion (see below) while providing a total acquisition scan time that is not unduly long.
Other MR methodological topics that need to be addressed include local vs global B0 shim that should further improve SWI at the target locations and reduce susceptibility-related distortions. Efforts are currently underway for the development of B1 shim techniques for correction of radiofrequency B1 coil profile inhomogeneities, which are more dominant at high fields30 and can cause nonuniform signal intensity profiles in the image.
Another challenge with increasing field strength is the possibility of geometric distortion31 (or pixel shifts), which is more pronounced at 7 T, particularly when using SWI, compared with images acquired at lower field. SWI contrast is based on susceptibility differences, which at high fields can also cause signal loss and image distortion as a result of the shorter T2*, especially in regions near the interface between air-filled cavities and tissue. The elevated SNR at 7 T, however, allows smaller voxel volumes compared with lower field strengths, at which intravoxel dephasing caused by background field inhomogeneities is reduced. Several approaches have been suggested to minimize and correct these geometric distortions. For example, field maps can be acquired during the imaging sessions, and by characterizing the field inhomogeneities, we can correct misplaced signals. In addition, localized B0 shimming approaches, as proposed above, will significantly alleviate this problem in regions of interest.
Future Studies
Validation of our findings and clinical implementation remain to be performed and require comparison between the direct targeting approach proposed here and the existing technique of indirect targeting modified by microelectrode recording and macrostimulation results. Issues such as brain shift and the targeting errors that can result from this need to be addressed, as described above. The question of whether the enhanced internal and surrounding anatomic resolution afforded by SWI at 7 T can be used to improve targeting of DBS structures in the operating room remains to be answered.
With the proliferation of high-field strength MRI—worldwide > 30 7-T MRI units are expected to be installed in 2010 alone—developing applications that benefit from the advantages of high-field MR as demonstrated here is highly desirable. Ultimately, the methods developed here, in addition to improving DBS surgery, will be advantageous for use in a wide range of neurosurgical procedures that might benefit from direct visualization of small, low-contrast brain structures or abnormalities.
Conclusion
We developed a technique for 7-T MRI using SWI that qualitatively enhances the resolution of DBS target structures and allows clearer delineation of these targets from surrounding structures while providing unprecedented detail of internal architecture.
Comment.
This is a very nice piece of work using 7-T magnetic resonance imaging and susceptibility-weighted imaging to define anatomical detail in functional neurosurgical targets, including subthalamic nucleus, globus pallidus interna, and Vim, and to construct a 3-dimensional rendered image. As the authors note, some methodological issues need to be addressed, in particular the possibility for image distortion with the high-field-strength susceptibility-weighted imaging, and they note that this needs to be addressed in clinical studies using the 7-T magnet for targeting in practice. Even with these limitations, I imagine that fusing the 7-T data set with nonrigid deformation approaches would allow surgeons to take advantage of the anatomical detail (in particular, subthalamic nucleus and Vim) without giving up spatial rigor. Of course, given how long it has taken for widespread availability of 3-T imaging, it will be some time before 7-T imaging will penetrate into clinical practice.
Robert E. Gross
Atlanta, Georgia
Acknowledgments
We wish to thank Phil Starr, MD, PhD, for his critical review of this manuscript.
This research was supported by a Career Development Award from the National Center for Research Resources to Dr Abosch (5K12-RR03358-03). Dr Harel received support from the following sources: R01EB008645, R01 MH070800, R01 EB000331, P41 RR008079, P30 NS057091, and the KECK Foundation.
Abbreviations
- DBS
deep brain stimulation
- FDA
Food and Drug Administration
- FOV
field of view
- GPe
globus pallidus externa
- GPi
globus pallidus interna
- GRAPPA
generalized auto-calibrating partially parallel acquisition
- RN
red nucleus
- SN
substantia nigra
- SNR
signal-to-noise ratio
- STN
subthalamic nucleus
- SWI
susceptibility-weighted imaging
- TE
echo time
- TR
repetition time
- Vc
ventral caudalis
- Vim
ventralis intermedius
Footnotes
Disclosure: The authors have no personal financial or institutional interest in any of the drugs, materials, or devices described in this article.
Contributor Information
Aviva Abosch, Department of Neurosurgery, University of Minnesota Medical School, Minneapolis, Minnesota.
Essa Yacoub, Center for Magnetic Resonance Research, Department of Radiology, University of Minnesota Medical School, Minneapolis, Minnesota.
Kamil Ugurbil, Center for Magnetic Resonance Research, Departments of Radiology and Neurosurgery, University of Minnesota Medical School, Minneapolis, Minnesota.
Noam Harel, Center for Magnetic Resonance Research, Department of Radiology, University of Minnesota Medical School, Minneapolis, Minnesota.
References
- 1.Starr PA. Placement of deep brain stimulators into the subthalamic nucleus or globus pallidus internus: technical approach. Stereotact Funct Neurosurg. 2002;79(3-4):118–145. doi: 10.1159/000070828. [DOI] [PubMed] [Google Scholar]
- 2.Rijkers K, Temel Y, Visser-Vandewalle V, et al. The microanatomical environment of the subthalamic nucleus: technical note. J Neurosurg. 2007;107(1):198–201. doi: 10.3171/JNS-07/07/0198. [DOI] [PubMed] [Google Scholar]
- 3.Patel NK, Khan S, Gill SS. Comparison of atlas- and magnetic-resonance-imaging-based stereotactic targeting of the subthalamic nucleus in the surgical treatment of Parkinson's disease. Stereotact Funct Neurosurg. 2008;86(3):153–161. doi: 10.1159/000120427. [DOI] [PubMed] [Google Scholar]
- 4.Ashkan K, Blomstedt P, Zrinzo L, et al. Variability of the subthalamic nucleus: the case for direct MRI guided targeting. Br J Neurosurg. 2007;21(2):197–200. doi: 10.1080/02688690701272240. [DOI] [PubMed] [Google Scholar]
- 5.Brierley JB, Beck E. The significance in human stereotactic brain surgery of individual variation in the diencephalon and globus pallidus. J Neurol Neurosurg Psychiatry. 1959;22:287–298. doi: 10.1136/jnnp.22.4.287. [DOI] [PMC free article] [PubMed] [Google Scholar]
- 6.Starr PA, Vitek JL, DeLong M, Bakay RA. Magnetic resonance imaging-based stereotactic localization of the globus pallidus and subthalamic nucleus. Neurosurgery. 1999;44(2):303–313. doi: 10.1097/00006123-199902000-00031. [DOI] [PubMed] [Google Scholar]
- 7.Richter EO, Hoque T, Halliday W, Lozano AM, Saint-Cyr JA. Determining the position and size of the subthalamic nucleus based on magnetic resonance imaging results in patients with advanced Parkinson disease. J Neurosurg. 2004;100(3):541–546. doi: 10.3171/jns.2004.100.3.0541. [DOI] [PubMed] [Google Scholar]
- 8.Slavin KV, Thulborn KR, Wess C, Nersesyan H. Direct visualization of the human subthalamic nucleus with 3T MR imaging. AJNR Am J Neuroradiol. 2006;27(1):80–84. [PMC free article] [PubMed] [Google Scholar]
- 9.Patel NK, Plaha P, O'Sullivan K, McCarter R, Heywood P, Gill SS. MRI directed bilateral stimulation of the subthalamic nucleus in patients with Parkinson's disease. J Neurol Neurosurg Psychiatry. 2003;74(12):1631–1637. doi: 10.1136/jnnp.74.12.1631. [DOI] [PMC free article] [PubMed] [Google Scholar]
- 10.Yablonskiy DA, Haacke EM. Theory of NMR signal behavior in magnetically inhomogeneous tissues: the static dephasing regime. Magn Reson Med. 1994;32(6):749–763. doi: 10.1002/mrm.1910320610. [DOI] [PubMed] [Google Scholar]
- 11.Haacke EM, Xu Y, Cheng YC, Reichenbach JR. Susceptibility weighted imaging (SWI) Magn Reson Med. 2004;52(3):612–618. doi: 10.1002/mrm.20198. [DOI] [PubMed] [Google Scholar]
- 12.Adriany G, Van de Moortele PF, Ritter J, et al. A geometrically adjustable 16-channel transmit/receive transmission line array for improved RF efficiency and parallel imaging performance at 7 Tesla. Magn Reson Med. 2008;59(3):590–597. doi: 10.1002/mrm.21488. [DOI] [PubMed] [Google Scholar]
- 13.Van de Moortele PF, Auerbach EJ, Olman C, Yacoub E, Ugurbil K, Moeller S. T1 weighted brain images at 7 Tesla unbiased for proton density, T2* contrast and RF coil receive B1 sensitivity with simultaneous vessel visualization. Neuroimage. 2009;46(2):432–446. doi: 10.1016/j.neuroimage.2009.02.009. [DOI] [PMC free article] [PubMed] [Google Scholar]
- 14.Vaughan JT, Garwood M, Collins CM, et al. 7T vs. 4T: RF power, homogeneity, and signal-to-noise comparison in head images. Magn Reson Med. 2001;46(1):24–30. doi: 10.1002/mrm.1156. [DOI] [PubMed] [Google Scholar]
- 15.Haacke EM, Xu Y, Cheng YC, Reichenbach JR. Susceptibility weighted imaging (SWI) Magn Reson Med. 2004;52(3):612–618. doi: 10.1002/mrm.20198. [DOI] [PubMed] [Google Scholar]
- 16.Duyn JH, van GP, Li TQ, de Zwart JA, Koretsky AP, Fukunaga M. High-field MRI of brain cortical substructure based on signal phase. Proc Natl Acad Sci U S A. 2007;104(28):11796–11801. doi: 10.1073/pnas.0610821104. [DOI] [PMC free article] [PubMed] [Google Scholar]
- 17.Manova ES, Habib CA, Boikov AS, et al. Characterizing the mesencephalon using susceptibility-weighted imaging. AJNR Am J Neuroradiol. 2009;30(3):569–574. doi: 10.3174/ajnr.A1401. [DOI] [PMC free article] [PubMed] [Google Scholar]
- 18.Schaltenbrand G, Wahren W. Atlas for Stereotaxy of the Human Brain. 2nd. Stuttgart, Germany: Thieme; 1977. [Google Scholar]
- 19.Spiegelmann R, Nissim O, Daniels D, Ocherashvilli A, Mardor Y. Stereotactic targeting of the ventrointermediate nucleus of the thalamus by direct visualization with high-field MRI. Stereotact Funct Neurosurg. 2006;84(1):19–23. doi: 10.1159/000092683. [DOI] [PubMed] [Google Scholar]
- 20.Gringel T, Schulz-Schaeffer W, Elolf E, Frolich A, Dechent P, Helms G. Optimized high-resolution mapping of magnetization transfer (MT) at 3 Tesla for direct visualization of substructures of the human thalamus in clinically feasible measurement time. J Magn Reson Imaging. 2009;29(6):1285–1292. doi: 10.1002/jmri.21756. [DOI] [PubMed] [Google Scholar]
- 21.Manova ES, Habib CA, Boikov AS, et al. Characterizing the mesencephalon using susceptibility-weighted imaging. AJNR Am J Neuroradiol. 2009;30(3):569–574. doi: 10.3174/ajnr.A1401. [DOI] [PMC free article] [PubMed] [Google Scholar]
- 22.Bourekas EC, Christoforidis GA, Abduljalil AM, et al. High resolution MRI of the deep gray nuclei at 8 Tesla. J Comput Assist Tomogr. 1999;23(6):867–874. doi: 10.1097/00004728-199911000-00009. [DOI] [PubMed] [Google Scholar]
- 23.Jonasson L, Hagmann P, Pollo C, et al. A level set method for segmentation of the thalamus and its nuclei in DT-MRI. Signal Processing. 2007;87:309–321. [Google Scholar]
- 24.Okun MS, Tagliati M, Pourfar M, et al. Management of referred deep brain stimulation failures: a retrospective analysis from 2 movement disorders centers. Arch Neurol. 2005;62(8):1250–1255. doi: 10.1001/archneur.62.8.noc40425. [DOI] [PubMed] [Google Scholar]
- 25.Richter EO, Hoque T, Halliday W, Lozano AM, Saint-Cyr JA. Determining the position and size of the subthalamic nucleus based on magnetic resonance imaging results in patients with advanced Parkinson disease. J Neurosurg. 2004;100(3):541–546. doi: 10.3171/jns.2004.100.3.0541. [DOI] [PubMed] [Google Scholar]
- 26.Gross RE, Krack P, Rodriguez-Oroz MC, Rezai AR, Benabid AL. Electrophysiological mapping for the implantation of deep brain stimulators for Parkinson's disease and tremor. Mov Disord. 2006;21(Suppl 14):S259–S283. doi: 10.1002/mds.20960. [DOI] [PubMed] [Google Scholar]
- 27.Ben-Haim S, Asaad WF, Gale JT, Eskandar EN. Risk factors for hemorrhage during microelectrode-guided deep brain stimulation and the introduction of an improved microelectrode design. Neurosurgery. 2009;64(4):754–762. doi: 10.1227/01.NEU.0000339173.77240.34. [DOI] [PubMed] [Google Scholar]
- 28.Hutchison WD, Lang AE, Dostrovsky JO, Lozano AM. Pallidal neuronal activity: implications for models of dystonia. Ann Neurol. 2003;53(4):480–488. doi: 10.1002/ana.10474. [DOI] [PubMed] [Google Scholar]
- 29.Lin SH, Chen TY, Lin SZ, et al. Subthalamic deep brain stimulation after anesthetic inhalation in Parkinson disease: a preliminary study. J Neurosurg. 2008;109(2):238–244. doi: 10.3171/JNS/2008/109/8/0238. [DOI] [PubMed] [Google Scholar]
- 30.Van de Moortele PF, Akgun C, Adriany G, et al. B(1) destructive interferences and spatial phase patterns at 7 T with a head transceiver array coil. Magn Reson Med. 2005;54(6):1503–1518. doi: 10.1002/mrm.20708. [DOI] [PubMed] [Google Scholar]
- 31.Menuel C, Garnero L, Bardinet E, Poupon F, Phalippou D, Dormont D. Characterization and correction of distortions in stereotactic magnetic resonance imaging for bilateral subthalamic stimulation in Parkinson disease. J Neurosurg. 2005;103(2):256–266. doi: 10.3171/jns.2005.103.2.0256. [DOI] [PubMed] [Google Scholar]