

Abstract
Integrated approaches utilizing in silico analyses will be necessary to successfully advance the field of metabolic engineering. Here, we present an integrated approach through a systematic model-driven evaluation of the production potential for the bacterial production organism E. coli to produce multiple native products from different representative feedstocks through coupling metabolite production to growth rate. Designs were examined for eleven unique central metabolism and amino acid targets from three different substrates under aerobic and anaerobic conditions. Optimal strain designs were reported for designs which possess maximum yield, substrate-specific productivity, and strength of growth-coupling for up to ten reaction eliminations (knockouts). In total, growth-coupled designs could be identified for 36 out of the total 54 conditions tested, corresponding to eight out of the eleven targets. There were 17 different substrate/target pairs for which over 80% of the theoretical maximum potential could be achieved. The developed method introduces a new concept of objective function tilting for strain design. This study provides specific metabolic interventions (strain designs) for production strains that can be experimentally implemented, characterizes the potential for E. coli to produce native compounds, and outlines a strain design pipeline that can be utilized to design production strains for additional organisms.
Keywords: systems biology, escherichia coli, metabolism, OptGene, OptKnock
Introduction
Metabolic engineering has been successful in generating biological strains for the production of compounds for a variety of purposes (Atsumi and Liao, 2008; Chartrain et al., 2000; Keasling and Chou, 2008; Khosla and Keasling, 2003; Nakamura and Whited, 2003). The earliest approaches to engineer microorganisms have consisted of mutating strains with a known mutagen and selecting for a strain with the desired phenotype. This process is largely dependent upon encountering a desired mutant after the mutagenesis and selection process. Over the past decade, new tools and strategies for engineering microorganisms have appeared including loss-of-function gene mutations (i.e., gene knock-outs) (Bailey, 1991; Lee et al., 2007; Lee et al., 2005a; Park et al., 2007; Trinh et al., 2006; Trinh et al., 2008), overexpression of gene products (Altaras and Cameron, 1999; Bailey, 1991; Park et al., 2007; Zhang et al., 2007), and introduction of homologous DNA for new or improved functionalities of cells. Today, an increasing amount of success has been achieved by rationally designing strains using these readily available methods (Jaluria et al., 2008; Santos and Stephanopoulos, 2008; Tyo et al., 2007). However, it is difficult to identify an optimal strain by rational design alone, as several parameters that should be considered simultaneously in designs are difficult to predict without a computational approach.
Fueled by the ability to sequence and annotate genomes and the development of techniques such as flux balance analysis, systems biology can now play a role in the metabolic engineering process by guiding interventions to divert metabolite flux within a microbial cell. Genome-scale metabolic models (Barrett et al., 2006; Duarte et al., 2007; Feist et al., 2007; Feist et al., 2008; Price et al., 2004; Reed and Palsson, 2003; Reed et al., 2003; Zhang, 2008) can be used as query platforms to examine new strategies and interventions as they contain parts lists for content in cells. Systems biology has been shown to be successful in predicting the outcomes (e.g., products, growth rates, etc.) of cellular growth utilizing a constraint based reconstruction and analysis (COBRA) approach (Price et al., 2003). Furthermore, there now exist several examples of model-driven metabolic engineering for the production of various compounds (Feist and Palsson, 2008; Kim et al., 2008a; Kim et al., 2008b; Lee et al., 2005b; Park et al., 2008).
The coupling of bacterial growth and target molecule production is an important feature to select for in strain design for several reasons. First, a strain in which target production is growth coupled to biomass production must produce this target molecule in order to produce biomass components. Therefore, in order for the cell to achieve faster growth, the target molecule must be secreted as well. This allows for evolving the strain towards higher target production rates by coupling it to the natural selection of the population towards faster growth. In this way, strains, or mutants, that produce the target molecule can be easily selected by selecting for strains with the fastest growth through adaptive evolution and serial passage. Serial passage results in optimization of the strain for target production as well as growth rate, both desirable traits. This optimized strain can also be considered stable, as mutations that would result in lower target production would cause a decreased growth rate, and therefore would be outcompeted by the optimized strain in future passes. Adaptive evolution has been used for the experimental analysis of evolution of both wild type and knockout strains with success (Fong et al., 2005a; Fong et al., 2005b; Fong and Palsson, 2004; Ibarra et al., 2002), therefore providing confidence that the knockout strains described herein will be able to undergo the same adaptation when experimentally implemented.
In conjunction with COBRA methods and the development of organism-specific models, the experimental approach of adaptive evolution has been proven effective for the selection of strains that possess optimal growth phenotypes (Fong et al., 2005a; Fong et al., 2005b; Fong and Palsson, 2004; Ibarra et al., 2002). We now can combine these two approaches and use them as design principles to obtain production strains that agree with computationally predicted phenotypes. Initial computational efforts towards this goal have been performed (Burgard et al., 2003; Patil et al., 2005; Pharkya et al., 2003; Pharkya et al., 2004) and an initial study has been experimentally verified for a selected case (Fong et al., 2005a), however a rigorous computation of potential has not appeared. Therefore, we performed a large-scale computational study of growth-coupled production potential of a wide array of industrially relevant targets under several different substrate conditions, utilizing the OptKnock and OptGene algorithms. We then identified the best designs for each target/substrate pair under three desirable criteria: yield, substrate specific productivity (SSP), and strength of growth coupling (SOC). We also identify trends and common structural characteristics that enable certain targets to be growth-coupled with production, as well as genes that are commonly associated with growth-coupled designs under each substrate condition. The methods outlined in this paper, as well as the strain designs themselves, serve as fundamental approaches to and results of applying systems biology methods to metabolic engineering.
Methods
Model
The metabolic reconstruction of E. coli iAF1260 (Feist et al., 2007) was utilized as a basis for the model used throughout the work described herein, with minor changes to network content (See Supplementary Table 1). This model has been functionally tested and verified against experimental data to be predictive for computations of growth rates, metabolite excretion rates, and growth phenotypes on a number of substrate and genetic conditions (Feist et al., 2007). New additions to the reconstruction and model were added by examining experimental data from published work (See Supplementary Table 1). For all simulations, the reactions CAT, SPODM, and SPODMpp (oxidative stress reactions) and the FHL reaction were constrained to zero for reasons previously established (Feist et al., 2007).
Flux balance analysis and strain design computations
Flux balance analysis (FBA) was used for computing optimal phenotypes using iAF1260 and the outlined biomass objective function, BOFCORE, with the reported maintenance energies presented with the reconstruction (Feist et al., 2007). FBA, performed using an assumption of steady-state metabolite flux, has been described in detail previously (Price et al., 2004). All computations were performed using the MATLAB® (The Math Works Inc., Natick, MA) and the COBRA Toolbox (Becker et al., 2007) software packages with TOMLAB (Tomlab Optimization Inc., San Diego, CA) solvers.
OptKnock (Burgard et al., 2003) and OptGene (Patil et al., 2005) were implemented in the COBRA Toolbox framework as described in their original documentation. OptGene was modified to allow either the deletion of genes or reactions from a simulation to determine genotypes that resulted in desirable production characteristics (see below). To more efficiently determine strain designs that possessed different desirable phenotypes (e.g., maximum yield or maximum substrate-specific productivity), solutions from OptKnock, when available, were used as inputs to OptGene (see Figure 3). OptKnock final and intermediate solutions (which were saved whenever OptKnock found a better iterative solution during the course of the simulation) were used to create individuals forming an initial population for each substrate for which a valid OptKnock solution was found. Additionally, individuals created with OptKnock suggested knockouts which were randomly introduced to the population with a 1/(3 * population size) probability every generation, in order to ensure that these OptKnock solutions continue to be present in the population throughout the simulation. The secondary objective function from which strain selection was based for OptKnock was substrate yield. The secondary objective functions examined for OptGene were substrate yield, substrate-specific productivity, and the degree of growth-coupling (see Figure 1). Details of the implementation of the OptGene algorithm are given in supplementary text.
Figure 3. Strain design pipeline: the process used to compute strain designs for growth-coupled production in E. coli.
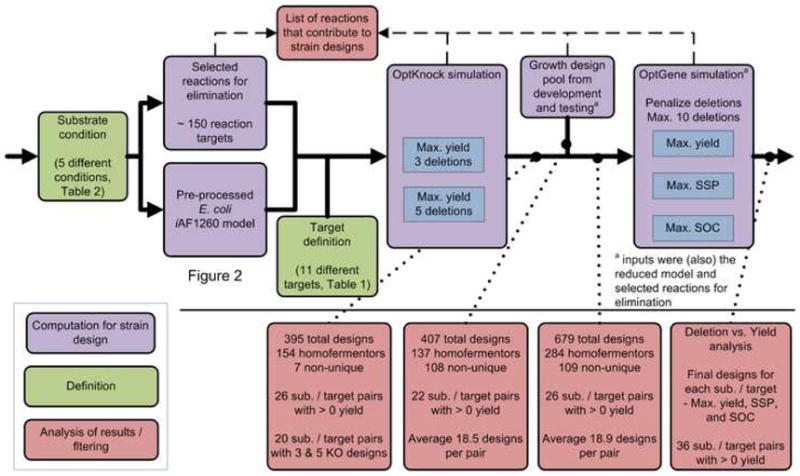
This workflow outlines the process developed to generate the strain designs for the analysis and the results at various points in the process. Each colored box represents a computation (violet), substrate or target definition (green), or filtering or analysis of results generated during the procedure (red). Starting on the left, the substrate conditions were defined to produce substrate-specific model and the reactions targeted for elimination in the analysis. From here, targets were defined and the OptKnock (Burgard et al., 2003) algorithm was first used to examine lower knockout number maximum yield designs. Using the results from this analysis, designs were fed into simulations with the OptGene (Patil et al., 2005) algorithm along with results from a testing design pool. OptGene simulation results examined maximum yield, substrate-specific productivity (SSP), and strength of growth coupling (SOC) for up to ten reaction knockouts. Results from different time points in the analysis are given on the bottom. Additionally, reactions that contributed to designs were compared to the initial targets for comparison.
Figure 1. Strain Design Selection: Secondary objective criteria.
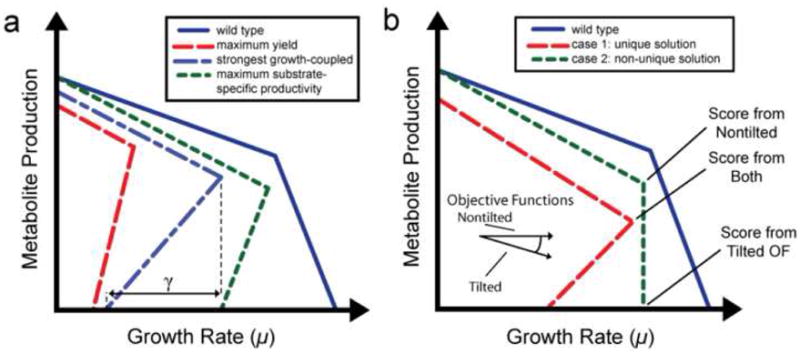
Graphs showing (a) the production envelopes of the different secondary objective functions examined for designing strains, and (b) the different types of production envelopes encountered during this analysis. Also shown is a schematic of the direction of optimization for the ‘tilted’ and ‘non-tilted’ objective functions used in the analyses and points on the production envelopes each will score.
The simulations were run to completion for three and five maximum knockout simulations. However, due to time constraints resulting from the extremely large solution space (over 1 quadrillion possible ten knockout combinations from a pool of 150 target reactions) and the breadth of this study, the ten knockout simulations were limited to one week run time, and therefore better solutions could potentially exist.
Consumption rate (or substrate uptake rate) for the main carbon substrate in each simulation was set to 20 mmol gDW−1 hr−1. If aerobic conditions were used, an oxygen uptake rate of 20 mmol gDW−1 hr−1 was also used. These values are close to that observed experimentally for aerobic and anaerobic cultures (Varma et al., 1993; Varma and Palsson, 1994).
Tilting of the objective function
Many of the genotypes that the OptKnock function returns after completion result in a ‘non-unique’ phenotype (see Figure 1), consisting of equivalent optimal solutions. This is an undesired phenotype as evolution to the predicted optimal behavior does not ensure production of the desired compound (i.e., it could produce the other equivalent product(s)). In order to alleviate this problem, the OptGene and OptKnock algorithms were run with a ‘tilted’ objective function that maximizes growth rate while also slightly minimizing yield, causing the function to return the bottom point of a ‘non-unique’ solution. This point represents the minimum flux expected through the target reaction. Tilting of the objective function in OptGene was accomplished by augmenting the objective vector at the element for the outer membrane transporter for the target production, which is directly coupled to the exchange reaction for the target. In OptKnock, tilting was accomplished by both augmenting the objective vector in the same fashion as with OptGene, as well as setting a constraint minimum production rate on this same reaction equal to the value of augmentation. Tilting the objective has the effect of slightly minimizing the target reaction, since the outer membrane reaction is oriented inwards, resulting in the lower of two previously equivalent solutions to be chosen as optimal. This process was effective at selecting only the minimum production rate for a target reaction for a ‘non-unique’ solution, allowing the algorithm to identify a solution with the highest minimum production rate.
Objective functions used for strain design selection and substrate constraints
Strain designs examined during the project were evaluated by three different production phenotypes (equations 1–3) under the stipulation that all designs had to be growth coupled (see intro). Each equation examines a different desirable production phenotype. The equations examined in this study were product yield, substrate specific productivity, and strength of growth coupling (see Figure 1). All of these values are calculated for an optimally performing strain at steady state. The units for each measure are also given in parentheses.
Product yield (Yp/s): Maximum amount of product that can be generated per unit of substrate.
| (1) |
Substrate-specific productivity (SSP): Product yield per unit substrate multiplied by the growth rate
| (2) |
Strength of coupling: Product yield per unit substrate divided by the slope of the lower edge of the production curve
| (3) |
The slope in this function is the slope of the line between the point of minimum production rate at maximum growth and the point of maximum growth at zero production on a production envelope plot (Figure 1). When this slope is high, it is possible for a strain to grow at very close to the maximum growth rate with only a small production rate, which is undesirable. Therefore, optimizing for maximum production rate is the same as optimizing for maximum product yield. Maximizing for substrate specific productivity (also called the Biomass-Product Coupled Yield (BPCY) (Patil et al., 2005)) introduces a non-linear objective function, which can be handled by OptGene but not OptKnock. Similarly, the strength of coupling is also a non-linear objective function and can only be handled by OptGene. Additionally, a penalty can be added to the scoring function in OptGene by multiplying the objective function with the following penalty function (equation 4):
| (4) |
where objective_new is the new score of the objective function, objective_original is the original objective function (e.g., product yield), delPenalty is the deletion penalty, and numDels is the number of knockout reactions. This penalty ensures that designs with fewer knockouts will be selected over designs with similar phenotypes, but more knockouts. Fewer knockouts are desirable for ease of strain construction.
Theoretical analysis of the production potential in E. coli
The maximum production potential for E. coli was determined by: i.) defining a substrate condition, ii.) setting a minimum growth rate (μ) of 0.1 hr−1 (as set by the amount of flux necessary through the BOFCORE) to simulate (at least) a minimal amount of growth, and iii.) maximizing the flux possible (i.e., the production rate) through the exchange reaction that correlated to each product analyzed using FBA. Computational minimal media (Feist et al., 2007) was used for the simulations with the exception of the main carbon substrates and the presence of oxygen as specified. An uptake value of 20 mmol gDW−1 hr−1 was used for the substrates and oxygen, when present.
Pre-processing of the model for computation
Before calculation of strain designs, the model was preprocessed under the following procedure after setting the primary carbon substrate and presence/absence of oxygen, in addition to the constraints necessary for computational minimal media conditions (Feist et al., 2007). Preprocessing was condition specific and was done for each culture condition examined. Model pre-processing was six step process (see Figure 2).
Figure 2. Problem Formulation: Reduction of model and selection of targeted reactions.
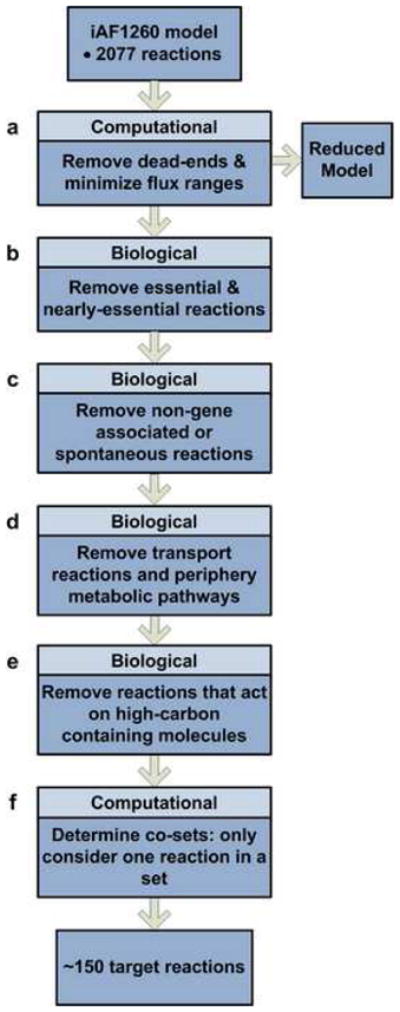
Method used to acquire target reactions for deletion from the E. coli genome and to reduce computation time. For the six steps, four are based off biological assumptions and two are computational approaches.
The goal of preprocessing was to eliminate certain reactions from the model’s total reaction set to obtain a smaller set of selected reactions that could serve as valid targets for gene knockouts. First, all reactions that could not be utilized for a given condition, in other words those reactions that had maximum and minimum fluxes equal to zero, were removed. Furthermore, the upper and lower bounds were set to values that were potentially obtainable given the input conditions (instead of arbitrarily high and low values, respectively). This step generated the ‘reduced’ model. Next, to further narrow down the list of reactions to consider for removal, all reactions that had been experimentally found to be essential for growth were removed from consideration (Baba et al., 2006; Joyce and Palsson, 2008; Joyce et al., 2006). Also removed were reactions that were found to be computationally essential, such that when the reactions were knocked out, the growth was reduced to less than 5% of the wild type. Non-gene associated reactions as well as spontaneous and diffusion reactions were excluded due to the fact that biological knockouts of these reactions are impossible. Reactions from certain subsystems that were determined to be excluded were also removed, including cell envelope biosynthesis, glycerophospholipid metabolism, inorganic ion transport and metabolism, lipopolysaccharide biosynthesis and recycling, membrane lipid metabolism, murein biosynthesis, murein recycling, inner membrane transport, outer membrane transport, outer membrane porin transport, and tRNA charging. Reactions that act on molecules containing more than a certain number of carbons (7 carbons) were removed from the pool as they are unlikely to carry high flux in the production of the metabolite targets examined from the given substrates. Lastly, for coupled reactions, only one reaction per set was included, since knockouts are equivalent. Other reactions that were manually removed included those that dealt with glycogen production, as glycogen is a generalized molecule in the network and those that contained thioredoxin and flavodoxin, as these compounds role are poorly characterized. By removing these reactions from the full model, the solution space that the OptKnock and OptGene algorithms search was significantly decreased, effectively reducing computation time.
Results
Selection of substrate and products for analysis
Although E. coli can utilize a number of individual substrates for growth, we determined three primary E. coli substrates for this analysis that will be practical in terms of cost and availability and possess unique design potential (e.g., glucose and fructose are not unique and are examples of interconverted substrates with little to no cost to the cell). These substrates are glucose, xylose, and glycerol. Hexoses (represented by glucose) and pentoses (represented by xylose) will be the substrates available from plant material and are expected to become more prevalently available with the push towards biofuels and bio-based products (Perlack et al., 2005). Glycerol is becoming more prevalently available as it is a byproduct of biodiesel production (Ma and Hanna, 1999). Additional substrates, such as 4-carbon substrates, can be seamlessly added as design substrates in future analyses as this computational platform is easily updatable. Additionally, both anaerobic and aerobic conditions were analyzed for this study to examine the range of products that can be coupled to growth under these two different respiratory conditions.
The products included in the study were chosen by analyzing metabolites in the network that possess either commercial value or are representative molecules from key points in metabolism. Compounds that contained commercial value were determined by evaluating, i.) large-scale reports released by federal agencies, such as the U.S. Department of Energy, which identify key platform chemicals (2004; Paster et al., 2003), ii.) products that are currently under production on a large-scale (such as organic (Sauer et al., 2008) and amino acids (Leuchtenberger et al., 2005)), and iii.) metabolites that have had high profile attention in the literature (Bailey, 1991). The final list of metabolites examined as targets is listed in Table 1.
Table 1.
Theoretical maximum production analysis
| Substrate | Glucose | Xylose | Glycerol | Glucose | Xylose | Glycerol | |
|---|---|---|---|---|---|---|---|
| Aerobicity | Anaerobic | Anaerobic | Anaerobic | Aerobic | Aerobic | Aerobic | |
| product | no. of carbons | Yp/s | Yp/s | Yp/s | Yp/s | Yp/s | Yp/s |
| Ethanol | 2 | 49%* | 49%* | 49% | 49% | 49% | 54% |
| D-Lactate | 3 | 95%* | 95%* | 13% | 95% | 95% | 97% |
| Glycerol | 3 | 37% | 27% | 75% | 74% | ||
| L-Alanine | 3 | 95%* | 76% | 13% | 95% | 93% | 96% |
| L-Serine | 3 | 47% | 35% | 6% | 115% | 114% | 116% |
| Pyruvate | 3 | 71% | 60% | 6% | 100% | 99% | 100% |
| Fumarate | 4 | 54% | 40% | 5% | 110% | 108% | 117% |
| L-Malate | 4 | 63% | 46% | 5% | 127% | 125% | 135% |
| Succinate | 4 | 93% | 81% | 12% | 104% | 101% | 111% |
| 2-Oxoglutarate | 5 | 40% | 32% | 3% | 98% | 96% | 101% |
| L-Glutamate | 5 | 44% | 36% | 3% | 92% | 90% | 97% |
indicates anaerobic condition where homofermentation of product is possible (< 2% wt% other carbon products, CO2 exempt), all aerobic conditions except hydrogen have homofermentation potential
Theoretical analysis of the production potential in E. coli
To evaluate the efficiency of the strain design process and to identify target metabolites, an initial theoretical analysis was performed to define the maximum production potential in E. coli for the selected targets. These potentials were based on the content in the iAF1260 model (Feist et al., 2007), a comprehensive parts list of the cell detailing the available content for cellular transformation of the substrates. This analysis was performed by: i.) setting an uptake rate of 20 mmol gDW−1 hr−1 of each main carbon substrates and 20 mmol gDW−1 hr−1 O2 when specified; values near experimentally measured maximum uptake rates (Varma et al., 1993), ii.) setting a minimal growth rate (μ) that E. coli must achieve to sustain growth, 0.1 hr−1, and iii.) using FBA to maximize the flux through each of the exchange reactions in the model for the targeted products. The results from this analysis are given in Table 1.
From this analysis, a number of conclusions can be drawn to both understand the theoretical potential for production with E. coli and validate the analysis. The results are presented for anaerobic and aerobic conditions.
Anaerobic conditions
The maximum weight yield for each target (product) is found for glucose and, as expected, is successively less (or the same as) for xylose and glycerol, respectively. This is due to a higher percentage of the incoming carbon to the cell being necessary to account for the biomass production required to achieve the set minimum growth rate (0.1 hr−1) for xylose and glycerol. The most obvious conclusion from analyzing anaerobic conditions is that production from glycerol anaerobically of any metabolite besides ethanol has a very poor potential yield (< 15% in each case). This result is in agreement with previous studies (Dharmadi et al., 2006; Murarka et al., 2008). The trends for theoretical yield between glucose and xylose are very similar with the yields being, on average, 10% higher on glucose. The compound L-alanine had a much higher than average yield on glucose over xylose as a substrate, whereas those for ethanol and lactate are approximately the same. For both glucose and xylose, lactate, L-alanine, and succinate showed the highest potential maximum yields. Alternatively, glycerol, 2-oxoglutarate, L-glutamate, and L-serine were predicted to have the lowest theoretical production potential.
Aerobic conditions
Aerobically, the theoretical yields are predicted to be highest on glycerol with the yields being similar from glucose and xylose. Different from anaerobic conditions, a number of products can potentially be made in higher titers on glycerol aerobically. The reason that many of the theoretical yields are over 100% is in part due to the fact that the phosphoenolpyruvate carboxylase reaction can carry a high flux in these theoretical calculations and fix carbon dioxide that is incorporated into many of the products. Overall, the average yields were 2% higher on glucose than on xylose and approximately 5% higher on glycerol than glucose or xylose. Looking at specific products, L-malate, L-serine, and fumarate showed the highest aerobic production potential, while ethanol and glycerol showed relatively poor theoretical yields.
Comparison of anaerobic and aerobic conditions
For each of the three substrates, the maximum theoretical yield increased, or stayed the same, in aerobic conditions. This is expected because when adding more inputs to the system, the solution space can only expand. What is most interesting are the cases that stayed the same when allowing oxygen as an input. This occurred for ethanol and lactate production on glucose and xylose and for L-alanine production on glucose (all less than 0.1% increase). The average increases in potential yield between the two conditions were 31%, 39%, and 83% for glucose, xylose, and glycerol, respectively. The higher yields for glycerol are due to the fact that the amount of oxygen incorporated into the product is greater per weight basis for glycerol than for glucose or xylose. Target products that were predicted to have the greatest increase in production potential aerobically included L-serine, L-malate, 2-oxoglutarate, fumarate, and L-glutamate.
Homofermenting strain designs
Homofermenting strains are those that produce a single product from fermentation of the main substrate. These strains are desirable in that they are not only likely to possess a high yield, but also offer an advantage as they reduce the number of different products that must be separated after fermentation. The strains that have the potential to be homofermentors under anaerobic conditions are indicated in Table 1. All strain designs were predicted to be homofermentors aerobically. For this analysis, homofermenting strains were categorized as those that were predicted to have less than 2% wt% carbon-containing fermentation products besides the main product. Carbon dioxide was not considered as a byproduct in the analysis as it does not require a separation step due to its low solubility and its ability to escape as a gas in fermentation conditions. For anaerobic fermentation, succinate is an essential byproduct (at a very small amount, less than 1 wt% in most cases) when using the iAF1260 reconstruction in modeling simulations. Therefore, it will be a byproduct of all anaerobic condition predictions. Out of the 32 different theoretical maximum predictions anaerobically, five designs were predicted to possess the potential for homofermentation. This included three different compounds and two different substrate conditions.
These results, in themselves, define the targets and conditions for which modification of wild-type E. coli content has the greatest potential. Supplementary Table 2 contains additional results for this analysis in terms of molar yields. Herein, these results were used for comparison with yields achieved for growth-coupled stain designs for E. coli. As production of any compound from glycerol anaerobically besides ethanol resulted in a low theoretical yield, it was not included in the analysis. Furthermore, simulations for the growth-coupled production of compounds from glycerol aerobically were only examined for a higher number of allowable network knockouts. This was due to the assumption that growth-coupling of compounds to glycerol would require more metabolic interventions to produce compounds from this low carbon substrate.
Strain Design: Model pre-processing and selection of target reactions for elimination
In order to both decrease computation time and to limit the elimination of reactions in E. coli to those that are biologically relevant knock-out targets for diverting metabolite flux, the model was preprocessed as outlined in Figure 2. In short, these engineering assumptions were based on biologically relevant and practical principals (steps b–d) and computational approaches (steps a and f). An example of a biologically relevant reduction of targets for removal was that reactions that spontaneously occur inside of the cell were not considered as they have no catalyzing enzyme (step c). The reduction resulted in both a model with reactions and reaction bounds that were only relevant to the input conditions for which the analysis was run (Table 2), and a set of biologically relevant reactions for elimination with the strain design algorithms. The average number of reactions that were eliminated from the total 2077 in the iAF1260 reconstruction (Feist et al., 2007) was 92.6% across the different substrate conditions (Table 2). Additional substrate conditions are given in Supplementary Table 3.
Table 2.
Substrate conditions
| Carbon Substrate(s) | Aerobicity | Wild Type Growth Rate | Target Reactions After Reduction of Scope |
|---|---|---|---|
| Glucose | Anaerobic | 0.459 | 142 |
| Xylose | Anaerobic | 0.319 | 141 |
| Glycerol | Anaerobic | 0.119 | 140 |
| Glucose | Aerobic | 1.276 | 170 |
| Xylose | Aerobic | 1.131 | 165 |
| Glycerol | Aerobic | 0.983 | 166 |
Maximum uptake rates for primary carbon sources were set to 20 mmol/gDW−1 hr− 1. In aerobic simulations, maximum oxygen uptake rate was set to 20 mmol/gDW−1 hr−1.
Strain Design: Algorithm computation and output
To design strains of E. coli that overproduced the defined target metabolites, we used a combination of the OptKnock (Burgard et al., 2003) and OptGene (Patil et al., 2005) algorithms with the conditioned model of iAF1260 (Feist et al., 2007). The procedure utilized for this analysis is outlined in Figure 3 (see also, Methods). First, OptKnock was utilized to design strains of E. coli for each substrate/target pair in Table 1 for a maximum of 3 and 5 reaction knock-outs allowed (with the exception that glycerol was not selected as a substrate for OptKnock simulations, see above). Each simulation was allowed to run to completion, so that the entire solution space was searched. OptKnock was utilized first as it evaluates the maximum achievable yield given a set number of knock-outs and finds the global optimal set of knockouts as long as such a solution exists. Final and intermediate strain designs from OptKnock were summarized and evaluated for: i.) the category of production envelope they returned (see Figure 1), and ii.) the maximum production potential (e.g., yield) achieved. All of the designs identified in the OptKnock analysis are given in Supplementary Data. After completion of this step, the resulting strain designs were used as a base population for the appropriate substrate/target pair for the OptGene algorithm (except for glycerol, as mentioned). OptGene simulations were then conducted for the objectives of maximum yield (for verification of the OptKnock solutions and for higher knockout designs), substrate-specific productivity, and strength of growth coupling. Results for each analysis and for specific targets are now detailed.
OptKnock analysis of maximum yield for three and five knockout designs
After the first set of simulations was completed for analyzing maximum yield achievable for three and five knockout designs, growth-coupled designs could be found for 26 different substrate/targets pairs. The results of this analysis are given in Table 3. The production envelopes resulting from the analysis for five different targets for the given substrates are given in Figure 4 and in Supplementary Figure 1. Overall, this number was 59% out of the potential 44 combinations examined and it demonstrates that target production could be coupled to growth in most of the cases examined. Furthermore, for the 26 different pairs, growth-coupled designs could be identified for both three and five knockout designs in 20 out of the 26 cases resulting in a total of 46 different designs. For five different targets, designs could be found in all of the conditions examined. For three other targets, designs were found under some of conditions examined and for the last three, no designs could be identified. This indicates that for the scope of metabolites targeted, if a solution could be found for one condition for a given substrate/target pair, it could be found in the others given these knockout limits in most of the cases. When comparing the results to the theoretical maximum achievable, 13 different substrate/target pairs were at or above 80% of the calculated theoretical maximum achievable (five different targets). These targets were not directly correlated with the number of carbons of the target molecule as designs were found for all categories of metabolite carbon number except for compounds with five carbons (2-oxoglutarate and L-glutamate). The full set of final optimal and intermediate designs (found during the optimization in route to the maximum value) for maximum yield are given in Supplementary Data (in this section, only the final optimal solutions were discussed).
Table 3.
Strain design properties designed using the OptKnock algorithm
| Glucose | Xylose | Glucose | Xylose | |
|---|---|---|---|---|
| Anaerobic | Anaerobic | Aerobic | Aerobic | |
| product | 3KO/5KO/%TMP | 3KO/5KO/%TMP | 3KO/5KO/%TMP | 3KO/5KO/%TMP |
| Ethanol | 36.9*/38.4*/100% | 31.1*/31.6*/99% | 25.5*/36.2*/94% | 19.2*/30.7*/96% |
| D-Lactate | 36.2*/38.4*/100% | 30.7*/31.0*/97% | 16.8*/35.5*/92% | 11.9*/30.5*/96% |
| Glycerol | - | - | -/13.4/45% | - |
| L-Alanine | -/38.0*/99% | - | -/24.3*/63% | -/14.8*/47% |
| L-Serine | - | - | - | - |
| Pyruvate | 14.2/19.1/65% | 13/15.6/75% | 24.2/33.7*/81% | 19.8*/27.2*/80% |
| Fumarate | 0.3/0.3/2% | 0.2/0.2/2% | 5.8/6.9/20% | 9.1/10.1/36% |
| L-Malate | - | - | - | - |
| Succinate | 18.2/25.9/90% | 19.2/19.3/92% | 2.6/17.8/55% | 7.9/19.3/73% |
| 2-Oxoglutarate | -/3.0/30% | -/1.9/28% | - | - |
| L-Glutamate | - | - | - | - |
3KO – maximum optimal production rate achievable with 3 knock-outs, 5KO – maximum optimal production rate achievable with 5 knock-outs, %TMP – percentage of the theoretical maximum achievable optimal production rate for the 5KO design, ‘-’ – no design found
indicates condition where homofermentation of product is possible (< 2% wt% other carbon products, CO2 exempt)
Figure 4. The strain designs generated for five different targets from glucose and xylose anaerobically.
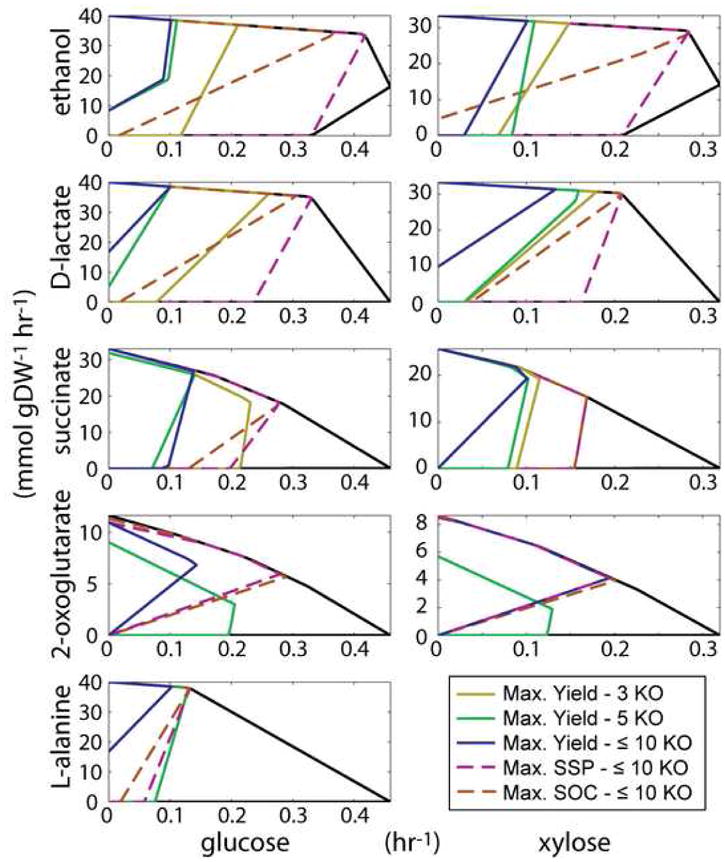
A set of graphs that give the production envelopes for different substrate/target pairs that were calculated during the analysis under anaerobic conditions. The different target production rates (mmol gDW−1 hr−1) are shown on the y-axis and the growth rate (hr−1) is given on the x-axis. Shown on each plot (if a solution exists) are the maximum yields, Yp/s, for 3 knockouts (yellow, solid line), 5 knockouts (green, solid line), up to 10 knockouts (with a 99.99% deletion penalty, blue, solid line), the maximum substrate-specific productivity (SSP, pink, dashed line), and the maximum strength of growth coupling (SOC, orange, dashed line) design. For example, there are no valid solutions for L-alanine production on xylose given the minimum growth rate of 0.1 hr−1.
Conclusions can be drawn for the extent of interventions (i.e., number of knockouts) necessary to couple production of a metabolite to growth by comparing the designs resulting from allowing either three or five knockouts. The cases where knockout designs could only be found with the five knockout limit (i.e., a 3 reaction knockout design was not possible) were examined. This occurred for the production L-alanine, 2-oxoglutarate, and glycerol. These results indicate that these products require a more complex set of interventions to couple production to growth. Interestingly, the production of L-alanine can be coupled to growth at a very high percentage of the theoretical max (99%) given five different reaction eliminations. The other products for which only a five knockout design could be found did not possess a high percentage of the theoretical maximum (less than 50% in all cases). For cases where both a three and five knockout design were found, addition of the two knockouts in the five knockout designs gave an average increase of 11% and 121% wt% in yield under anaerobic and aerobic conditions, respectively. Increases varied significantly from these means depending on the target, with the median increases being 3% and 51% wt% for anaerobic and aerobic conditions, respectively. This increase in production potential with an increasing knockout number will be further discussed below.
A number of designs calculated from the three and five knockout analysis are predicted to be homofermentors. As stated earlier, these strains are desirable from the aspect of separation of fermentation products as only one product is made. From the analysis, 22 different designs are predicted to be homofermentors, 48% of the total designs. Given the limit of three knockouts, nine substrate/target pairs were predicted to be homofermentatively generated and an additional four pairs were included in this total when five knockouts was the design limit. From these results, four different products could be made homofermentatively, ethanol, D-lactate, L-alanine, and pyruvate. Additional designs calculated using these results as inputs can be examined and compared to the potential yield with higher numbers of designs. With these results as a basis, further computations were performed examining higher numbers of knockouts and additional optimization criteria (Figure 1) using the OptGene algorithm.
OptGene analysis for maximum yield, substrate-specific productivity, and strength of growth coupling for up to 10 knockouts
The OptGene algorithm was utilized to examine growth-coupled strain designs of E. coli with a higher limit of knockouts and additionally, non-linear objectives such as substrate-specific productivity (SSP) and strength of coupling (SOC). OptGene is a genetic algorithm and has the advantages of utilization of a non-liner objective and potentially faster run-times to find an optimal solution. One potential drawback is that it does not ensure that an optimal solution is found for the space examined (Patil et al., 2005). Nonetheless, it has been shown to calculate strain designs efficiently (Patil et al., 2005) and the role OptGene played in the analysis is outlined in Figure 3. As the final and intermediate solutions from the three and five knockout designs from OptKnock were used as an initial population for the algorithm (i.e., inputs), the calculations from this step were both solution filtering steps (e.g., if an intermediate solution found with OptKnock had a higher SSP than the final maximum yield design, it would be chosen) and improvements made to the existing solutions along with finding new solutions.
The results from the examination of the different objective functions using the OptGene algorithm and outlined method (Figure 3) are given in Tables 4–6. Each Table summarizes the results from examining the different objective functions and therefore, each will be discussed separately.
Table 4.
Strain design properties designed using the OptGene algorithm – maximum yield
| Glucose | Xylose | Glucose | Xylose | Glycerol | |
|---|---|---|---|---|---|
| Anaerobic | Anaerobic | Aerobic | Aerobic | Aerobic | |
| product | P/KO/%TMP | P/KO/%TMP | P/KO/%TMP | P/KO/%TMP | P/KO/%TMP |
| Ethanol | 38.5*/7/100% | 31.8*/9/100% | 37.9*/10/98% | 31.7*/7/100% | 18.6*/7/86% |
| D-Lactate | 38.5*/8/100% | 31.4*/10/98% | 37.7*/10/98% | 31.3*/10/98% | 18.6*/10/93% |
| Glycerol | 2.1/10/14% | - | 19.4/10/66% | 13.2/7/55% | N/A |
| L-Alanine | 38.5*/10/100% | - | 31.1*/10/81% | 22.4*/5/71% | 14.3*/8/72% |
| L-Serine | - | - | - | - | - |
| Pyruvate | 19.8/7/67% | 16.3/10/78% | 38.6*/10/93% | 31.5*/10/92% | 18.3/10/86% |
| Fumarate | 0.3/3/2% | 0.2/3/2% | 8.1/7/23% | 11.3*/10/40% | 8.3/9/44% |
| L-Malate | - | - | - | - | - |
| Succinate | 26.9/8/93% | 19.3/6/92% | 18.9/10/59% | 19.3/9/74% | 8.9*/10/51% |
| 2-Oxoglutarate | 6.8/10/69% | 4.1/9/62% | 15.7*/10/64% | 14.3*/10/71% | - |
| L-Glutamate | - | - | - | - | - |
P – maximum optimal production rate achievable, KO – the number of knockouts needed to achieve the given production rate, %TMP – percentage of the theoretical maximum achievable optimal production rate, ‘-’ – no design found, N/A – not applicable
indicates condition where homofermentation of product is possible (< 2% wt% other carbon products, CO2 exempt)
Table 6.
Strain design properties designed using the OptGene algorithm – maximum strength of growth coupling
| Glucose | Xylose | Glucose | Xylose | Glycerol | |
|---|---|---|---|---|---|
| Anaerobic | Anaerobic | Aerobic | Aerobic | Aerobic | |
| product | P/GCP/KO max. GCP max. Yp/s |
P/GCP/KO max. GCP max. Yp/s |
P/GCP/KO max. GCP max. Yp/s |
P/GCP/KO max. GCP max. Yp/s |
P/GCP/KO max. GC max. Yp/s |
| Ethanol | 34.5*/100%/6 | 28.3*/100%/2 | 31.5/100%/7 | 28.3*/100%/5 | 17.7*/100%/8 |
| 38.5*/100%/7 | 31.8*/71%/9 | 37.9*/45%/10 | 31.7*/55%/7 | 18.6*/87%/7 | |
| D-Lactate | 35.2*/100%/6 | 30.3*/100%/5 | 35.2*/100%/9 | 30.3*/100%/8 | 18.1*/85%/6 |
| 38.5*/100%/8 | 31.4*/100%/10 | 37.7*/89%/10 | 31.3*/83%/10 | 18.6*/85%/10 | |
| Glycerol | 2.1/3%/10 | - | 19.4/88%/10 | 9.7/30%/7 | N/A |
| 2.1/3%/10 | - | 19.4/88%/10 | 13.2/21%/7 | N/A | |
| L-Alanine | 37.9*/85%/7 | - | 19.3/38%/10 | 22.4*/37%/7 | 14.3*/24%/8 |
| 38.5*/100%/10 | - | 31.1*/37%/10 | 22.4*/37%/7 | 14.3*/24%/8 | |
| Pyruvate | 19.1/62%/8 | 15.7/34%/6 | 32.3*/90%/10 | 26.1*/100%/10 | 14.6*/59%/10 |
| 19.8/100%/7 | 16.3/35%/10 | 38.6*/100%/10 | 31.5*/100%/10 | 18.3/22%/10 | |
| Fumarate | 0.3/6%/10 | 0.2/6%/10 | 7.7/13%/10 | 8.5/22%/9 | 6.4/14%/10 |
| 0.3/3%/3 | 0.2/3%/3 | 8.1/2%/7 | 11.3*/12%/10 | 8.3/8%/9 | |
| Succinate | 17.8/100%/4 | 15.4/100%/3 | 6.8/100%/9 | 11.7*/100%/9 | 3.2/100%/7 |
| 26.9/100%/8 | 19.3/100%/6 | 18.9/38%/10 | 19.3/41%/9 | 8.9*/100%/10 | |
| 2-Oxoglutarate | 5.7/100%/7 | 3.9/100%/7 | 13.3*/100%/8 | 11.8*/100%/8 | - |
| 6.8/100%/10 | 4.1/100%/9 | 15.7*/3%/10 | 14.3*/4%/10 | - |
P – maximum optimal production rate achievable, GCP – growth coupling parameter, percent of growth rate that is coupled with target production (see Figure 1, the percent gamma is of the growth rate), KO – the number of knockouts needed to achieve the given production rate, ‘-’ –no design found, N/A – not applicable
indicates condition where homofermentation of product is possible (< 2% wt% other carbon products, CO2 exempt)
Analysis of maximum yield for up to ten knockout designs
The analysis of maximum yield using OptGene was able to improve the potential yield and find designs for some target/substrate pairs with a higher allowance of knockouts that were not previously identified. For the analysis, OptGene was run using maximization of the yield with a tilted objective function, a deletion penalty of 99.99% (see Methods), and a maximum allowable number of ten knockouts. Utilizing these parameters for the analysis, it was possible to identify improvements in the maximum predicted yield for 28 substrate/target pairs, with 18 (64%) of these being slight improvements (an increase less than 5%). This comparison was valid for examining increases in production from glucose and xylose as substrates. Additionally, four of these the cases were designs which were earlier not found with the five knockout limit (see below). This total does not include any designs utilizing glycerol as a substrate, as these we not analyzed with the lower knockout limit (see above). In total, there were 6 different targets that could be coupled to growth using glycerol as a substrate in aerobic conditions.
There were additional substrate/target pair designs that could be identified using the increased number of knockouts. Specifically, the production of 2-oxoglutarate could be coupled to growth aerobically from glucose and xylose as substrates with 64% and 71% of the theoretical maximum potential achievable, respectively. These designs are also homofermenting designs Additionally, there was also a significant increase in the ability to couple the production of 2-oxoglutarate to growth anaerobically on glucose and xylose as well, with increases of 38% and 33% in the theoretical maximum potential achievable, respectively. The same results were observed for the production of glycerol from xylose aerobically, where the allowance of more knockouts resulted in finding a previously unidentified growth coupled solution, at 55% the theoretical maximum. Three was also a significant increase, 20% of the theoretical maximum, for production of glycerol from xylose anaerobically and a design could be identified for glycerol production from glucose anaerobically, as well. Examining the products that could be coupled to growth aerobically on glycerol, the production of ethanol, lactate, and pyruvate could all be coupled to growth with over 80% of the theoretical maximum potential predicted. Fumarate, L-alanine, and succinate could also be coupled to growth. These cases represent instances where growth coupling is only achievable (or better achievable) with more complex metabolic inventions to cellular metabolism.
The results from the OptGene analysis sheds some light on the point at which additional knockouts are no longer beneficial to increase yield. Although many of the designs returned have the maximum number of knockouts, ten, there are several cases where the minor deletion penalty deterred additional unbeneficial knockouts. This occurred in 17 out of the 36 cases where solutions were found. There were no target metabolites for which every OptGene design had the maximum number of knockouts. However, there were four target metabolites where all but one of the optimal solutions had the maximum number of knockouts: D-lactate, pyruvate, 2-oxoglutarate, and glycerol. Another interesting result is that for the anaerobic production of fumarate. The maximum production achievable was with only 3 knockouts. This was the only case where the number of knockouts decreased from the initial design of five indicating that additional knockouts over three are not beneficial to this low producing design. These findings will be further addressed below.
Analysis of maximum substrate-specific productivity for up to ten knockout designs
In addition to optimizing for the maximum yield achievable for a given condition, the additional property of optimizing for maximum substrate-specific productivity was examined. These strains are desirable as they have the potential to maximize the rate of production for a given substrate/target pair as the growth rate is factored into the calculation. Figure 4 and Table 5 present the results from this analysis. By examining the different envelopes on the same plot in Figure 4, it is possible to visualize the tradeoff between yield and growth rate for maximum SSP designs. Table 5 gives both the SSP for the optimal SSP design and the optimal maximum yield design for comparison.
Table 5.
Strain design properties designed using the OptGene algorithm – maximum substrate-specific productivity
| Glucose | Xylose | Glucose | Xylose | Glycerol | |
|---|---|---|---|---|---|
| Anaerobic | Anaerobic | Aerobic | Aerobic | Aerobic | |
| product | P/SSP/KO max. SSP max. Yp/s |
P/SSP/KO max. SSP max. Yp/s |
P/SSP/KO max. SSP max. Yp/s |
P/SSP/KO max. SSP max. Yp/s |
P/SSP/KO max. SSP max. Yp/s |
| Ethanol | 33.3*/13.9/2 | 28.8*/8.2/2 | 16.6*/19.4/3 | 13.4*/12.0/3 | 8.3*/4.7/7 |
| 38.5*/3.9/7 | 31.8*/3.2/9 | 37.9*/4.9/10 | 31.7*/3.2/7 | 18.6*/1.9/7 | |
| D-Lactate | 34.7*/11.5/2 | 30.0*/6.3/2 | 17.1*/19.3/4 | 13.3*/12.1/5 | 8.3*/4.8/6 |
| 38.5*/3.9/8 | 31.4*/4.2/10 | 37.7*/4.2/10 | 31.3*/3.2/10 | 18.6*/1.9/10 | |
| Glycerol | 2.1/0.5/10 | - | 14.7/12.3/6 | 12.6/8.8/6 | N/A |
| 2.1/0.5/10 | - | 16.9/2.2/10 | 13.2/1.5/7 | N/A | |
| L-Alanine | 37.9*/5.0/6 | - | 19.1*/18.9/6 | 14.8*/12.1/5 | 7.8*/4.8/8 |
| 38.5*/3.9/10 | - | 31.1*/4.8/10 | 14.8*/12.1/5 | 7.8*/4.8/8 | |
| Pyruvate | 18.8/5.8/6 | 15/3.1/6 | 22.0*/23.0/3 | 16.3*/14.9/2 | 9.9*/5.8/4 |
| 19.8/2.0/7 | 16.3/1.7/10 | 38.6*/2.8/10 | 31.5*/4.4/10 | 18.3/2.1/10 | |
| Fumarate | 0.3/0.1/3 | 0.2/0.1/3 | 8.1/3.8/7 | 8.8/7.1/6 | 8/4.5/7 |
| 0.3/0.1/3 | 0.2/0.1/3 | 8.1/3.8/7 | 11.3*/1.5/10 | 8.3/4.1/9 | |
| Succinate | 18.3/5.1/5 | 15.4/2.6/3 | 14.7/14.3/9 | 11.7*/10.3/6 | 5.6*/4.1/6 |
| 26.9/3.7/8 | 19.3/1.9/6 | 18.9/2.9/10 | 19.3/1.9/9 | 8.9*/4.0/10 | |
| 2-Oxoglutarate | 5.9/1.7/9 | 4.1/0.8/9 | 15.7*/10.8/10 | 11.8*/8.8/8 | - |
| 6.8/1.0/10 | 4.1/0.8/9 | 15.7*/10.8/10 | 14.3*/7.1/10 | - |
P – maximum optimal production rate achievable, SSP – substrate specific productivity, KO –the number of knockouts needed to achieve the given production rate, ‘-’ – no design found,, N/A – not applicable
indicates condition where homofermentation of product is possible (< 2% wt% other carbon products, CO2 exempt)
Optimization of the SSP resulted in an overall increased productivity over maximum yield simulations for most of the cases examined. The increase in SSP overall for anaerobic and aerobic conditions was 75% and 221%, respectively. Clearly, the potential for SSP improvement is greatest under aerobic conditions. However, a significantly larger decrease in yield, 31%, has to be accepted (compared to 8% for anaerobic conditions) for the inherent tradeoff when considering maximum SSP under aerobic conditions. Some of the largest increases in SSP were encountered for ethanol (257% and 155%), D-lactate (198% and 50%), and pyruvate (191% and 82%) from glucose and xylose anaerobically, respectively. Under aerobic conditions, the percent increases are much more drastic and in some cases are over four fold (e.g., pyruvate production from glucose aerobically, 731% increase and glycerol production from xylose aerobically, 484% increase). These trends can be further seen by examining Figure 4 for anaerobic conditions and Supplementary Figure 1 for aerobic conditions. Furthermore, the strains that are homofermentors are also marked on the table indicating that although there is a tradeoff for yield, homofermentation is still possible for maximum SSP designs (21 of the designs are homofermenting designs).
Analysis of maximum strength of growth-coupling for up to ten knockout designs
Similar to the maximization of substrate-specific productivity, optimizing for maximum strength of growth-coupling produces desirable production phenotypes. These strain designs show the characteristic of having a stronger likelihood of evolving to the predicted production phenotype with and increasing growth rate. This characteristic is advantageous when using the process of adaptive evolution (Fong and Palsson, 2004; Ibarra et al., 2002) to evolve growth-coupled production strains to their optimal phenotypes. A metric that we used to characterize this level of growth coupling is the growth coupled parameter (GCP) which is the percentage of the growth rate that is growth-coupled (the percent gamma is of growth rate in Figure 1). The results from an analysis optimizing for maximum strength of growth-coupling is given in Table 6.
The production of the target metabolites examined revealed that optimization for SOC produces strain designs that have fully coupled production phenotypes (100% GCP) and this property can be increased over maximum yield designs. The optimal SOC design was an increase in the GCP metric for 3 substrate/target pairs aerobically and in 15 cases aerobically. As the GCP metric is not the actual optimization parameter, the value can also decrease with maximum SOC optimization. A decrease was seen in 3 and 1 cases anaerobically and aerobically, respectively. However, the GCP was chosen as a value to quantify the SOC as it can be easily understood by examining the relationship between gamma and growth rate.
Characterization of the solution space: reactions that contribute to designs and the relationship between number of knockouts and metabolite production
In total, the designs calculated during this analysis contain the reactions that allow the diversion of flux in the E. coli network while still generating sufficient energy and biomass precursors. To summarize this set of reactions, all of the optimal and intermediate solutions were complied and all of the reactions participating in this set were identified. In total, 132 reactions, or 77% of possible reaction knockouts, were in this pool and the full list of reactions is given in Supplementary Data. From this pool, some reactions participated more often in growth-coupled designs. Pyruvate formate lyase, pyruvate dehydrogenase, and acetate kinase occurred around eight times more often than the average of 19 solutions per reaction. Lactate dehydrogenase, acetaldehyde dehydrogenase, and phosphoglycerate dehydrogenase all occurred more than four times as often as the average. The uneven distribution of reaction knockout occurrences suggests that certain reactions are critical hubs for diverting carbon flux.
In total, the design space for growth-coupled designs for 11 different targets was analyzed for up to ten reaction knockouts. From this, we characterized the production potential achievable given a number of knockouts for different substrates. Figure 5 gives the relationship between production potential and number of knockouts for anaerobic conditions. The production potential metric given is the percent theoretical maximum achievable as a function of number of knockouts. The production of each of the targets can be categorized into three different classes: i.) theoretical maximum (or very near) achievable, ii.) moderate production achievable with increasing interventions, and iii.) low production potential regardless of number of interventions. Targets such as ethanol, lactate, succinate, L-alanine belong in the first category of near or at theoretical production achievable (over 80% of TMP) and all of the targets in this category can be coupled with a relatively low number of knockouts (less than or equal to five knockouts). The production of other metabolites, such as 2-oxoglutarate and pyruvate, can be increased in higher amounts with an increasing number of knockouts. However, even with up to ten knockouts, the production never reached the 80% TMP level. The third category, low production potential (less than 20% TMP) regardless of the number of interventions contains the metabolites glycerol and fumarate. These products cannot be coupled to growth at a high rate given the ten knockout limit used in the analysis. The same type of analysis can be performed for aerobic conditions and is presented in Supplementary Figure 2.
Figure 5. Theoretical maximum production achievable for different substrate/target pairs for under anaerobic conditions.
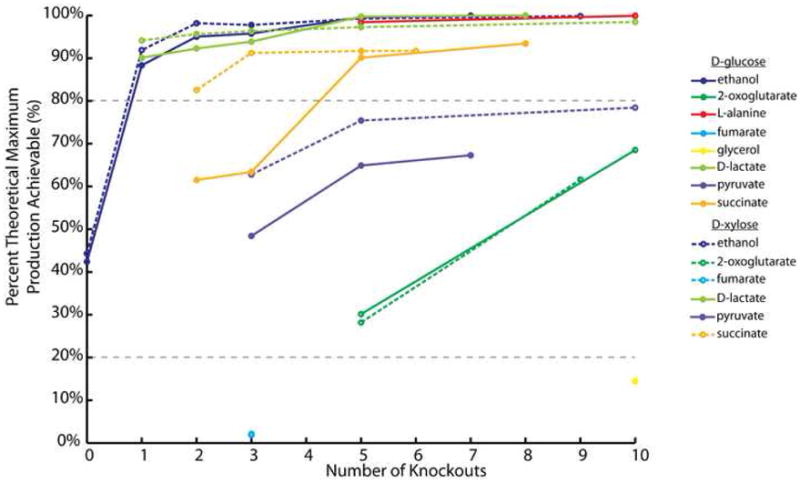
A plot of the percent theoretical maximum production achievable for different substrate (top of column) and target (listed) combinations as a function of number of knockouts allowed to the system. Each point is the maximum value for a given number of knockouts. The plot contains the data from examining growth of E. coli under anaerobic conditions. The lowest number of knockouts for a design can be coupled to growth is the leftmost point for each substrate/target pair. Also shown are the cutoffs (20% and 80%) that delineate the three different categories of designs. The plot characterizes the relationship between the number of knockouts necessary to growth couple a product and achievable production. A number of products can be generated from three knockouts very near to the maximum production achievable.
Discussion
Metabolic engineering of microorganisms is a powerful tool that can be used to generate renewable compounds and products for a growing human population. Systems biology and in silico analysis have the potential to accelerate the production of new strains and products through model-driven analyses. This work presents progress towards this goal through a systematic analysis of the production potential for native products from the bacterium E. coli by examining products that can be coupled to growth rate. Accordingly, the main results from this study are, i.) sets of specific metabolic interventions (i.e., knockouts) that couple metabolite production at a high yield and high rate to growth rate which can be experimentally implemented, ii.) characterization of the production potential design space for native products for E. coli including the key reactions that divert metabolic flux inside the cell, and iii.) an outlined and implementable procedure to examine and characterize the production potential for a given organism. With the increasing adaptation and implementation of the systems biology approach of constraint-based reconstruction and modeling (Feist et al., 2008; Feist and Palsson, 2008; Price et al., 2004), the procedure can be readily adapted to examine a number of organisms-of-interest. For many production organisms, genome-scale reconstructions and models already exist [22].
Growth-coupling has emerged as a design procedure that possesses the potential to integrate model-driven design and strain optimization through adaptive evolution. The adaptive evolution process has been performed and the outcomes characterized (Fong et al., 2003; Fong and Palsson, 2004; Ibarra et al., 2002) and initial computational analyses examining test cases have been performed (Burgard et al., 2003; Fong et al., 2005a). Furthermore, initial work demonstrating experimental feasibility of growth-coupling has been completed (Fong et al., 2005a). However, a rigorous analysis of the design potential was needed to fully examine the range of metabolites that can be produced through coupling to growth. This analysis provides the range and magnitude to which products can be coupled to growth in E. coli. Additionally, coupling production of metabolites to growth has advantages over current production strains as growth-coupled designs are suitable for continuous culture conditions. Continuous culture has a distinct advantage in overall productivity as it can be run for significantly longer periods of time. Production strains that are not growth coupled will ultimately be overtaken by optimally growing mutants in continuous culture conditions where growth rate is the selection pressure (a selective pressure commonly applied to continuous culture). However, the strains presented in this work are fundamentally designed to be the top growers under these steady state conditions and therefore hold significant productivity advantages.
The reactions presented in the analysis were designed to be biologically relevant targets that can be eliminated through genetic manipulation (i.e., reaction knockouts) and tested in an E. coli strain. This was facilitated by the model preprocessing procedure. The top-down model preprocessing approach is a novel procedure that has not been examined in earlier analyses (Burgard et al., 2003; Fong et al., 2005a; Patil et al., 2005; Pharkya et al., 2003; Pharkya et al., 2004), which rely on a bottom-up approach that is more computationally intensive and could inherently miss key reactions. This is due to the fact that they are not rooted in an approach that decides on elimination targets according to function. The knockout genes or reactions selected by these methods could be impractical to implement in vivo. In the present analysis, all of the candidate knockout reactions are biologically relevant. Therefore, these additional measures should provide greater confidence in the feasibility of implementing the reported strain designs.
Designs were reported for three different strain design criteria, each with desirable production qualities. The maximum yield optimizes the amount of substrate that can be converted to the target metabolite and thus can result in a strain with the greatest output per unit input. The analysis of SSP quantifies the tradeoff between yield and productivity. If an overall maximum rate is desirable without considering yield, then optimization of SSP is the best objective. Furthermore, maximum SOC designs have implications in success rates of a strain evolving to the optimal phenotype. Even though designs were reported for each of these design types, a combination of the three properties is probably the best choice. For example, the maximum SOC design for the production of L-alanine from glucose anaerobically in Figure 4 possesses the near optimal properties for all of the criteria.
The production of some metabolites could not be coupled to growth in our analysis. Some of the key parameters relating to this possibility that were used in this analysis are the minimum necessary growth rate, the substrate uptake rate, and the maximum allowable number of knockouts. In regards to the minimum necessary limit that was placed on the growth rate, lowering this value could result in the identification of more designs. However, in doing so, there is the risk that experimental implementation of a strain from this design might result in a lethal combination of knockouts and ultimately a strain that cannot be generated. This result could be possible as there are some modeling assumptions (e.g., maintenance energies) in the modeling approach which might differ from actual requirements in vivo and thus, the cell may not be able generate sufficient energy for growth. There is also the opposite case, where the estimates are greater than the actual requirements in vivo and lowering the minimum growth rate might allow more compounds to be coupled. In the same respect, increasing the uptake rates of the main substrate might also increase the number of strain designs identified. Furthermore, increasing the number of allowable knockouts might also allow the coupling of more products. However, as the plots in Figure 5 indicate, more knockouts do not necessarily correlate with higher production in all cases.
The analysis performed in this study characterizes the solution space for E. coli in regards to the potential of the cell to couple production of the examined metabolites to growth rate. Initially, the theoretical maximum potential analysis framed the scope of the analysis and readily identified native products that can be generated with a high yield given the machinery encoded by E. coli’s genome. For example, the finding that only ethanol could be made with over a 15% yield from glycerol anaerobically demonstrates that at the biological parameters used for simulations, this substrate anaerobically is not a good production feedstock. The biological parameters that were used in the analysis (e.g., maintenance values, minimum growth rates, etc.) predict that most of the energy contained in glycerol has to be devoted to growth of the cell anaerobically. Aerobically, the advantage that oxygen provides as an electron sink allows the potential for higher substrate yields for E. coli growing on glycerol. These yields would change if the actual biological parameters were much different than those used in the analysis (these parameters have been empirically determined from experimental data (Feist et al., 2007)). However, as the design criteria were set in this analysis, as is done for most engineering approaches, this type of modeling can bring these non-starting issues to light. Similarly, the same case can be made for the input parameters, such as substrate uptake rates. Nonetheless, this analysis frames the production capabilities of E. coli and can be readily extended to different medium substrates or supplements, as well as other organisms for which organism-specific models exist (Feist et al., 2008).
The strain designs presented for the different target and substrate pairs, along with performing the analysis for different numbers of knockouts, allows a characterization of the space which is achievable for growth coupling. This topic can be understood by examining the relationships displayed in Figure 5 for each substrate/target pair. The trend of growth-coupled production relative to the number of interventions necessary provides the tradeoff between making more knockouts in a cell and the resulting potential increase in yield (or SSP, SOC, etc.).Taken together, all of the combinations characterize the full production potential of E. coli. It was demonstrated that there are three different classes of metabolite production; theoretical maximum (or very near) achievable, moderate production achievable with increasing interventions, and low production potential regardless of number of interventions. It is expected that this trend will continue as different substrates or targets are analyzed in a similar fashion. However, some compounds in the moderate production category may be able to reach a value neat the theoretical maximum potential achievable.
A way to understand why some products cannot be coupled to growth is the concept of a hierarchy of metabolites which can be excreted from the system while still making energy. This hierarchy is differentiated by how much energy the cell can obtain from a substrate and subsequently how little it has to excrete in a particular metabolite. To engineer E. coli to make one of the products in this hierarchical list, one can think of eliminating pathways to metabolites at the high-energy end of the list and eliminating them one by one until a metabolite of interest is reached. This is of course assuming that it is known how to eliminate the production of metabolites. While performing this elimination of pathways to excrete given metabolites, there will be a point in time where the cell can simply not make the energy it needs to survive by eliminating any more reactions or pathways. This point, or limit, will be defined by the constraints on the system (e.g., the maximum uptake rates of substrates, the minimum growth rate) and some metabolites will lie below this threshold and therefore will not be viable targets in a growth-coupled production scenario. In this analysis, the production of L-alanine could not be produced anaerobically from xylose. However, if the minimum necessary growth rate is lowered (e.g., halved to 0.05 hr-1), a growth-coupled design can be identified.
The workflow and procedure presented in this analysis can be utilized as a platform to perform similar analyses with additional organisms. The combination of using the OptKnock (Burgard et al., 2003) and OptGene (Patil et al., 2005) algorithms in combinations is a novel approach that has not been previously implemented. It combines the speed and versatility of OptGene with the rigorous search potential of OptKnock to efficiently identify strain designs up to a high knockout number for a variety of conditions. Additionally, it strengthens a potential weakness of OptGene to not find global maxima by feeding into it designs that already have optimal characteristics. However, this does not ensure the identification of the global optimal in all cases, but at the least, provides a strong starting point. Furthermore, the tilting of the objective function is a unique way to efficiently eliminate non-unique (see Figure 1) solutions from computations which do not ensure the production of the targeted metabolites, even after successful evolution to optimal growth rate. Tilting not only afforded faster computational run time over performing a separate two step optimization, but also allowed a way to implement non-unique design elimination into the mixed-integer linear programming (MILP) framework of OptKnock. With the advancement of the genome sequencing, the established process of metabolic reconstruction and analysis (Feist et al., 2008; Reed et al., 2006), and this outlined procedure, it should be possible to identify organisms which intrinsically possess production potential for compounds of interest. Furthermore, this process will expand in scope with the computational analysis of adding content to the cell to expand the range of products and potential of native metabolites.
Supplementary Material
Acknowledgments
We would like to thank Kenyon Applebee, Vasiliy Portnoy, DaeHee Lee, Ronan Fleming, Christian Barrett, Byung-Kwan Cho, Karsten Zengler, Pep Charusanti, Young Seoub Park, Yu Qiu, Tom Conrad, Neema Jamshidi, Ines Thiele, Larisa Kagan, Nathan Lewis, Monica Mo, and Harish Nagarajan for their invaluable input and feedback on the project. Research was performed at UCSD were supported by National Institutes of Health Grant GM057089. Bernhard Palsson and UCSD have a financial interest in Genomatica Inc. Although the NIH R01 GM057089 grant has been identified for conflict of interest management based on the overall scope of the project and its potential to benefit Genomatica Inc., the research findings included in this publication do not necessarily directly relate to the interests of Genomatica Inc.
Footnotes
Publisher's Disclaimer: This is a PDF file of an unedited manuscript that has been accepted for publication. As a service to our customers we are providing this early version of the manuscript. The manuscript will undergo copyediting, typesetting, and review of the resulting proof before it is published in its final citable form. Please note that during the production process errors may be discovered which could affect the content, and all legal disclaimers that apply to the journal pertain.
References
- Werpy T, Petersen G, editors. Top Value Added Chemicals from Biomass. U.S. Department of Energy; 2004. [Google Scholar]
- Altaras NE, Cameron DC. Metabolic engineering of a 1,2-propanediol pathway in Escherichia coli. Appl Environ Microbiol. 1999;65:1180–5. doi: 10.1128/aem.65.3.1180-1185.1999. [DOI] [PMC free article] [PubMed] [Google Scholar]
- Atsumi S, Liao JC. Metabolic engineering for advanced biofuels production from Escherichia coli. Curr Opin Biotechnol. 2008 doi: 10.1016/j.copbio.2008.08.008. [DOI] [PMC free article] [PubMed] [Google Scholar]
- Baba T, et al. Construction of Escherichia coli K-12 in-frame, single-gene knockout mutants: the Keio collection. Mol Syst Biol. 2006;2:2006.0008. doi: 10.1038/msb4100050. [DOI] [PMC free article] [PubMed] [Google Scholar]
- Bailey JE. Toward a science of metabolic engineering. Science. 1991;252:1668–75. doi: 10.1126/science.2047876. [DOI] [PubMed] [Google Scholar]
- Barrett CL, et al. Systems biology as a foundation for genome-scale synthetic biology. Curr Opin Biotechnol. 2006;17:488–492. doi: 10.1016/j.copbio.2006.08.001. [DOI] [PubMed] [Google Scholar]
- Becker SA, et al. Quantitative prediction of cellular metabolism with constraint-based models: The COBRA Toolbox. Nat. Protocols. 2007;2:727–738. doi: 10.1038/nprot.2007.99. [DOI] [PubMed] [Google Scholar]
- Burgard AP, et al. Optknock: a bilevel programming framework for identifying gene knockout strategies for microbial strain optimization. Biotechnol Bioeng. 2003;84:647–57. doi: 10.1002/bit.10803. [DOI] [PubMed] [Google Scholar]
- Chartrain M, et al. Metabolic engineering and directed evolution for the production of pharmaceuticals. Current Opinion in Biotechnology. 2000;11:209–14. doi: 10.1016/s0958-1669(00)00081-1. [DOI] [PubMed] [Google Scholar]
- Dharmadi Y, et al. Anaerobic fermentation of glycerol by Escherichia coli: a new platform for metabolic engineering. Biotechnol Bioeng. 2006;94:821–9. doi: 10.1002/bit.21025. [DOI] [PubMed] [Google Scholar]
- Duarte NC, et al. Global reconstruction of the human metabolic network based on genomic and bibliomic data. Proc Natl Acad Sci U S A. 2007;104:1777–82. doi: 10.1073/pnas.0610772104. [DOI] [PMC free article] [PubMed] [Google Scholar]
- Feist AM, et al. A genome-scale metabolic reconstruction for Escherichia coli K-12 MG1655 that accounts for 1260 ORFs and thermodynamic information. Mol Syst Biol. 2007;3 doi: 10.1038/msb4100155. [DOI] [PMC free article] [PubMed] [Google Scholar]
- Feist AM, et al. Reconstruction of biochemical networks in microbial organisms. Nat Rev Microbiol. 2008 doi: 10.1038/nrmicro1949. Accepted. [DOI] [PMC free article] [PubMed] [Google Scholar]
- Feist AM, Palsson BO. The growing scope of applications of genome-scale metabolic reconstructions using Escherichia coli. Nat Biotech. 2008;26:659–667. doi: 10.1038/nbt1401. [DOI] [PMC free article] [PubMed] [Google Scholar]
- Fong SS, et al. In silico design and adaptive evolution of Escherichia coli for production of lactic acid. Biotechnol Bioeng. 2005a;91:643–8. doi: 10.1002/bit.20542. [DOI] [PubMed] [Google Scholar]
- Fong SS, et al. Description and Interpretation of Adaptive Evolution of Escherichia coli K-12 MG1655 Using a Genome-scale in silico Metabolic Model. Journal of Bacteriology. 2003;185:6400–8. doi: 10.1128/JB.185.21.6400-6408.2003. [DOI] [PMC free article] [PubMed] [Google Scholar]
- Fong SS, et al. Latent pathway activation and increased pathway capacity enable Escherichia Coli adaptation to loss of key metabolic enzymes. J Biol Chem. 2005b doi: 10.1074/jbc.M510016200. [DOI] [PubMed] [Google Scholar]
- Fong SS, Palsson BO. Metabolic gene-deletion strains of Escherichia coli evolve to computationally predicted growth phenotypes. Nat Genet. 2004;36:1056–58. doi: 10.1038/ng1432. [DOI] [PubMed] [Google Scholar]
- Ibarra RU, et al. Escherichia coli K-12 undergoes adaptive evolution to achieve in silico predicted optimal growth. Nature. 2002;420:186–9. doi: 10.1038/nature01149. [DOI] [PubMed] [Google Scholar]
- Jaluria P, et al. Cells by design: a mini-review of targeting cell engineering using DNA microarrays. Mol Biotechnol. 2008;39:105–11. doi: 10.1007/s12033-008-9048-5. [DOI] [PubMed] [Google Scholar]
- Joyce AR, Palsson BO. Predicting gene essentiality using genome-scale in silico models. Methods Mol Biol. 2008;416:433–57. doi: 10.1007/978-1-59745-321-9_30. [DOI] [PubMed] [Google Scholar]
- Joyce AR, et al. Experimental and Computational Assessment of Conditionally Essential Genes in Escherichia coli. J Bacteriol. 2006;188:8259–8271. doi: 10.1128/JB.00740-06. [DOI] [PMC free article] [PubMed] [Google Scholar]
- Keasling JD, Chou H. Metabolic engineering delivers next-generation biofuels. Nat Biotechnol. 2008;26:298–9. doi: 10.1038/nbt0308-298. [DOI] [PubMed] [Google Scholar]
- Khosla C, Keasling JD. Metabolic engineering for drug discovery and development. Nat Rev Drug Discov. 2003;2:1019–25. doi: 10.1038/nrd1256. [DOI] [PubMed] [Google Scholar]
- Kim HU, et al. Metabolic flux analysis and metabolic engineering of microorganisms. Molecular BioSystems. 2008a;4:113–120. doi: 10.1039/b712395g. [DOI] [PubMed] [Google Scholar]
- Kim TY, et al. Strategies for systems-level metabolic engineering. Biotechnol J. 2008b;3:612–23. doi: 10.1002/biot.200700240. [DOI] [PubMed] [Google Scholar]
- Lee KH, et al. Systems metabolic engineering of Escherichia coli for L-threonine production. Mol Syst Biol. 2007;3:149. doi: 10.1038/msb4100196. [DOI] [PMC free article] [PubMed] [Google Scholar]
- Lee SJ, et al. Metabolic engineering of Escherichia coli for enhanced production of succinic acid, based on genome comparison and in silico gene knockout simulation. Appl Environ Microbiol. 2005a;71:7880–7. doi: 10.1128/AEM.71.12.7880-7887.2005. [DOI] [PMC free article] [PubMed] [Google Scholar]
- Lee SY, et al. Systems biotechnology for strain improvement. Trends Biotechnol. 2005b;23:349–58. doi: 10.1016/j.tibtech.2005.05.003. [DOI] [PubMed] [Google Scholar]
- Leuchtenberger W, et al. Biotechnological production of amino acids and derivatives: current status and prospects. Appl Microbiol Biotechnol. 2005;69:1–8. doi: 10.1007/s00253-005-0155-y. [DOI] [PubMed] [Google Scholar]
- Ma F, Hanna MA. Biodiesel production: a review. Bioresource Technology. 1999;70:1–15. [Google Scholar]
- Murarka A, et al. Fermentative utilization of glycerol by Escherichia coli and its implications for the production of fuels and chemicals. Appl Environ Microbiol. 2008;74:1124–35. doi: 10.1128/AEM.02192-07. [DOI] [PMC free article] [PubMed] [Google Scholar]
- Nakamura CE, Whited GM. Metabolic engineering for the microbial production of 1,3-propanediol. Curr Opin Biotechnol. 2003;14:454–9. doi: 10.1016/j.copbio.2003.08.005. [DOI] [PubMed] [Google Scholar]
- Park JH, et al. Metabolic engineering of Escherichia coli for the production of L-valine based on transcriptome analysis and in silico gene knockout simulation. Proc Natl Acad Sci U S A. 2007;104:7797–802. doi: 10.1073/pnas.0702609104. [DOI] [PMC free article] [PubMed] [Google Scholar]
- Park JH, et al. Application of systems biology for bioprocess development. Trends Biotechnol. 2008;26:404–12. doi: 10.1016/j.tibtech.2008.05.001. [DOI] [PubMed] [Google Scholar]
- Paster M, et al. Industrial Bioproducts: Today and Tomorrow. U.S. Department of Energy; 2003. [Google Scholar]
- Patil KR, et al. Evolutionary programming as a platform for in silico metabolic engineering. BMC Bioinformatics. 2005;6:308. doi: 10.1186/1471-2105-6-308. [DOI] [PMC free article] [PubMed] [Google Scholar]
- Perlack RD, et al. Energy, U. S. D. o. Biomass as a feedstock for a bioenergy and bioproducts industry: The technical feasibility of a billion-ton annual supply. Oak Ridge National Laboratory; Oak Ridge, TN: 2005. [Google Scholar]
- Pharkya P, et al. Exploring the overproduction of amino acids using the bilevel optimization framework OptKnock. Biotechnol Bioeng. 2003;84:887–99. doi: 10.1002/bit.10857. [DOI] [PubMed] [Google Scholar]
- Pharkya P, et al. OptStrain: a computational framework for redesign of microbial production systems. Genome Res. 2004;14:2367–76. doi: 10.1101/gr.2872004. [DOI] [PMC free article] [PubMed] [Google Scholar]
- Price ND, et al. Genome-scale microbial in silico models: the constraints-based approach. Trends in Biotechnology. 2003;21:162–169. doi: 10.1016/S0167-7799(03)00030-1. [DOI] [PubMed] [Google Scholar]
- Price ND, et al. Genome-scale models of microbial cells: evaluating the consequences of constraints. Nat Rev Microbiol. 2004;2:886–897. doi: 10.1038/nrmicro1023. [DOI] [PubMed] [Google Scholar]
- Reed JL, et al. Towards multidimensional genome annotation. Nat Rev Genet. 2006;7:130–41. doi: 10.1038/nrg1769. [DOI] [PubMed] [Google Scholar]
- Reed JL, Palsson BO. Thirteen Years of Building Constraint-Based In Silico Models of Escherichia coli. J Bacteriol. 2003;185:2692–9. doi: 10.1128/JB.185.9.2692-2699.2003. [DOI] [PMC free article] [PubMed] [Google Scholar]
- Reed JL, et al. An expanded genome-scale model of Escherichia coli K-12 (iJR904 GSM/GPR) Genome Biology. 2003;4:R54.1–R54.12. doi: 10.1186/gb-2003-4-9-r54. [DOI] [PMC free article] [PubMed] [Google Scholar]
- Santos CN, Stephanopoulos G. Combinatorial engineering of microbes for optimizing cellular phenotype. Curr Opin Chem Biol. 2008;12:168–76. doi: 10.1016/j.cbpa.2008.01.017. [DOI] [PubMed] [Google Scholar]
- Sauer M, et al. Microbial production of organic acids: expanding the markets. Trends Biotechnol. 2008;26:100–8. doi: 10.1016/j.tibtech.2007.11.006. [DOI] [PubMed] [Google Scholar]
- Trinh CT, et al. Design, construction and performance of the most efficient biomass producing E. coli bacterium. Metab Eng. 2006;8:628–38. doi: 10.1016/j.ymben.2006.07.006. [DOI] [PubMed] [Google Scholar]
- Trinh CT, et al. Minimal Escherichia coli cell for the most efficient production of ethanol from hexoses and pentoses. Appl Environ Microbiol. 2008;74:3634–43. doi: 10.1128/AEM.02708-07. [DOI] [PMC free article] [PubMed] [Google Scholar]
- Tyo KE, et al. Expanding the metabolic engineering toolbox: more options to engineer cells. Trends Biotechnol. 2007;25:132–7. doi: 10.1016/j.tibtech.2007.01.003. [DOI] [PubMed] [Google Scholar]
- Varma A, et al. Stoichiometric interpretation of Escherichia coli glucose catabolism under various oxygenation rates. Appl Environ Microbiol. 1993;59:2465–73. doi: 10.1128/aem.59.8.2465-2473.1993. [DOI] [PMC free article] [PubMed] [Google Scholar]
- Varma A, Palsson BO. Stoichiometric flux balance models quantitatively predict growth and metabolic by-product secretion in wild-type Escherichia coli W3110. Applied and Environmental Microbiology. 1994;60:3724–3731. doi: 10.1128/aem.60.10.3724-3731.1994. [DOI] [PMC free article] [PubMed] [Google Scholar]
- Zhang X, et al. Production of L-alanine by metabolically engineered Escherichia coli. Appl Microbiol Biotechnol. 2007;77:355–66. doi: 10.1007/s00253-007-1170-y. [DOI] [PubMed] [Google Scholar]
- Zhang Y. Structural genomics of the Thermotoga maritima sets the stage for the molecular level analysis of its central metabolism. 2008 In preparation. [Google Scholar]
Associated Data
This section collects any data citations, data availability statements, or supplementary materials included in this article.