

Abstract
The retinoblastoma protein (pRB) and its two relatives, p107 and p130, regulate development and cell proliferation in part by inhibiting the activity of E2F-regulated promoters. We have used high-density oligonucleotide arrays to identify genes in which expression changed in response to activation of E2F1, E2F2, and E2F3. We show that the E2Fs control the expression of several genes that are involved in cell proliferation. We also show that the E2Fs regulate a number of genes involved in apoptosis, differentiation, and development. These results provide possible genetic explanations to the variety of phenotypes observed as a consequence of a deregulated pRB/E2F pathway.
Keywords: E2F, retinoblastoma, microarray, target gene bias
One of the hallmarks of cancer cells is their insensitivity to antiproliferative signals, such as antigrowth factors (Hanahan and Weinberg 2000). Scientific results obtained in the last decade have pointed to a central role for the retinoblastoma protein (pRB), and its relatives, p107 and p130, in mediating these antiproliferative signals. Consistent with this role, the pRB pathway is deregulated in the majority of human cancers (for review, see Sherr 1996). In addition to the pRB family members, this pathway involves cyclin-dependent kinase (CDK) inhibitors of the INK4 family, which act as negative regulators of cell proliferation, and the positively acting D-type cyclins that, in association with CDK4 or CDK6, form active kinase complexes. The downstream effectors in the pathway are the E2F transcription factors (for review, see Dyson 1998; Nevins 1998). The E2Fs regulate the timely expression of a series of genes whose products are essential for cell proliferation (for review, see Helin 1998).
When associated with pRB family members, the E2Fs function as transcriptional repressors, whereas 'free' E2F activates transcription (for review, see Dyson 1998; Müller and Helin 2000). Repression of E2F-regulated promoters by pRB family members is alleviated on their phosphorylation by a D-type cyclin-associated kinase, and this kinase activity is suppressed by the INK4 CDK inhibitors. Because all known mutations in this pathway lead to deregulated E2F activity, it is believed that most human tumors contain aberrant levels of E2F-regulated transcripts. In addition to controlling cell proliferation, the pRB family members also regulate apoptosis, differentiation, and development (for review, see Lipinski and Jacks 1999). In agreement with its role as a tumor suppressor, mice that carry one disrupted Rb1 allele are predisposed to cancer. However, Rb1 nullizygous embryos die between day 13 and day 15 of gestation. These embryos show signs of maturation defects in erythropoiesis, extensive apoptotic cell death, and hyperproliferation in the nervous system, liver, and ocular lens. In contrast to the strong phenotype that results from the lack of pRb, mice nullizygous for p107 or p130 do not have a discernible phenotype in the C57BL/6 genetic background. Moreover, mice that lack both p107 and p130 are defective in endochondrial bone development because of a deficiency in chondrocyte differentiation, which suggests that one of the physiological roles of p107 and p130 is to restrict chondrocyte proliferation and to induce terminal differentiation. pRB family members also play a role in the terminal differentiation of myoblasts, adipocytes, and cells of a variety of hematopoietic lineages (Lipinski and Jacks 1999). It has been suggested that the pRB family members regulate terminal differentiation through two distinct mechanisms. The first involves regulation of cell cycle progression and apoptosis through repression of E2F-dependent promoters. The second is related to the differentiation process and results from interaction of pRB family members with other transcriptional regulators, such as MyoD, C/EBPs and HBP1 (Lipinski and Jacks 1999).
There are six members of the E2F transcription factor family, E2F1–E2F6 (for review, see Dyson 1998; Müller and Helin 2000). All six E2Fs contain two highly conserved domains that are involved in sequence-specific DNA binding and dimerization with DP proteins. Association of the E2Fs with one of the two known DP proteins is required for high-affinity, sequence-specific DNA binding, and in the case of E2F1–E2F5, association with members of the pRB family. The E2Fs can be classified into three subgroups based on their structure, affinity for members of the pRB family, expression pattern, and putative function. The first group consists of E2F1, E2F2, and E2F3, whose expression is cell-growth regulated. At physiological levels these E2Fs associate exclusively with pRB, and ectopic expression of each of these three E2Fs is sufficient to induce S-phase in serum-starved tissue culture cells. This group of E2Fs are mainly involved in the regulation of cell proliferation and apoptosis (see, e.g., Leone et al. 1998; Tsai et al. 1998; Wang et al. 1998; Yamasaki et al. 1998; Humbert et al. 2000b). E2F4 and E2F5, members of the second group, bind to all three pRB family members, and, although they are expressed throughout the cell cycle, these E2Fs are unable to induce S-phase in quiescent cells. Mice that are nullizygous for E2f4 and E2Ff5 have specific terminal-differentiation defects. E2f4−/− mice show abnormalities in the development of hematopoetic lineages and in gut epithelium and dramatic shortening and broadening of the snout (Humbert et al. 2000a; Rempel et al. 2000). E2f5−/− mice develop hydrocephalus as a result of excessive cerebrospinal fluid production (Lindeman et al. 1998). E2F6, the only member of the third group, lacks the domains that are involved in transactivation and binding to the pRB family members. The physiological function of E2F6 is unknown. However, as its structure suggests, it is a repressor of E2F-dependent transcription (Müller and Helin 2000).
E2F DNA-binding sites have been identified in promoters of many genes that are central to the regulation of cell cycle progression. Among the putative targets for E2F regulation are genes whose products are essential for DNA replication and cell cycle control (Helin 1998; Nevins 1998). Expression of the majority of the known E2F target genes is regulated during cell growth, and they are activated just before S-phase. A notable exception is the p19/p14ARF gene, whose expression is not cell-growth regulated but nevertheless is controlled by E2F (Sherr 1998). Because the E2F transcription factors are essential for proliferation, identification of genes whose expression pattern changes as a consequence of deregulated E2F activity may ultimately lead to a better understanding of cell proliferation.
Thus, we have used oligonucleotide arrays to monitor changes in gene expression following activation of E2F1, E2F2, or E2F3.
Results
Generation and characterization of inducible E2F cell lines
We have shown previously that fusion proteins that contain the estrogen receptor ligand-binding domain (ER) and E2F1, E2F2, or E2F3 were inactive in the absence 4-hydroxy tamoxifen (OHT) and rapidly activated by addition of OHT (Vigo et al. 1999). To identify genes whose expression is altered as a result of a deregulated pRB/E2F pathway, we generated a series of cell lines by infecting human U2OS cells with retroviruses that express N-terminally HA-tagged ER-E2F1, ER-E2F2, or ER-E2F3. Following puromycin selection, individual clones were isolated, and the expression of the E2F proteins was confirmed using antibodies that specifically recognize E2F1, E2F2, or E2F3. As can be seen in Figure 1A, ER-E2F fusion proteins were expressed at approximately five- to 20-fold higher levels as compared with the endogenous level of the respective E2Fs. The highest level of overexpression is observed for the clones carrying ER-E2F2.
Figure 1.
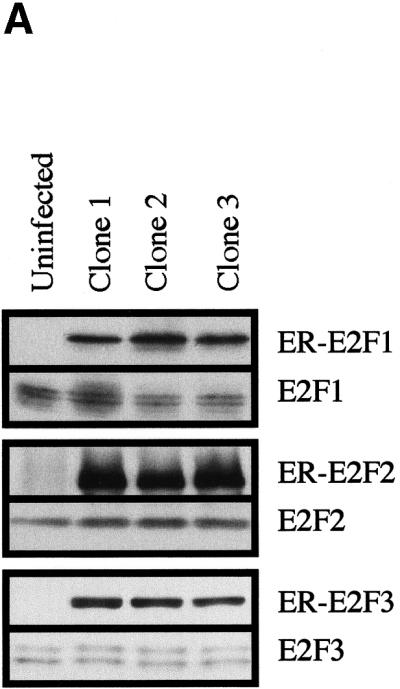


Characterization of cell lines. (A) Expression of estrogen receptor E2F (ER-E2F) fusion proteins. Western blot analysis of whole cell lysates using antibodies specific for E2F1, E2F2, or E2F3 show the expression levels of the ER-E2F fusion proteins as compared to endogenous E2Fs. (B) Nuclear translocation of ER-E2F3 fusion protein. Immunostaining of HA-tagged ER-E2F3 fusion protein was performed using HA-specific antibody 12CA5. The fusion protein was nuclear after the addition of 4-hydroxy tamoxifen (OHT). (C) ER-E2F fusion proteins are transcriptionally active. Fold changes in transcriptional activity were determined by dividing normalized luciferase activity from induced cells (300 nM OHT for 9 hr) by the normalized luciferase activity from uninduced cells. (D) Induction of Cyclin E1 transcription by activated fusion proteins. Semiquantitative RT-PCR of endogenous Cyclin E1 was performed on RNA isolated from cells at the indicated hours after induction of E2F activity by OHT. We used 27 PCR cycles to detect the Cyclin E1 transcript in the ER-E2F-expressing cell lines, whereas 30 PCR cycles were used to detect the transcript in the control (U2OS) samples.
Several experiments were performed to characterize the cell lines. In Figure 1B, HA-ER-E2F3 is shown to change its subcellular localization in response to addition of OHT. In untreated cells, ER-E2F3 was found almost exclusively in the cytoplasm, whereas 8 hr after the addition of OHT, the majority of the ER-E2F3 protein was detected in the nucleus (Figure 1B). Similar results were obtained for the E2F1 and E2F2 fusion proteins (data not shown).
To test the transcriptional activity of the ER-E2F fusion proteins, transactivation assays were performed using a sensitive synthetic E2F-dependent luciferase reporter construct (pGL3 TATA basic 6xE2F). As shown in Figure 1C, OHT treatment led to a significant increase in luciferase activity in all cell lines that were tested. These results showed that the ER-E2F fusion proteins are activated by OHT and suggested that the cell lines would be suitable for the identification of E2F target genes.
To identify E2F target genes and to assess changes in mRNA expression after E2F activation, we used hybridization to oligonucleotide microarrays (Lockhart et al. 1996). Using this technique it was possible to determine changes in the expression pattern of up to 35,000 different genes after activation of specific E2Fs. To determine the optimum duration of OHT treatment before isolation of RNA for hybridization, we investigated the kinetics of mRNA accumulation of a previously known E2F target gene, Cyclin E1 (CCNE1) (Dyson 1998; Helin 1998). We observed a strong induction of the Cyclin E1 transcript as early as 4 hr after addition of OHT by semiquantitative PCR (Figure 1D), and by Northern blotting (data not shown). Although in most clones the level of Cyclin E1 induction had reached its maximum after 4 hr, in some clones the 8-hr timepoint showed slightly higher levels of Cyclin E1 transcript. We did not detect significant changes in cell cycle profiles in any of the cell lines 8 hr after addition of OHT (data not shown). Therefore, 8 hr was determined to be optimum duration for OHT treatment and was used for these studies.
To perform the microarray analysis, hybridization targets were prepared from total RNA isolated from the nine test clones and three independent control cultures of U2OS cells 8 hr after addition of OHT. Each target was hybridized to Hu6800, Hu35ksubA, Hu35ksubB, Hu35ksubC, and Hu35ksubD arrays containing oligonucleotide probe pairs for ∼35,000 different genes.
Statistical analysis of the data
The McNemar test was used to determine the statistical quality of the data (see Materials and Methods). In this test we used the difference calls provided by the GeneChip® software, which were moderately induced (MI) or induced (I) for up-regulated genes or decreased (D) or moderately decreased (MD) for down-regulated genes, to calculate the statistical significance of the expression data. By combining the statistically significant changes (>99% confidence) with the fold change in expression level for any given gene, we chose a minimal fold change (cutoff) to keep the number of false positives close to an acceptable minimum. The number of genes whose expression was modulated in response to induction of each of the ER-E2Fs as a function of fold change cutoff is shown in Figure 2. For one single experiment (Fig. 2A) it was necessary to use a cutoff of at least fivefold induction or repression to keep the number of false positives close to an acceptable minimum. For duplicate experiments (Fig. 2B), reproducible modulation of transcript levels were scored using a cutoff of threefold without significant risk of false positives. Figure 2C shows that triplicate measurements result in a further increase in sensitivity. Here, at a cutoff of twofold change, no genes were found to be modulated in the U2OS control, and the expression of almost no genes were modified in the randomized data lists.
Figure 2.


Analysis of gene expression changes. The columns represent numbers of regulated genes (hits) in one (A ), two (B), and three (C) independent measurements. A gene is called regulated when its difference call is induced/moderately induced (I/MI) for up-regulated genes and decreased/moderately decreased (D/MD) for down-regulated genes in all replicates and the fold change (FC) is equal to or beyond the fold-change cutoff in all replicates (FC ≥ cutoff for up-regulated genes or FC ≤ cutoff for down-regulated genes). Checkered bars represent the data. Black bars represent U2OS noise lists (derived from comparing U2OS control chips to each other). White bars represent randomized data lists. See Materials and Methods for details.
Our statistical analyses showed that the E2Fs induced a significant change in the expression of a large number of genes in U2OS cells. Based on the analysis presented above, we used the following criteria for characterization of a gene as induced or repressed. For duplicate measurements, a minimum of threefold change and a difference call of I or MI for up-regulated genes or a cutoff of threefold decrease and D or MD difference calls for down-regulated genes were used. The cutoff was lowered to twofold when triplicate measurements were performed. Using these criteria, we found the expression of 913 genes to be modulated by E2F1, 292 by E2F2, and 652 by E2F3 (see Table 4 in supplementary information). The expression of a subset of 162 genes was altered by all three E2Fs. We characterized 498 genes as selectively modulated by E2F1, 55 genes by E2F2, and 232 genes by E2F3. The total number of genes regulated by at least one E2F was 1240. We estimate that this number represents ∼7% of the genes expressed in U2OS cells (∼19,000 of the ∼35,000 unigenes represented on the microarrays were expressed at detectable levels). From this list, we selected 42 genes (representing the spectrum from poorly modulated to strongly modulated) for verification analysis (Table 1 and below).
Table 1.
Fold change and difference for a selected number of DNA chip entries
 |
Symbol for each gene as provided by Unigene http://www.ncbi.nlm.nih.gov/UniGene/index.html. Accession number refers to sequence used to construct the microarray. Fold changes and difference calls are provided by the GeneChip software. (I) Induced, (MI) moderately induced, (NC) no change, (MD) moderately decreased, (D) decreased.
Verification of microarray results by Northern blot analysis
Two potential sources of false positive signals in microarray studies are cross-hybridization between closely related genes and clonal selection. To confirm the array results, Northern blot analysis was performed using total (Fig. 3A) or poly A (Fig. 3B) RNA prepared from cell lines that express ER-E2F1, ER-E2F2, or ER-E2F3 that were harvested at 0 hr, 4 hr, and 8 hr after OHT treatment. The results shown in Figure 3, A and B do not only confirm the data from the microarray studies, they also indicate that the fold changes in gene expression calculated by the GeneChip® software underestimate the level of modulation as determined by Northern blot analysis. As can be seen in Figure 3 and in Table 1, strong induction of mRNA levels was detected for FST, EGR1, EZH2, CASP3, TEAD4, DYRK2, PTPNS1, PRKAR2B, RANBPM, and BMP2 after ER-E2F activation. The induction of FST, EZH2, CASP3, TEAD4, DYRK2, PTPNS1, PRKAR2B, and RANBPM was unaffected by addition of cycloheximide during the OHT treatment, which suggests that these genes are direct transcriptional targets of E2F. We also observed lower expression levels of certain genes as a result of ER-E2F activation (e.g., PAI1, CTGF, EPLIN, TGFB2, BCL3, and INHBA; Fig. 3; Table 1). In this case, however, cycloheximide treatment prevented the apparent repression of gene expression upon ER-E2F induction, which suggests that intermediate regulatory factors may be involved.
Figure 3.

Verification of microarray data by Northern blotting. (A) Northern blot analysis to verify target gene regulation using 10 μg of total RNA. Cells were harvested after 0 hr, 4 hr, and 8 hr of exposure to 300 nM 4-hydroxy tamoxifen (OHT). (B) Northern blot analysis to verify target gene regulation using 4 μg of poly A+ RNA. Cells were harvested after 0 hr, 4 hr, and 8 hr of exposure to 300 nM OHT.
In 39 out of 40 cases using Northern blot analysis, increased E2F activity was confirmed to alter the expression of a particular gene identified by the microarray method (Table 2). In several cases, a gene that was predicted to be selectively modulated by one E2F transcription factor by the microarray analysis was shown to be regulated by the other E2Fs in Northern blotting studies (e.g., DMRT1 by E2F1, BMP2 by E2F2, CTGF by E2F3). We did not detect any discrepancies between the microarray and Northern blot analyses with respect to the direction of transcript modulation (induction vs. repression). Based on these experiments, we estimate the rate of false positives in the screen to be ∼2%.
Table 2.
E2F-induced expression changes for selected genes: Summary call and verification
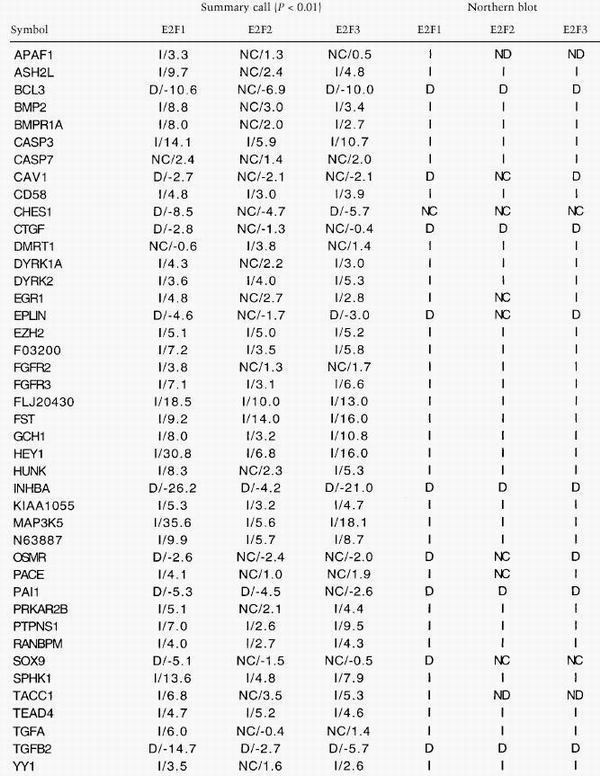 |
Symbols are given for each gene as in Table 1. Two genes do not have an assigned symbol, and their accession numbers are given. The average fold change in expression for a gene is shown. The summary call (P < 0.01) is calculated using the McNemar test as described in the text. The verification of all genes have been performed by Northern blotting, and calls are based on these results (Figs. 3,4; data not shown).
(ND) Not determined.
To ensure that the E2F-induced gene expression changes that were observed were not characteristic of only U2OS or transformed cells, we generated pools of human diploid fibroblasts (WI38) that were infected with retroviral constructs expressing ER-E2F1. Poly A RNA was isolated from infected WI38 cells at 0 hr, 4 hr, 8 hr, and 12 hr after addition of OHT, and Northern blots were performed using probes generated from a subset of the genes whose expression was modulated in U2OS cells after ER-E2F induction. As can be seen in Figure 4A, in WI38 cells the level of transcript modulation was equal to, and in some cases higher than (CCNE1, APAF1, and CASP3), that observed in U2OS cells. These results suggest that the set of E2F-regulated genes identified in U2OS cells is not specific for this cell line but, rather, that the E2Fs induce similar transcriptional changes in nontransformed cells.
Figure 4.


E2F-induced changes in transcript levels are neither confined to transformed cells nor caused by overexpression of E2F fusion proteins. (A) Northern blot analysis of E2F-regulated genes in human diploid WI-38 ERE2F1 cells. 2 μg poly A RNA was loaded. (B) Northern blot analysis of RNA prepared from U2OS pRBΔcdk cells. 15 μg of total RNA was loaded. Hours indicate the time after removal of tetracyclin. Note the increase in the levels of the faster migrating mouse RbΔCDK with time. Blots were probed using a human probe, which likely is the reason that mouse RbΔcdk mRNA produced a much weaker signal than endogenous human RB1.
We also were concerned that the differences in transcriptional activity detected in the microarray experiments might be caused by overexpression of the ER-E2F fusion proteins and that the genes identified were not regulated by physiological levels of E2F. We sought to address this concern by repressing endogenous E2F activity by overexpression of pRB. This assumes that genes that are up-regulated by induction of E2F should be down-regulated by expression of pRB. Conversely, genes that are down-regulated by induction of E2F should be up-regulated by expression of pRB. To test this possibility, we used a U2OS cell line expressing a pRB mutant (pRBΔCDK) in a tetracycline-dependent manner (Lukas et al. 1999). As shown in Figure 4B, two genes up-regulated by E2F (CCNE1, EGR1) were repressed by pRBΔcdk expression.
Conversely, the levels of two E2F-repressed genes (PAI1, CTGF) were strongly induced as early as 4 hr after tetracycline removal at a time when the pRBΔCDK protein is just starting to be detectable (data not shown). Although we cannot formally rule out the possibility that these effects are independent of endogenous E2F activity, the most likely explanation is that nonphosphorylatable pRB binds to and inactivates endogenous E2F activity.
Groups of genes regulated by E2F: Target gene bias analysis
The E2F transcription factors are best known for their involvement in the regulation of cell cycle and apoptosis. A considerable number of genes involved in these processes were found to be modulated by ER-E2F induction (Fig. 5; Tables 1, 2, and 3). In the case of apoptosis, E2F can induce apoptosis independent of p53 (Müller and Helin 2000). Based on our results, transcriptional regulation of APAF1, CASP3, CASP7, MAP3K5, and BCL3 genes provides a plausible mechanism whereby E2Fs affect this process. Among the cell cycle regulators, cyclins were the preferred E2F targets. There were 16 different known cyclin genes represented on the microarrays used in our studies, of which E2F1 and E2F3 regulate four (CCNE1, CCNE2, CCND3, CCNG2), and E2F2 regulates three (CCNE1, CCNE2, CCND3).
Figure 5.


Bias analysis. (A) Principle of target gene bias analysis (TGB). TGB determines the significance of a particular class of genes being regulated based on the fraction of these genes being regulated in the total set of detectable genes on the microarrrays. Applied to subsets of genes on a microarray (see panel B), it asks whether the fraction of regulated genes in this subset of genes is equal to the overall fraction of regulated genes. Applied to other microarray experiments (see panel C,D), TGB is sensitive to the relatedness of gene expression patterns. In both cases, significant deviation from the expected value (bias) is hypothesized to imply biological relevance. (B) TGB analysis of functional gene groups. Previously described E2F target genes were included as a positive control. (C) TGB analysis of published screens. Note that TGB is not confined to microarray-based screens. Ras transformation targets were identified by subtractive suppression hybridization (Zuber et al. 2000). (D) Comparison of E2F1, E2F2, and E2F3 expression patterns by TGB. (E) U2OS cells express a random subset of the genes present on the microarray chips. The distribution of unigenes on the chip found in a certain number of libraries is shown. The expected profile (19K exp) is the result of multiplying the number of genes in each category by the fraction of genes expressed in U2OS cells (i.e., the ∼19,000 genes that have been called present in either control or test chips/28,000 unigenes found on the chips). The observed profile (19K obs) represents the genes expressed in U2OS cells. (F) E2F target genes tend to be widely expressed. E2F3 was shown to regulate significantly the expression of 633 genes. The expected profile presents a random expression of these genes, and is found by multiplying the number of genes in each category of genes expressed in U2OS cells (19K obs in panel E) by the fraction of regulated genes (i.e., 633/19,000). The observed profile (633 obs) represents the distribution of the 633 genes regulated by E2F3.
Table 3.
Functional classification of selected E2F regulated genes
 |
Average fold changes for three independent experiments are shown for each of the shown genes. Average fold changes of genes satisfying the cut-off criteria as defined by the McNemar test (see text) are shown in bold.
However, most of the E2F target genes identified in the screen cannot be categorized as regulators of cell cycle or apoptosis. To better understand the complicated expression patterns induced by E2F, we performed target gene bias (TGB) analysis (Fig. 5; see Materials and Methods). This analysis is based on the hypothesis that a disproportionately high fraction of genes involved in a particular process will be regulated by a transcription factor if that transcription factor actually regulates that process. For example, if that fraction is significantly higher for TGFβ signaling genes, we hypothesize that E2F activity influences TGFβ signaling. In mathematical terms, the level of significance (P value) is given by the binomial distribution (Fig. 5A). The negative logarithm (base 10) of the P value is used as a quantitative measure of significance. A bias value of 2 corresponds to a P value of 0.01. TGB analysis is not restricted to genes that are involved in signaling pathways but can be applied to arbitrary groups of genes that share a particular property of interest (see below).
Figure 5B shows the results of TGB analysis for genes grouped by function and/or structural similarities as defined by GeneCards (see Materials and Methods). As a positive control for our analysis, we included previously reported E2F target genes. Two randomly selected sets of genes similar in size to the analyzed gene groups are included as negative controls. We observed significant bias (−log(P) > 2) for transcription factors (in particular homeobox genes), genes of the TGF β signaling pathway, and receptor tyrosine kinases. As expected the E2Fs also produced a significant bias toward cell cycle and apoptosis genes.
We also sought to determine if a significant overlap existed between the expression patterns found in other published gene expression screens and the patterns observed by induction of E2F activity. Figure 5C shows that there is indeed a significant overlap between E2F-modulated genes and those induced after addition of serum to starved fibroblasts (Iyer et al. 1999) as well as genes regulated by receptor tyrosine kinases (RTKs; Fambrough et al. 1999). We also observed significant bias toward genes regulated by p53 (Zhao et al. 2000), c-Myc (Coller et al. 2000), activated Ras (Zuber et al. 2000), and replicative senescence (Shelton et al. 1999). However, genes found to be regulated by aging (Lee et al. 2000) and caloric restriction (Lee et al. 1999) showed biases equal to those from randomly selected subsets of genes. The gene expression patterns for E2F1, E2F2, and E2F3 were also ctompared to each other (Fig. 5D). As expected, the overlaps are highly significant and they show the relatedness of these three factors as well as the sensitivity of TGB analysis to reveal similarities in gene expression patterns.
E2F-regulated genes are widely expressed
The known functions of the E2F transcription factors suggest that they play a fundamental role in a number of cellular processes. It is therefore expected that E2F target genes are expressed in a variety of tissues and cell types. We tested this hypothesis by determining the distribution of E2F target genes in different cDNA libraries and compared this distribution to the profile of all genes expressed at detectable levels in U2OS cells. As shown in Figure 5E, most genes represented on the microarrays in our studies were isolated from a small number of cDNA libraries (Fig. 5E; “19K exp”) and this profile does not change significantly for genes that are expressed in U2OS cells (genes called “present” by GeneChip® software; Fig. 5E; “19K obs”).
Therefore, U2OS cells express a random subset of the genes that are present on the microarrays. A completely different profile is observed for E2F target genes. The results for E2F3 are shown (Fig. 5F), but very similar profiles were obtained for E2F1 and E2F2. Genes that are found in only a few libraries are strongly underrepresented, whereas genes with a broader library representation (7–31) are overrepresented. Although it may be a simplistic line of reasoning, these results suggest that E2F target genes serve fundamental functions required in a large number of cell types and tissues.
Discussion
Previous experiments have suggested that, in addition to having a role in cell proliferation, E2F also plays a role in regulating apoptosis, differentiation, and development. However, to date most known E2F-regulated genes are characterized as functioning in cell cycle control and/or DNA replication, which suggests that we only know of a subset of E2F-regulated genes. The major findings of our experiments are that increased E2F activity leads to significant changes in the overall gene expression profile of a given cell and that E2F modulates the expression of a large number of transcripts. Furthermore, E2F controls, in addition to those involved in cell cycle control and DNA replication, genes that are directly involved in cell-fate decisions such as apoptosis, differentiation, and early development (see below).
Our results show that the activation of the E2Fs induced a significant change in the expression of 1240 genes present on the 35K microarray chips, or ∼7% of the total 19,000 genes that were found to be expressed in U2OS cells. Of these, 718 or 58% were induced and the expression of 522 were decreased following E2F activation. Of the 1240 genes, ∼60% were unnamed expressed sequence tags (ESTs).
There are several measures for the reliability of our gene expression data. Our statistical analysis has shown that the observed changes are highly significant. Biological and technical variability was significantly reduced by the use of three independently derived U2OS cell lines expressing each of the ER-E2F fusion proteins. In several cases, we also observed reproducible expression changes of the same gene represented more than once on the microarrays. Moreover, Northern blot analysis was used as an independent test for the observed expression changes and the results were extremely consistent with the microarray data. Of 40 genes determined to be significantly induced or repressed by E2F1, Northern blot analysis confirmed 39 of these changes. For E2F2 and E2F3 the corresponding numbers were 21 of 21 and 29 of 30. For the verification by Northern blotting, we deliberately chose several genes that showed only two- to threefold change in expression levels, as well as genes that fell just outside a statistically significant change. Several of these genes were found by Northern blot analysis to be regulated by E2F, clearly showing that our statistical test is conservative and that 1240 significant changes is a low estimate for the number of E2F targets. In addition, the Northern blot results also showed that the candidate genes are rapidly induced by E2F in the absence of de novo protein synthesis, which suggests that the majority of the induced genes are regulated directly by E2F. In contrast, in all cases tested, the repression of a gene by the E2Fs required de novo protein synthesis. This result suggests that the E2Fs themselves do not function as transcriptional repressors, but may induce a repressor(s) of transcription.
In addition to verifying the expression changes observed on the microarrays by Northern blot analysis, we performed two other sets of experiments to determine the relevance of our data.
First, we have shown that increased E2F activity in primary human diploid cells leads to a similar change in expression of the tested genes as observed in U2OS cells. This shows that deregulation of E2F activity can lead to significant changes in gene expression in nontransformed cells in addition to tumor cells. This point is supported by our database analysis, which shows that the E2F-regulated genes are widely expressed and not restricted to specific tissues or certain tumor cell lines (see Fig. 5E,F). Second, we have shown that ectopic expression of a dominant form of pRB leads to down-regulation of genes that are induced by E2F and up-regulation of genes that are repressed by E2F activity. Importantly, we observed a change in expression of the E2F-regulated genes before the cells were arrested in G1 by pRB expression, which suggests that the changes in gene expression were not a consequence of pRB-induced pleiotropic cell cycle regulation but, rather, they resulted from pRB's ability to regulate E2F transcriptional activity. Because pRB is a repressor of E2F activity, these results suggest that endogenous levels of E2F regulate the expression of the tested genes.
Difference in target gene regulation by E2F family members
An open question is whether the E2F transcription factors regulate distinct genes or if they regulate a common set of genes. In the latter case, the differences in the biological function of the E2Fs could be explained by differences in expression levels and/or by tissue-specific expression patterns of the E2Fs. We addressed this question by analyzing the expression changes induced by three members of one of the E2F subgroups. Indeed, we observed that E2F1 activity led to significant changes in more genes than E2F2 and E2F3, which indicates that E2F1 was capable of specific regulation of certain genes. However, despite the fact that E2F1 was not overexpressed to the same extent as E2F2 and E2F3, our results show that the induction of E2F1 in the U2OS cells led to a stronger transactivation of a sensitive E2F reporter construct than did E2F2 and E2F3. Therefore, our results could be explained by a stronger transactivation potential of E2F1 in these cells. However, we also identified genes whose expression was selectively changed as a consequence of E2F2 or E2F3 activation, and which were not significantly modulated by either of the other E2Fs, thereby suggesting that some target-gene specificity indeed exists. However, we have not been able to confirm strict target-gene specificity by Northern blot analysis and in the cases in which we observed significant induction by one of the E2Fs, we also detected a lower but consistent regulation of that gene by the other E2Fs. These results suggest that the E2Fs may not have strict target-gene specificity, but they may convey specificity in how efficiently they can activate a given gene (see e.g., DMRT1; Fig. 3B). Our findings are consistent with a recent report that showed that the different E2Fs bind to the promoter region in the same gene in vivo; however, they do so at distinct times during the cell cycle (Takahashi et al. 2000). Taken together, it is therefore likely that all E2Fs are candidates to regulate the expression of the E2F-induced genes identified in our analysis.
Comparison to published screens and TGB analysis
Based on the results of verification by Northern blots, we estimate that 2%, or ∼20–30 genes out of 1240 in the list of regulated genes will be false positives. It is, therefore, difficult to draw conclusions based on changes observed for a single gene until they are verified by Northern blotting. It is, however, unlikely that a group of genes with a similar function that are characterized by our analysis as target genes are all false positives. We therefore sought to interpret the expression patterns induced by E2Fs based on changes of groups of genes. To this end, we analyzed the gene expression patterns for biases toward functional groups of genes and toward previously published expression patterns. We call this target gene bias (TGB) analysis.
TGB analysis of functional gene groups is problematic in the sense that the quality of results depends crucially on the quality of the functional classification that is applied. To minimize the probability of misleading conclusions, we used two independently assembled classifications. One was prepared by us based on information found in GeneCards and GenBank records and the other was published by Shelton et al. (1999). Although the numerical outcome was different, as expected, the main conclusions and statistical significance were surprisingly stable. Our analysis revealed significant bias toward genes that are involved in the regulation of cell cycle and apoptosis. The role of E2F in these processes is well documented and our data, which reveal several unknown cell cycle and apoptosis genes, provide some new vital insights as to the mechanisms of this regulation. Furthermore, significant bias toward gene groups with functions in processes that are known to be regulated by E2F validates our approach. Surprisingly, we observed highly significant bias toward homeobox and TGFβ signaling genes. These genes are key regulators of development and differentiation. These findings suggest that E2Fs may play a role in coordinating fundamental biological processes such as proliferation, apoptosis, differentiation, and development.
We also compared the E2F-induced gene expression patterns to published expression patterns observed in discrete settings. This was done using TGB analysis by treating the previously published sets of regulated genes as individual functional gene groups. As compared to functional gene groups, sets of regulated genes are well defined, which makes the analysis less sensitive to subjective judgements. We observed highly significant overlap between genes regulated by E2F and those regulated by serum. Serum acts largely by activation of tyrosine kinases and, interestingly, both receptor tyrosine kinases and receptor tyrosine kinase target genes also produced significant biases. Furthermore, tyrosine kinases are known to activate Ras and Ras transformation target genes also show strong TGB. One interpretation of this analysis is that E2F is a key mediator of the effects of serum, RTK, and Ras activation.
This interpretation has been supported previously by experiments showing that Ras is linked to cell cycle progression via the pRB/E2F pathway (Peeper et al. 1997). The spectrum of E2F target genes expressed at a certain point in time is therefore influenced by signals communicated by surrounding cells and the cellular environment and this may be the key to understanding the role of the E2Fs in integrating cell cycle, apoptosis, differentiation, and development. Because these processes are relevant to all cells, it would be expected that E2F target genes are expressed in a wide range of cell types. Our analysis of cDNA library distribution of E2F target genes suggests that this is indeed the case. The observed biases towards c-myc, p53, and replicative senescence genes may reflect the involvement of the E2Fs in these processes in ways that are not yet understood, but the investigation of commonly regulated target genes could provide some insight into this.
We suggest that TGB analysis can be useful in the analysis of complex gene expression patterns. As compared to hierarchical cluster analysis, TGB analysis can take advantage of prior knowledge about genes and, by doing so, makes the results easier to interpret. If applied to functional gene groups, the results depend on our current understanding of gene function, and as long as this understanding is incomplete, the bias analysis will be incomplete. If applied to published expression patterns, TGB analysis is conceptually similar to sequence similarity searches. As is the case also for sequence similarities, such similarities give rise to hypotheses that have to be tested by further experimentation. A particularly appealing application of this concept is the possibility to analyze signaling pathways as shown here in the case of the serum → RTK → Ras → E2F connection. It is tempting to speculate that it may be possible to use expression patterns observed in tumors or in virus-infected cells to identify the signaling pathways that are disturbed. This knowledge would be of tremendous value for the identification of drug targets whose manipulation results in selective cytotoxicity.
Compared to hierarchical clustering analysis (Eisen et al. 1998), TGB analysis includes supplementary information. This is of significant help in the process of interpreting observed gene expression patterns. In TGB analysis, clusters of genes (functional gene groups) are assembled beforehand (based on shared gene properties of interest) and then analyzed for statistical significance. The clusters in TGB analysis are therefore homogeneous, have clearly defined borders, and their significance is evaluated numerically rather than visually. On the other hand, TGB analysis is only as good as the gene groups that are available for analysis.
Hierarchical clustering and TGB analysis may therefore be used as complementary approaches to help in the interpretation of complex gene expression patterns.
Classification of E2F target genes
One of the most intriguing aspects of gene expression profiling is that the results can correlate gene expression patterns with specific phenotypes. Therefore, the profiling can provide several predictions and hypotheses that subsequently can be tested. Here, we identified a number of genes whose function could provide a molecular explanation as to how the proteins in the pRB/E2F-pathway control normal growth. We have listed 100 of these genes in Table 3. Although it will be too extensive to go into the specific function of each gene, we would like to highlight possible connections between the expression of some of these genes and the physiological function of the pRB/E2F pathway.
Cell cycle control and DNA replication
As an internal control for our experiments, we performed a database search for genes that have been reported to be regulated by E2F or have an E2F DNA-binding site (or binding sites) in their promoters. A number of these genes were expressed at detectable levels in U2OS cells, and the expression of several of them was changed after E2F activation (e.g., Cyclin E1, Cyclin D3, and c-Myb; Table 3). Strikingly, we also detected down-regulation of the plasminogen activator inhibitor, type 1, PAI-1, the only gene so far reported to be repressed by E2F (Koziczak et al. 2000). In our screen, we did not detect regulation of several genes previously reported to be E2F targets. Most notably, we did not observe significant regulation of the MCM genes, CDC6 and B-Myb. The reason for this lack of regulation is at present unclear, but may be because of the fact that the expression of these genes is strongly regulated during the transition from quiescence to growth and not in each cycle of exponentially growing cells. Because we performed our analysis using asynchronous populations of exponentially growing U2OS cells, the increased E2F activity may not have further affected change in the mRNA levels of these genes. An alternative, but less likely, explanation for the lack of detectable regulation could be the quality of the chosen oligonucleotide probes for these genes on the arrays.
Among the novel E2F target genes that are involved in cell cycle regulation, the expression of Cyclin E2 (CCNE2) was found to be strongly induced by the all three E2Fs.
Cyclin E2 expression is cell cycle regulated, and it is expressed with similar kinetics as Cyclin E1 (Lauper et al. 1998; Zariwala et al. 1998; Gudas et al. 1999). Our data indicate that, as for Cyclin E1, the cell cycle regulation of Cyclin E2 expression is controlled by the pRB/E2F pathway.
Centrosome duplication
Recently, it was shown that E2F and Cyclin A/CDK2 activity are required for centrosome duplication (Meraldi et al. 1999). We identified RanBPM as a direct target for the E2F transcription factors (Figure 3; Table 3). RanBPM colocalizes with γ-tubulin and is required for microtubule nucleation (Nakamura et al. 1998). Interestingly, overexpression of this protein can induce ectopic microtubule nucleation, and these data could indicate that pRB restricts centrosome duplication through the transcriptional regulation of RanBPM. Furthermore, because the pRB/E2F pathway is abrogated in the majority of human tumors, it may provide an explanation for the increased number of centrosomes in many tumors.
Apoptosis
Loss of pRB has been shown to lead to both p53-dependent and p53-independent apoptosis (Lipinski and Jacks 1999). It is widely believed that the apoptosis is a result of higher levels of E2F activity because ectopic expression of the E2Fs also can induce both p53-dependent and p53-independent apoptosis (Dyson 1998; Helin 1998). Although some E2F-regulated candidate genes have been suggested, none of these explain the strong apoptotic effect of deregulated E2F activity. Therefore, it is intriguing to find that the E2Fs induce the expression of several key regulators of apoptosis, such as the cytochrome-C-binding protein APAF1, and the crucial effector caspases, caspase 3 and caspase 7. Moreover, the MAP kinase kinase, kinase 5, also known as apoptosis-signal-regulating kinase 1 (ASK1), which is required for TNFα-induced apoptosis (Ichijo et al. 1997), was strongly induced. The E2Fs induced these four genes in the absence of de novo protein synthesis (Fig. 3), which shows that they are direct targets for the E2F transcription factors. Moreover, we observed a strong down-regulation of Bcl-3, a known coactivator of NFκB, which is, therefore, an inhibitor of apoptosis (Rebollo et al. 2000). The alteration of expression in any of these five genes or a combination thereof could explain the strong apoptotic effects of E2F activity. However, as is often the case for signal transduction pathways, the E2Fs stimulate both positive and negative signals of proliferation. The decision of whether to proliferate, differentiate, or die becomes a balance between the intensity of the various signals. Although the E2Fs induce cell proliferation, they also induce p18INK4C, an inhibitor of the cell cycle, and although the E2Fs induce apoptosis, they also induce growth factors and antiapoptotic genes, such as BCL2. However, because E2F expression induces apoptosis, the induction of BCL2 and growth factors is apparently insufficient for counteracting the strong expression of the apoptosis inducing proteins.
Development and differentiation
E2F activity is essential for early development in Drosophila and Xenopus (Duronio et al. 1995; Suzuki and Hemmati-Brivanlou 2000), and recent results have also suggested that E2F activity is required for early development in mice (L. Yamasaki, pers. comm.). More specifically, Xenopus and Drosophila E2F activity was shown to be required for axis determination in early development. It has been suggested that the E2Fs regulate axis determination through homeobox-containing proteins in Xenopus (Suzuki and Hemmati-Brivanlou 2000) and an EGF-receptor ligand, Gurken in Drosophila (Myster et al. 2000).
Our results confirm and extend these previous data by showing that the E2Fs regulate the expression of several proteins that are involved in early development, including homeobox proteins, transcription factors involved in cell fate decisions, a number of proteins that determine homeotic gene transcription, and signaling pathways such as the TGFβ and Wnt pathways that are essential for early development. As an example of the relevance of these findings, it has been reported that position-effect variegation (PEV) in Drosophila depends on E2F activity (Seum et al. 1996). Loss of E2F activity enhanced PEV, whereas overexpression of E2F activity suppressed PEV in Drosophila (Seum et al. 1996). These data suggested that the E2Fs themselves have an epigenetic effect by regulating chromatin structure or, more likely, that the E2Fs control PEV by regulating genes of the Polycomb group (PcG) family. In our screen, we have identified several PcG genes, like Enhancer of Zeste 2 (EZH2), Embryonic Ectoderm Development protein (EED) and Homolog of Polyhomeotic (EDR2/HPH2; see Table 3). The E2F-induced expression of these genes may provide an explanation for the role of E2F in the regulation of PEV and, more importantly, in development.
The pRB/E2F pathway is known to be central in the regulation of various types of cellular differentiation (see introduction; Lipinski and Jacks 1999). For example, pRB is required for erythroid, neuronal, eye, muscle, and adipocyte differentiation (Chen et al. 1996; Lipinski and Jacks 1999). Both p107 and p130 are required for normal endochondrial bone development (Cobrinik et al. 1996). In addition, E2F4 is known to contribute to hematopoetic lineage and to craniofacial development (Humbert et al. 2000a; Rempel et al. 2000), whereas loss of E2f5 leads to overproduction of cerebrospinal fluid and to hydrocephalus (Lindeman et al. 1998). Although these phenotypes are complex, our gene expression analysis may help to elucidate the role (or roles) played by the E2Fs in pRB/p107/p130 regulated differentiation. First, we found a number of transcription factors that are involved in cell fate decisions, such as Hairy/enhancer of split related (HEY1), Paired-like homeodomain (PTX1), ID4, MAF family members, and Sox9. These transcription factors have been associated with neurogenesis (HEY1; Leimeister et al. 1999)), morphogenesis, hindlimb, and craniofacial development (PTX1; Crawford et al. 1997; Szeto et al. 1999), block of differentiation of various tissues (ID4; Kondo and Raff 2000), the regulation of early differentiation (MAF family; Blank and Andrews 1997), and cartilage formation (Sox9; Bi et al. 1999). The expression of transcription factors that are involved in cell fate decisions is exquisitely controlled, and in several cases it has been described that the over- or misexpression of such transcription factors leads to malformations and/or transformation. Second, E2F activation led to a dramatic change in the expression of genes in the TGFβ pathway. TGFβ family members, which include TGFβs, activins, and bone morphogenetic proteins (BMPs), are secreted molecules that regulate a plethora of cellular responses, such as proliferation, differentiation, migration, and apoptosis (for review, see Massague and Chen 2000). E2F activation led to strong suppression of Inhibin β A and TGFβ2, and to a strong induction of Follistatin expression. Inhibin β A participates in the regulation of gametogenesis and craniofacial development, and mice that are homozygously null for Inhibin β A die within 24 h of birth (Matzuk et al. 1995).
Interestingly, Inhibin β A was also isolated as erythroid differentiation factor (Murata et al. 1988) and the gene has been shown to be an important regulator of photoreceptor differentiation in the developing retina (Davis et al. 2000). Together with the fact that Follistatin is an inhibitor of Activin A (the homodimer of inhibin β A that binds Activin receptors), our data suggest that the simultaneous induction of Follistatin and repression of inhibin β A could be involved in specific differentiation defects observed in the eye and in the erythrocytes of the Rb−/− mice. For example, Rb−/− erythroid cells develop normally in high percentage Rb−/− chimeric mice (Maandag et al. 1994; Williams et al. 1994), which suggests that the Rb wild-type cells rescued the Rb−/− cells, perhaps by secreting paracrine or endocrine erythroid differentiation factor (or factors) such as inhibin β A or Follistatin.
The last phenotype that we wish to discuss is the requirement for a normal pRB/E2F pathway in chondrocyte differentiation. We identified several genes that are involved in chondrocyte differentiation, such as the TGFβ pathways genes, FGF receptor 2 and FGF receptor 3, Cartilage linking protein 1, and Connective Tissue Growth factor (Fig. 3; Table 3). Discrete changes in the expression of several of these genes as a result of deregulated E2F activity could lead to both the defects in chondrocyte differentiation observed in the p107/p130 double-knockout mice, and the craniofacial abnormalities observed in the p107/p130 and the E2f4 knockout mice. Moreover, it is striking that activating mutations of FGF receptor 3 causes achondroplasia, which is the most common genetic form of dwarfism in humans (Burke et al. 1998), considering the fact that p107/p130 knockout mice have short bones.
In summary, the experiments presented in this article have provided us with a list of genes whose expression levels are significantly altered after E2F activation. The E2F-regulated genes code for proteins whose activity control cell cycle progression, proliferation, apoptosis, differentiation, and development. The identification of these genes allows us to test a number of new hypotheses as to why the pRB/E2F pathway is so crucial for normal development and proliferation. The list of E2F-regulated genes could be important for diagnostic purposes as, for example, in determining the efficacy of targeting a deregulated pRB/E2F pathway by therapeutic drugs. Finally, 60% of the identified genes are without any known function (ESTs). Because the expression of these ESTs is regulated by the E2Fs, several of these may have important functions in cellular homeostasis. Therefore, future experiments will pay special attention to identifying a possible function of some of these ESTs.
Materials and methods
Cell culture
U2OS cell lines that express HAER-E2F1, HAER-E2F2, or HAER-E2F3 were generated by infection of the human osteosarcoma cell line U2OS (which expresses functional pRB and p53, but does not express p16INK4A or p14ARF) with retroviruses that express the three fusion proteins (Vigo et al. 1999). Cells were selected in 2.5 μg/mL puromycin. Individual clones were isolated after 3 weeks of selection and tested for the expression of the ER-fusion proteins by Western blotting. The cells were grown in DMEM supplemented with 10% fetal calf serum. Puromycin resistant clones were continuously grown in the presence of 2.5 μg/mL puromycin.
Pools of early passage WI-38 HAER-E2F1 cells were generated by infection with the retroviral vector pBabePuro HAER-E2F1 (Vigo et al. 1999), and selection in 1.5 μg/mL puromycin. Cells were grown in DMEM supplemented with 10% FCS. U2OS cells expressing a pRB mutant (pRBΔCDK) in a tetracycline-dependent manner has been described previously (Lukas et al. 1999).
Western blotting
Western blots were performed using the mouse monoclonal antibodies KH95, TFE22, and TFE31 that specifically recognize E2F1, E2F2, and E2F3, respectively (Helin et al. 1993; K. Helin,, unpubl.).
Immunostaining
Cells, treated with or without 300 nM 4-hydroxytamoxifen (OHT) for 6 hr, were stained for the expression of HA-tagged ER-E2F proteins using the 12CA5 antibody as previously described (Müller et al. 1997).
Transactivation assays
Transactivation assays were performed as described previously (Müller et al. 1997). Briefly, cells were transfected with 2 μg pGL3TATAbasic-6xE2F luciferase reporter, 2 μg pCMV-βGal reporter, and 2 μg pCMVneoBam carrier. To perform assays, lysates were prepared from cells exposed to 300 nM OHT for 9 hr and from control cells. Normalized luciferase activity was determined as previously described (Müller et al. 1997).
Semiquantitative RT-PCR
Reverse transcription PCR (RT-PCR) was performed essentially as described (Vigo et al. 1999), except that total RNA was prepared using the RNeasy extraction kit (Qiagen).
High density oligonucleotide microarrays
Total RNA was prepared from test and control cells using the RNeasy kit (Qiagen).
Targets for hybridization to the microarrays were prepared as described (Lockhart et al. 1996; Fambrough et al. 1999), except that hybridization was performed in 1 × MES buffer (0.1 M 2–[N-Morpholino] ethanesulfonic acid [MES] pH6.7, 1 M NaCl, 0.01% Triton X-100) and chips were washed in 0.1 × MES buffer (0.1 M 2–[N-Morpholino] ethanesulfonic acid [MES] pH6.7, 0.1 M NaCl, 0.01% Triton X-100). Target concentration was 30 μg fragmented cRNA in 200 μL hybridization solution. Images were scanned at 3-μm resolution using a Hewlett Packard GeneArray Scanner. The images were analyzed using Affymetrix's GeneChip® software.
Statistical analysis
The McNemar test was used to determine data quality and cutoff (Abell et al. 1999). A special purpose software was developed and is available on request or at http://marray.lar.ieo.it. The McNemar test is often used in clinical trials to assess the efficacy of drug treatment versus placebo controls. The test compares lists of yes/no values. A P value >0.01 indicates lack of efficacy (the lists are equivalent), whereas P values <0.01 suggest the presence of a therapeutic effect. Applied to our data, we used the results from pairwise chip comparisons to obtain these lists where yes means “gene regulated” and no means “gene not regulated”. A gene was called regulated when the difference call provided by the GeneChip® software was MI or I for up-regulated genes, or D or MD for down-regulated genes, and the fold change was equal to or beyond a variable cutoff value.
Chip comparisons between two test chips or between two control chips were used to determine the noise level of the experiments (called noise lists or control lists here), whereas chip comparisons between a test and a control chip were used to determine the signal (called signal lists or data lists).
We estimated three parameters:
The equivalence of samples and chip performances (noise list versus noise list, P > 0.01).
The presence of differences in transcript levels (noise list versus signal list, P < 0.01).
The reproducibility of measurement of such differences (signal list versus signal list, P > 0.01. Note that this test does not depend on reproducibility of transcriptional regulation for the same gene in independent experiments.) Although all signal-to-noise comparisons were highly significant for the presence of signal (see below), they were not all equivalent. The following ranking was observed:
E2F1_1 = E2F1_3 > E2F1_2
E2F2_1 = E2F2_2 > E2F2_3
E2F3_1 > E2F3_2 = E2F3_3
Next, we asked if the detected signal reflected reproducible changes in gene expression.
Signal lists that resulted from single-chip comparisons were combined into three duplicate and one triplicate list using the logical AND operator (meaning that a gene was called regulated only when it was found to be regulated in each of the composing sublists, see above). Noise lists and randomized signal lists combined the same way were used as controls.
Randomization of signal lists was carried out using a pseudorandom number generator that reassigned a new position to each gene in the list before combining them. The numbers of genes that were found to be regulated in each of these lists as a function of fold-change cutoff is shown in Figure 2. For example, in Figure 2A it is evident that there are significantly (P ∼1.0E−150, E2F1_1 at cutoff 3) more regulated genes in the data lists as compared with the U2OS control lists. The randomized data lists contain the same number of regulated genes as the data lists. In Figure 2B, the randomized lists contain significantly (P = 1.6E−103 at cutoff 3 for E2F1) fewer regulated genes, which indicates reproducible measurement of regulated transcript levels for a large proportion of genes. Even fewer genes are found to be regulated because of noise in the control lists. The fact that the randomized and nonrandomized U2OS derived duplicate lists contain similar numbers of regulated genes (P = 0.43 at cutoff 1) illustrate the stochastic nature of the noise lists.
Cloning of probes for Northern blots
Primers were designed using Oligo 4.1 (Primer Analysis software). Total RNA was prepared from cycling U2OS cells using the RNeasy kit (Qiagen). Double-stranded (ds) cDNA was synthesized using the ds cDNA synthesis system from Life Technologies. We used 10 ng of ds cDNA in a standard 50 μL PCR reaction using Taq polymerase. PCR fragments were cloned into pCR2.1 using a TA cloning kit (Invitrogen). The identity of the PCR fragments was verified by sequencing.
Northern blots
Nearly confluent cultures or U2OS clones were trypsinized and plated at 5 × 10⁶ cells per 15-cm plate on the day before induction. The ER-E2F fusion proteins were activated by adding OHT to a final concentration of 300 nM, and samples were harvested at the indicated times. Cycloheximide was added where indicated to a final concentration of 10 μg/mL. RNA was isolated using either the RNeasy kit (Qiagen) for analysis of total RNA or by CsCl ultracentrifugation method as described (Ausubel et al. 1988) for analysis of poly A RNA. Poly A RNA was isolated with the Oligotex reagents from Qiagen using a batch protocol as described by the manufacturer.
Either 10 μg of total RNA or 4 μg of poly A RNA were separated on 1.25% formaldehyde-agarose gels, transferred to Hybond N+ membrane (Amersham) and probed as described (Ausubel et al. 1988).
TGB analysis
TGB analysis was performed as described in the results section using a special purpose software available on request or at http://marray.lar.ieo.it.
Acknowledgments
We gratefully acknowledge Elena Colli for help in generating the U2OS cell lines and Simona Ronzoni for FACS analysis. We thank Jiri Bartek for U2OS cells expressing pRBΔCDK. We thank Ali R. Fattaey and Nick H. Heintz for discussions and critical reading of the manuscript and members of the Department of Experimental Oncology for discussions. This work was supported by grants from the TMR programme of the European Community, Ministero della Sanita, Associazione Italiana per la Ricerca sul Cancro (AIRC) and Fondazione Italiana per la Ricerca sul Cancro (FIRC).
The publication costs of this article were defrayed in part by payment of page charges. This article must therefore be hereby marked “advertisement” in accordance with 18 USC section 1734 solely to indicate this fact.
Footnotes
E-MAIL khelin@ieo.it; FAX +39-02-5748-9851.
Article and publication are at www.genesdev.org/cgi/doi/10.1101/gad.864201.
References
- Abell ML, Braselton JP, Rafter JA. Statistics with mathematica. Academic Press; 1999. [Google Scholar]
- Ausubel FM, Brent R, Kingston RE, Moore DD, Seidman JG, Smith JA, Struhl K. Current protocols in molecular biology. New York: Greene Publishing Associates & Wiley-Interscience; 1988. [Google Scholar]
- Bi W, Deng JM, Zhang Z, Behringer RR, de Crombrugghe B. Sox9 is required for cartilage formation. Nat Genet. 1999;22:85–89. doi: 10.1038/8792. [DOI] [PubMed] [Google Scholar]
- Blank V, Andrews NC. The Maf transcription factors: Regulators of differentiation. Trends Biochem Sci. 1997;22:437–441. doi: 10.1016/s0968-0004(97)01105-5. [DOI] [PubMed] [Google Scholar]
- Burke D, Wilkes D, Blundell TL, Malcolm S. Fibroblast growth factor receptors: Lessons from the genes. Trends Biochem Sci. 1998;23:59–62. doi: 10.1016/s0968-0004(97)01170-5. [DOI] [PubMed] [Google Scholar]
- Chen PL, Riley DJ, Chen Y, Lee WH. Retinoblastoma protein positively regulates terminal adipocyte differentiation through direct interaction with C/EBPs. Genes & Dev. 1996;10:2794–2804. doi: 10.1101/gad.10.21.2794. [DOI] [PubMed] [Google Scholar]
- Cobrinik D, Lee M-H, Hannon G, Mulligan G, Bronson RT, Dyson N, Harlow E, Beach D, Weinberg RA, Jacks T. Shared role of the pRB-related p130 and p107 proteins in limb development. Genes & Dev. 1996;10:1633–1644. doi: 10.1101/gad.10.13.1633. [DOI] [PubMed] [Google Scholar]
- Coller HA, Grandori C, Tamayo P, Colbert T, Lander ES, Eisenman RN, Golub TR. Expression analysis with oligonucleotide microarrays reveals that MYC regulates involved in growth, cell cycle, signaling, and adhesion. Proc Natl Acad Sci. 2000;97:3260–3265. doi: 10.1073/pnas.97.7.3260. [DOI] [PMC free article] [PubMed] [Google Scholar]
- Crawford MJ, Lanctot C, Tremblay JJ, Jenkins N, Gilbert D, Copeland N, Beatty B, Drouin J. Human and murine PTX1/Ptx1 gene maps to the region for Treacher Collins syndrome. Mamm Genome. 1997;8:841–845. doi: 10.1007/s003359900589. [DOI] [PubMed] [Google Scholar]
- Davis AA, Matzuk MM, Reh TA. Activin A promotes progenitor differentiation into photoreceptors in rodent retina. Mol Cell Neurosci. 2000;15:11–21. doi: 10.1006/mcne.1999.0806. [DOI] [PubMed] [Google Scholar]
- Duronio RJ, O'Farrell PH, Xie JE, Brook A, Dyson N. The transcription factor E2F is required for S-phase during Drosophila embryogenesis. Genes & Dev. 1995;9:1445–1455. doi: 10.1101/gad.9.12.1445. [DOI] [PubMed] [Google Scholar]
- Dyson N. The regulation of E2F by pRB-family proteins. Genes & Dev. 1998;12:2245–2262. doi: 10.1101/gad.12.15.2245. [DOI] [PubMed] [Google Scholar]
- Eisen MB, Spellman PT, Brown PO, Botstein D. Cluster analysis and display of genome-wide expression patterns. Proc Natl Acad Sci. 1998;95:14863–14868. doi: 10.1073/pnas.95.25.14863. [DOI] [PMC free article] [PubMed] [Google Scholar]
- Fambrough D, McClure K, Kazlauskas A, Lander ES. Diverse signaling pathways activated by growth factor receptors induce broadly overlapping rather than independent, sets of genes. Cell. 1999;97:727–741. doi: 10.1016/s0092-8674(00)80785-0. [DOI] [PubMed] [Google Scholar]
- Gudas JM, Payton M, Thukral S, Chen E, Bass M, Robinson MO, Coats S. Cyclin E2, a novel G1 cyclin that binds to CDK2 and is aberrantly expressed in human cancers. Mol Cell Biol. 1999;19:612–622. doi: 10.1128/mcb.19.1.612. [DOI] [PMC free article] [PubMed] [Google Scholar]
- Hanahan D, Weinberg RA. The hallmarks of cancer. Cell. 2000;100:57–70. doi: 10.1016/s0092-8674(00)81683-9. [DOI] [PubMed] [Google Scholar]
- Helin K. Regulation of cell proliferation by the E2F transcription factors. Curr Opin Genet Dev. 1998;8:28–35. doi: 10.1016/s0959-437x(98)80058-0. [DOI] [PubMed] [Google Scholar]
- Helin K, Wu C-L, Fattaey AR, Lees JA, Dynlacht BD, Ngwu C, Harlow E. Heterodimerization of the transcription factors E2F-1 and DP-1 leads to cooperative transactivation. Genes & Dev. 1993;7:1850–1861. doi: 10.1101/gad.7.10.1850. [DOI] [PubMed] [Google Scholar]
- Humbert PO, Rogers C, Ganiatsas S, Landsberg RL, Trimarchi JM, Dandapani S, Brugnara C, Erdman S, Schrenzel M, Bronson RT, et al. E2F4 is essential for normal erythrocyte maturation and neonatal viability. Mol Cell. 2000a;6:281–291. doi: 10.1016/s1097-2765(00)00029-0. [DOI] [PubMed] [Google Scholar]
- Humbert PO, Verona R, Trimarchi JM, Dandapani S, Lees JA. E2f3 is critical for normal cellular proliferation. Genes & Dev. 2000b;14:690–703. [PMC free article] [PubMed] [Google Scholar]
- Ichijo H, Nishida E, Irie K, ten Dijke P, Saitoh M, Moriguchi T, Takagi M, Matsumoto K, Miyazono K, Gotoh Y. Induction of apoptosis by ASK1, a mammalian MAPKKK that activates SAPK/JNK and p38 signaling pathways. Science. 1997;275:90–94. doi: 10.1126/science.275.5296.90. [DOI] [PubMed] [Google Scholar]
- Iyer VR, Eisen MB, Ross DT, Schuler G, Moore T, Lee JCF, Trent M, Staudt LM, Hudson J, Jr, Boguski MS, et al. The transcriptional program in the response of human fibroblasts to serum. Science. 1999;283:83–87. doi: 10.1126/science.283.5398.83. [DOI] [PubMed] [Google Scholar]
- Kondo T, Raff M. The Id4 HLH protein and the timing of oligodendrocyte differentiation. EMBO J. 2000;19:1998–2007. doi: 10.1093/emboj/19.9.1998. [DOI] [PMC free article] [PubMed] [Google Scholar]
- Koziczak M, Krek W, Nagamine Y. Pocket protein-independent repression of urokinase-type plasminogen activator and plasminogen activator inhibitor 1 gene expression by E2F1. Mol Cell Biol. 2000;20:2014–2022. doi: 10.1128/mcb.20.6.2014-2022.2000. [DOI] [PMC free article] [PubMed] [Google Scholar]
- Lauper N, Beck ARP, Cariou S, Richman L, Hofmann K, Reith W, Slingerland JM, Amati B. Cyclin E2: a novel CDK2 partner in the late G1 and S phases of the mammalian cell cycle. Oncogene. 1998;17:2637–2643. doi: 10.1038/sj.onc.1202477. [DOI] [PubMed] [Google Scholar]
- Lee C-K, Klopp RG, Weindruch R, Prolla TA. Gene expression profile of aging and its retardation by caloric restriction. Science. 1999;285:1390–1393. doi: 10.1126/science.285.5432.1390. [DOI] [PubMed] [Google Scholar]
- Lee C-K, Weindruch R, Prolla TA. Gene-expression profile of the aging brain in mice. Nat Genet. 2000;25:294–297. doi: 10.1038/77046. [DOI] [PubMed] [Google Scholar]
- Leimeister C, Externbrink A, Klamt B, Gessler M. Hey genes: A novel subfamily of hairy- and Enhancer of split related genes specifically expressed during mouse embryogenesis. Mech Dev. 1999;85:173–177. doi: 10.1016/s0925-4773(99)00080-5. [DOI] [PubMed] [Google Scholar]
- Leone G, DeGregori J, Yan Z, Jakoi L, Ishida S, Williams RS, Nevins JR. E2F3 activity is regulated during the cell cycle and is required for the induction of S phase. Genes & Dev. 1998;12:2120–2130. doi: 10.1101/gad.12.14.2120. [DOI] [PMC free article] [PubMed] [Google Scholar]
- Lindeman GJ, Dagnino L, Gaubatz S, Xu Y, Bronson RT, Warren HB, Livingston DM. A specific, nonproliferative role for E2F-5 in choroid plexus function revealed by gene targeting. Genes & Dev. 1998;12:1092–1098. doi: 10.1101/gad.12.8.1092. [DOI] [PMC free article] [PubMed] [Google Scholar]
- Lipinski MM, Jacks T. The retinoblastoma gene family in differentiation and development. Oncogene. 1999;18:7873–7882. doi: 10.1038/sj.onc.1203244. [DOI] [PubMed] [Google Scholar]
- Lockhart DJ, Dong H, Byrne MC, Follettie MT, Gallo MV, Chee MS, Mittmann M, Wang C, Kobayashi M, Horton H, et al. Expression monitoring by hybridization to high-density oligonucleotide arrays. Nat Biotechnol. 1996;14:1675–1680. doi: 10.1038/nbt1296-1675. [DOI] [PubMed] [Google Scholar]
- Lukas J, Sørensen CS, Lukas C, Santoni-Rugiu E, Bartek J. p16INK4a, but not constitutively active pRb, can impose a sustained G1 arrest: molecular mechanisms and implications for oncogenesis. Oncogene. 1999;18:3930–3935. doi: 10.1038/sj.onc.1202777. [DOI] [PubMed] [Google Scholar]
- Maandag ECR, van der Valk M, Vlaar M, Feltkamp C, O'Brien J, van Roon M, van der Lugt N, Berns A, te Riele H. Developmental rescue of an embryonic-lethal mutation in the retinoblastoma gene in chimeric mice. EMBO J. 1994;13:4260–4268. doi: 10.1002/j.1460-2075.1994.tb06746.x. [DOI] [PMC free article] [PubMed] [Google Scholar]
- Massague J, Chen YG. Controlling TGF-β signaling. Genes & Dev. 2000;14:627–644. [PubMed] [Google Scholar]
- Matzuk MM, Kumar TR, Vassalli A, Bickenbach JR, Roop DR, Jaenisch R, Bradley A. Functional analysis of activins during mammalian development. Nature. 1995;374:354–356. doi: 10.1038/374354a0. [DOI] [PubMed] [Google Scholar]
- Meraldi P, Lukas J, Fry AM, Bartek J, Nigg EA. Centrosome duplication in mammalian somatic cells requires E2F and Cdk2-Cyclin A. Nat Cell Biol. 1999;1:88–93. doi: 10.1038/10054. [DOI] [PubMed] [Google Scholar]
- Müller H, Helin K. The E2F transcription factors : key regulators of cell proliferation. Biochem Biophys Acta. 2000;1470:M1–M12. doi: 10.1016/s0304-419x(99)00030-x. [DOI] [PubMed] [Google Scholar]
- Müller H, Moroni MC, Vigo E, Petersen BO, Bartek J, Helin K. Induction of S-phase entry by E2F transcription factors depends on their nuclear localization. Mol Cell Biol. 1997;17:5508–5520. doi: 10.1128/mcb.17.9.5508. [DOI] [PMC free article] [PubMed] [Google Scholar]
- Murata M, Eto Y, Shibai H, Sakai M, Muramatsu M. Erythroid differentiation factor is encoded by the same mRNA as that of the inhibin β A chain. Proc Natl Acad Sci. 1988;85:2434–2438. doi: 10.1073/pnas.85.8.2434. [DOI] [PMC free article] [PubMed] [Google Scholar]
- Myster DL, Bonnette PC, Duronio RJ. A role for the DP subunit of the E2F transcription factor in axis determination during Drosophila oogenesis. Development. 2000;127:3249–3261. doi: 10.1242/dev.127.15.3249. [DOI] [PubMed] [Google Scholar]
- Nakamura M, Masuda H, Horii J, Kuma K-i, Yokohama N, Ohba T, Nishitani H, Miyata T, Tanaka M, Nishimoto T. When overexpressed, a novel centrosomal protein, RANBPM, causes ectopic microtubule nucleation similar to g-tubulin. J Cell Biol. 1998;143:1041–1052. doi: 10.1083/jcb.143.4.1041. [DOI] [PMC free article] [PubMed] [Google Scholar]
- Nevins JR. Toward an understanding of the functional complexity of the E2F and retinoblastoma families. Cell Growth Differ. 1998;9:585–593. [PubMed] [Google Scholar]
- Peeper DS, Upton TM, Ladha MH, Neuman E, Zalvide J, Bernards R, DeCaprio JA, Ewen ME. Ras signaling linked to the cell-cycle machinery by the retinoblastoma protein. Nature. 1997;386:177–181. doi: 10.1038/386177a0. [DOI] [PubMed] [Google Scholar]
- Rebollo A, Dumoutier L, Renauld J-C, Zaballos A, Ayllon V, Martinez-A C. Bcl-3 expression promotes cell survival following interleukin-4 deprivation and is controlled by AP1 and AP1-like transcription factors. Mol Cell Biol. 2000;20:3407–3416. doi: 10.1128/mcb.20.10.3407-3416.2000. [DOI] [PMC free article] [PubMed] [Google Scholar]
- Rempel RE, Saenz-Robles MT, Storms R, Morham S, Ishida S, Engel A, Jakoi L, Melhem MF, Pipas JM, Smith C, Nevins JR. Loss of E2F4 activity leads to abnormal development and multiple cellular lineages. Mol Cell. 2000;6:293–306. doi: 10.1016/s1097-2765(00)00030-7. [DOI] [PubMed] [Google Scholar]
- Seum C, Spierer A, Pauli D, Szidonya J, Reuter G, Spierer P. Position-effect variegation in Drosophila depends on dose of the gene encoding the E2F transcriptional activator and cell cycle regulator. Development. 1996;122:1949–1956. doi: 10.1242/dev.122.6.1949. [DOI] [PubMed] [Google Scholar]
- Shelton DN, Chang E, Whittier PS, Choi D, Funk WD. Microarray analysis of replicative senescence. Curr Biol. 1999;9:939–945. doi: 10.1016/s0960-9822(99)80420-5. [DOI] [PubMed] [Google Scholar]
- Sherr CJ. Cancer Cell Cycles. Science. 1996;274:1672–1677. doi: 10.1126/science.274.5293.1672. [DOI] [PubMed] [Google Scholar]
- Sherr CJ. Tumor surveillance via ARF-p53 pathway. Genes & Dev. 1998;12:2984–2991. doi: 10.1101/gad.12.19.2984. [DOI] [PubMed] [Google Scholar]
- Suzuki A, Hemmati-Brivanlou A. Xenopus embryonic E2F is required for the formation of ventral and posterior cell fates during early embryogenesis. Mol Cell. 2000;5:217–229. doi: 10.1016/s1097-2765(00)80418-9. [DOI] [PubMed] [Google Scholar]
- Szeto DP, Rodriguez-Esteban C, Ryan AK, O'Connell SM, Liu F, Kioussi C, Gleiberman AS, Izpisua-Belmonte JC, Rosenfeld MG. Role of the Bicoid-related homeodomain factor Pitx1 in specifying hindlimb morphogenesis and pituitary development. Genes & Dev. 1999;15:484–494. doi: 10.1101/gad.13.4.484. [DOI] [PMC free article] [PubMed] [Google Scholar]
- Takahashi Y, Rayman JB, Dynlacht BD. Analysis of promoter binding by the E2F and pRB families in vivo: distinct E2F proteins mediate activation and transactivation. Genes & Dev. 2000;14:804–816. [PMC free article] [PubMed] [Google Scholar]
- Tsai KY, Hu Y, Macleod KF, Crowley D, Yamasaki L, Jacks T. Mutation of E2F1 supresses apoptosis and inappropriate S-phase entry and extends survival of Rb-deficient mouse embryos. Mol Cell. 1998;2:293–304. doi: 10.1016/s1097-2765(00)80274-9. [DOI] [PubMed] [Google Scholar]
- Vigo E, Müller H, Prosperini E, Hateboer G, Cartwright P, Moroni MC, Helin K. CDC25A phosphatase is a target of E2F and is required for efficient E2F-1 induced S phase. Mol Cell Biol. 1999;19:6379–6395. doi: 10.1128/mcb.19.9.6379. [DOI] [PMC free article] [PubMed] [Google Scholar]
- Wang ZM, Yang H, Livingston DM. Endogenous E2F-1 promotes timely G0 exit of resting mouse embryo fibroblasts. Proc Natl Acad Sci. 1998;95:15583–15586. doi: 10.1073/pnas.95.26.15583. [DOI] [PMC free article] [PubMed] [Google Scholar]
- Williams BO, Schmitt EM, Remington L, Bronson RT, Albert DM, Weinberg RA, Jacks T. Extensive contribution of Rb-deficient cells to adult chimeric mice with limited histopathological consequences. EMBO J. 1994;13:4251–4259. doi: 10.1002/j.1460-2075.1994.tb06745.x. [DOI] [PMC free article] [PubMed] [Google Scholar]
- Yamasaki L, Bronson R, Williams BO, Dyson NJ, Harlow E, Jacks T. Loss of E2F-1 reduces tumorigenesis and extends the lifespan of Rb1( +/−)mice. Nat Genet. 1998;18:360–364. doi: 10.1038/ng0498-360. [DOI] [PubMed] [Google Scholar]
- Zariwala M, Liu J, Xiong Y. Cyclin E2, a novel human G1 cyclin and activating partner of CDK2 and CDK3, is induced by viral oncoproteins. Oncogene. 1998;17:2787–2798. doi: 10.1038/sj.onc.1202505. [DOI] [PubMed] [Google Scholar]
- Zhao R, Gish K, Murphy M, Yin Y, Notterman D, Hoffman WH, Tom E, Mack DH, Levine AJ. Analysis of p53-regulated gene expression patterns using oligonucleotide arrays. Genes & Dev. 2000;14:981–993. [PMC free article] [PubMed] [Google Scholar]
- Zuber J, Tchernitsa O, Hinzmann B, Schmitz AC, Grips M, Hellriegel M, Sers C, Rosenthal A, Schafer R. A genome-wide survey of RAS transformation targets. Nat Genet. 2000;24:144–152. doi: 10.1038/72799. [DOI] [PubMed] [Google Scholar]