

Abstract
Epstein-Barr virus (EBV) latent membrane protein 1 (LMP1) transforms rodent fibroblasts and is expressed in most EBV-associated malignancies. LMP1 (transformation effector site 2 [TES2]/C-terminal activation region 2 [CTAR2]) activates NF-κB, p38, Jun N-terminal protein kinase (JNK), extracellular signal-regulated kinase (ERK), and interferon regulatory factor 7 (IRF7) pathways. We have investigated LMP1 TES2 genome-wide RNA effects at 4 time points after LMP1 TES2 expression in HEK-293 cells. By using a false discovery rate (FDR) of <0.001 after correction for multiple hypotheses, LMP1 TES2 caused >2-fold changes in 1,916 mRNAs; 1,479 RNAs were upregulated and 437 were downregulated. In contrast to tumor necrosis factor alpha (TNF-α) stimulation, which transiently upregulates many target genes, LMP1 TES2 maintained most RNA effects through the time course, despite robust and sustained induction of negative feedback regulators, such as IκBα and A20. LMP1 TES2-regulated RNAs encode many NF-κB signaling proteins and secondary interacting proteins. Consequently, many LMP1 TES2-regulated RNAs encode proteins that form an extensive interactome. Gene set enrichment analyses found LMP1 TES2-upregulated genes to be significantly enriched for pathways in cancer, B- and T-cell receptor signaling, and Toll-like receptor signaling. Surprisingly, LMP1 TES2 and IκBα superrepressor coexpression decreased LMP1 TES2 RNA effects to only 5 RNAs, with FDRs of <0.001-fold and >2-fold changes. Thus, canonical NF-κB activation is critical for almost all LMP1 TES2 RNA effects in HEK-293 cells and a more significant therapeutic target than previously appreciated.
INTRODUCTION
Although Epstein-Barr virus (EBV) infects most humans without causing significant disease, EBV is causally associated with Hodgkin's disease (HD) and other lymphoproliferative diseases (LPDs) in healthy and immune-compromised hosts (48, 49). EBV is also a causal agent of nasopharyngeal carcinoma (NPC) in southern Chinese, North Africans, and native Alaskans (67). In most EBV-associated malignancies and during replicative infection, EBV expresses latent infection membrane protein 1 (LMP1). LMP1 transforms rodent fibroblasts, as indicated by cell growth in lower serum concentrations, loss of contact inhibition, and anchorage independence (1, 44, 65). LMP1 is also essential for EBV conversion of human B lymphocytes to lymphoblastoid cell lines (LCLs) (32, 34).
LMP1 is a 62-kDa, self-aggregating, integral membrane protein that constitutively activates NF-κB, p38, Jun N-terminal protein kinase (JNK), exracellular signaling kinase (ERK), and interferon regulatory factor 7 (IRF7) signaling (19, 35, 66). LMP1 has a 24-amino-acid (aa) cytoplasmic N terminus, six highly hydrophobic transmembrane domains separated by oligopeptide turns, and a 200-aa cytoplasmic C terminus. The LMP1 transmembrane domains mediate homotypic aggregation, lipid raft association, and ligand-independent signaling from two cytoplasmic tail domains known as transformation effect site 1 (TES1) and TES2, or C-terminal activation region 1 (CTAR1) and CTAR2 (32, 40). TES1 (LMP1 aa 186 to 231) contains a PXQXT motif that engages TRAFs 1, 2, 3, and 5 to stabilize the kinase NIK (HUGO symbol mitogen-activated protein kinase kinase kinase 14 [MAP3K14]). Activated NIK phosphorylates the kinase IKKα (CHUK), causing proteasomal processing of the NF-κB subunit p100 (NF-KB2) into the p52 form (13, 33, 41). p52 homodimers, or heterodimers with RelA, RelB, c-Rel (REL), p50 (NF-κB1), or BCL3, translocate to the nucleus to regulate transcription (42). LMP1 TES2 (residues 351 to 386) engages the death domain-containing proteins TRADD and RIP (RIPK1), as well as IRF7 (27, 50, 58). TES2 requires the E3 ubiquitin ligase TRAF6 to activate the MAPKs, IRF7, and canonical NF-κB pathways (7, 41, 51, 68). TES2 stimulates TRAF6 to polymerize K63-linked ubiquitin chains that activate the kinase TAK1 (MAP3K7). TAK1 in turn activates the kinase IKKβ (IKBKB), in complex with IKKα and the scaffold IKKγ (IKBKG) (68). The activated IKKα/β/γ complex phosphorylates IκBα at serines 32 and 36, which recruits the SCFβ-TRCP (BTRC) E3-ubiquitin ligase. SCFβ-TRCP ubiquitinates IκBα (NFKBIA) with K48-linked ubiquitin chains. Polyubiquitinated IκBα is degraded by proteasomes, allowing canonical NF-κB complexes to enter the nucleus (23). Cross talk exists at multiple levels between the canonical and noncanonical pathways (54).
IκBα mutants that lack serines 32 and 36 are refractory to IKK/SCFβ-TRCP-mediated proteasome degradation and “superrepress” NF-κB. Such nondegradable IκBα mutants sequester NF-κB complexes in the cytosol. Since LCLs require LMP1-mediated NF-κB activation for growth and survival, expression of an IκBα superrepressor promotes LCL apoptosis (10).
NF-κB complexes are homo- or heterodimers of five transcription factors: RelA, c-Rel, RelB, p50, and p52. RelA and p50 heterodimers are prototypes for canonical NF-κB. Activated NF-κB complexes bind to specific DNA response elements in promoters or enhancers and recruit coactivators or corepressors (23). Whereas all NF-κB transcription factors contain DNA-binding domains, only RelA, RelB, and c-Rel have transcription activation domains (TADs). Homodimers of p50 or p52 or p50/p52 heterodimers negatively regulate transcription or recruit TAD-containing coactivators, such as BCL3, to upregulate target gene expression (23). LMP1 TES2, as well as other canonical NF-κB stimuli, promotes phosphorylation of RelA serines 276 and 536. RelA phosphorylation stimulates p300 (EP300) to acetylate RelA lysine 310, which further activates transcription (12).
NF-κB activation also induces negative regulators that suppress NF-κB activation. Induced IκBα relocalizes NF-κB complexes to the cytosol. A20 (TNFAIP3) and cofactors RNF11, TAX1BP1, and ABIN1 (TNIP1) replace K63-linked activation-associated ubiquitin chains on IKKγ and RIP with K48-linked ubiquitin chains, which cause IKKγ and RIP proteasomal degradation. The mechanisms through which LMP1 balances positive and negative regulation to maintain persistent, high-level NF-κB activation are unknown.
We investigated the effects of LMP1 TES2 in activation of NF-κB, p38, JNK, ERK, and IRF7 pathways and the dependence of these other pathways on canonical NF-κB activation, and we found that canonical NF-κB activation was required for LMP1 TES2 effects on all but 5 RNAs in HEK-293 cells.
MATERIALS AND METHODS
Cell lines.
An LMP1 double point mutant (P204A Q206A) was used to construct a HEK-293 TET-On LMP1 TES2 cell line (28). Stable cell clones were selected that carry an inducible system for LMP1 TES2 expression. The Tet system is composed of three parts: (i) the LMP1 TES2 cDNA cloned into the tetracycline-regulated pJEF vector; (ii) a tetracycline suppressor (tTS) that binds Tet operator sites in the absence of tetracyclines and silences expression; (iii) a reverse tetracycline transactivator fused to the 4-hydroxy tamoxifen (4HT) ligand-binding domain (rTTA M2). LMP1 expression was induced by addition of doxycycline (1 μg/ml) and 4HT (100 nM). For simultaneous inducible expression of LMP1 TES2 and an IκBα superrepressor, a stable cell line was derived. A pJEF vector encoding IκBα residues 37 to 317 was introduced into the inducible LMP1 TES2 cell line (11). Cell lines were cultured with Dulbecco's modified Eagle's medium (Gibco) supplemented with 10% tetracycline-free serum (Clontech). All cell lines were profiled within the first 10 passages.
Antibodies.
The following antibodies were used in this study: anti-LMP1 monoclonal antibody S12 and anti-FLAG M2 (both from Stratagene) and, from Cell Signaling, anti-phospho-p38 (9211), anti-phospho-JNK (9251), anti-phospho-ERK (9101), anti-phospho-RelA 536 (3033), total p50 (3053), anti-phospho Iκbα (9246), and anti-IκBα (9242).
RNA preparation, transcription profiling, and real-time RT-PCR.
RNA samples were collected using RNABee (Qiagen) according to the manufacturer's instructions with 293 cells induced for LMP1 TES2 and superrepressor expression, as indicated. Cells were in the log phase of growth. Gene expression profiles were assayed using the Affymetrix HU-133 Plus2 GeneChip apparatus according to the manufacturer's instructions. Real-time reverse transcription-PCR (RT-PCR) was performed with the Power SYBR green RNA-to-CT 1-step kit (Applied Biosystems, Foster City, CA). Fold changes were determined using the ΔΔCT method and normalized by glyceraldehyde-3-phosphate dehydrogenase (GAPDH) expression levels.
Microarray preprocessing analysis.
RNA expression data were normalized using RMA, and array quality was assessed based on normalized unscaled standard error (NUSE) and relative log expression (RLE) scores (25, 26). The microarray data were collected according to methods that fall under the MIAME standards (8).
Filtering probe sets.
In cases where multiple probe sets mapped to a single gene symbol, we retained only the probe set associated with the most significant change across the 24-h time course (the probe set with the lowest P value from the analysis of variance [ANOVA] model was retained).
Determining genes significantly regulated by LMP1 TES2 and TES2 and canonical NF-κB.
To identify genes significantly regulated by LMP1 TES2, we fit a linear model using the LIMMA package to detect genes with expression profiles that deviated significantly across the 24-h time course (57). P values from this linear model were adjusted for multiple correction using the Benjamini-Hochberg method, which controls the false discovery rate (4). Significance was defined as those genes satisfying an adjusted P value of <0.001 and having an absolute fold change at 24 h versus 0 h of greater than 2. To identify genes significantly regulated by TES2 and canonical NF-κB, we applied the same LIMMA linear model to the expression data collected in the presence of the superrepressor. P values were adjusted using the Benjamini-Hochberg method, and the same threshold criteria were applied. For gene symbols represented by multiple probe sets on the Affymetrix array, the probe set with the most significant (highest) P value from the LIMMA linear models was retained.
Heat maps.
Heat maps were created using MeV (version 4.5.0). Upregulated and downregulated genes were defined according to whether a gene had a positive or negative log2 fold change, respectively.
Hierarchical clustering.
A complete linkage agglomerative hierarchical clustering was applied, since this method produced a more stable set of clusters than the average linkage clustering. Distance was based on the Pearson correlation coefficient (14). Hierarchical clustering was applied to the upregulated and downregulated LMP1 TES2 genes separately. Cluster analysis was performed using the R cluster package (version 1.12.3).
GSEA.
Gene set enrichment analysis (GSEA) was performed using the GSEAlm package (version 1.8.0) (29). Gene sets were defined by Kyoto Encyclopedia of Genes and Genomes (KEGG) pathways, and genes that were annotated to at least one KEGG pathway were included in the analysis. This implementation of GSEA looks for consistent enrichment in a KEGG pathway with respect to expression changes at 0 versus 24 h of LMP1 TES2 expression. GSEA was run on a linear model with LMP1 TES2 time points as covariates, using 1,000 permutations.
Lymphoblastoid cell line GM12878 RelA Chip-Seq peak calling.
LCL RelA Chip-Seq data were downloaded from the Snyder Laboratory (Yale University) and are available at http://hgdownload.cse.ucsc.edu/goldenPath/hg18/encodeDCC/wgEncodeYaleChIP-seq/. RelA DNA-binding peaks were identified using QuEST. A total of 24,796 RelA-binding sites were identified genome-wide with an FDR of <0.01. RelA peaks were present in the promoter and introns of 4,511 and 4,737 genes, respectively.
Functional enrichment analysis.
Using Fisher's exact test, available in the GOstats Bioconductor R package, we tested for overenrichment of the following gene ontology terms: biological process (BP), molecular function (MF), and cellular component (CC). With each annotation set, P values were adjusted using the Benjamini-Hochberg method, and a statistical significance criterion of 0.1 was used to identify significant functional categories. For the analyses described in this paper, we made use of the annotation packages available in the latest release of Bioconductor (Biobase 2.8.0, hgu133plus2.db version 2.4.1, KEGG database version 2.4.1).
Protein-protein network construction.
Cytoscape (version 2.6.3) was used for visualizing protein-protein interactomes (56). Edges represent protein-protein interactions present in the Biogrid database (release 3.1.69) (9). The NF-κB interactome was seeded with a manually curated list of NF-κB pathway proteins, based on the Biocarta NF-κB signaling pathway (www.biocarta.com). To identify functional modules, we used the FAG-EC algorithm as implemented in the ClusterViz Cytoscape plug-in (37). We selected an in-degree/out-degree threshold value of 2.0 (37). Setting the minimum size to five nodes, we ranked “weak” modules by modularity and selected the top 10 to study further. GO term enrichment was carried out using FuncAssociate 2.0 (6). Five modules that showed significant functional enrichment (with adjusted P values of less than 0.05) are presented in Fig. S2 of the supplemental material.
Microarray data accession number.
The microarray sequence data are freely available for download from the ArrayExpress database (accession number GSE29297).
RESULTS
LMP1 TES2 significantly upregulated 1,479 RNAs and downregulated 437 RNAs.
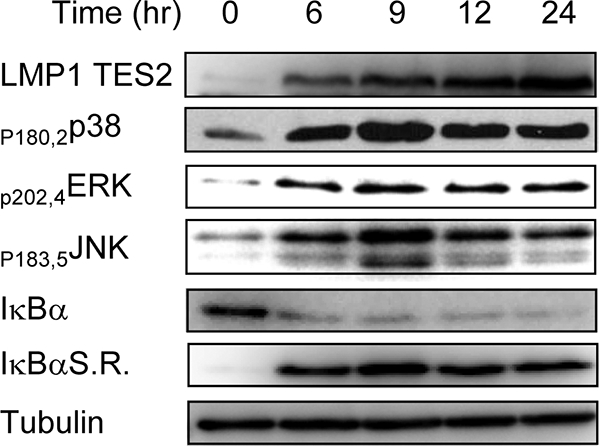
HEK-293 cell clones with inducible LMP1 expression were used. To study signaling from the LMP1 TES2 domain, we used a TES1 double point mutation (P204A Q206A) to selectively abrogate TRAF recruitment (28). A tight Tet-On system was used to control LMP1 TES2 expression. NF-κB, p38, ERK, and JNK were activated concordantly with LMP1 expression (Fig. 1). Canonical NF-κB activation was evident in IκBα serine 32 and 36 phosphorylation and RelA serine 276 and 536 phosphorylation (Fig. 1; see also Fig. S1 in the supplemental material).
Fig. 1.

LMP1 TES2-inducible expression activates p38, ERK, JNK, and NF-κB pathways with similar kinetics. Western blot assays were performed with phospho-specific antibodies to p38 (serines 180 and 182), ERK (serines 202 and 204), JNK (serines 183 and 185), and RelA (serine 536). LMP1 TES2 expression was induced at time zero. Lysates from TNF-α-treated cells (10 ng/ml for 15 min) are shown as a positive control.
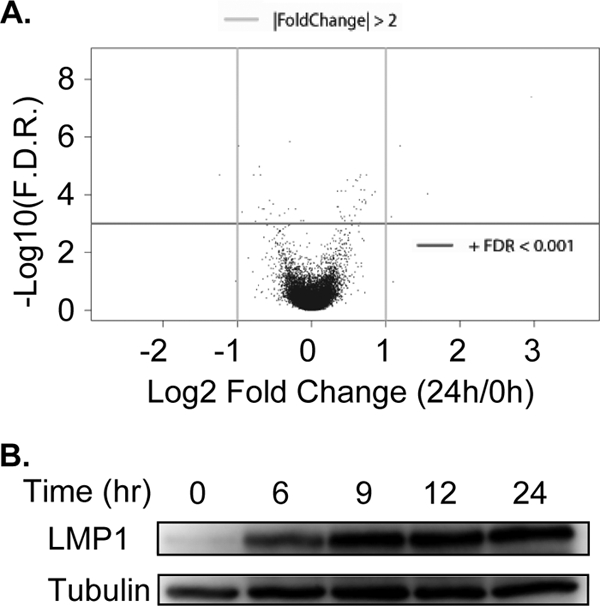
To identify the LMP1 TES2 effects on genome-wide RNA levels, triplicate RNA samples were collected at 0, 6, 9, 12, and 24 h after induction of LMP1 expression. RNAs were assayed on Affymetrix HU-133 Plus 2.0 oligonulcleotide arrays, which include 54,675 probe sets that measure 47,400 transcripts and 19,576 unique genes (based on mappings available from BioConductor [see Materials and Methods]). We fitted a linear model using the LIMMA package to identify RNAs that changed significantly in response to LMP1 TES2, after Benjamini-Hochberg P value correction for multiple hypotheses (4). Overall, 9,446 array elements changed, with an adjusted P value of <0.001, which allows for 2 false positives in the 19,576 unique gene analysis. Applying both an FDR of <0.001 and the threshold for change greater than 2-fold (up- or downregulated), 2,921 probe sets for 1,916 genes changed in response to LMP1 TES2. LMP1 TES2 upregulated 1,479 RNAs and downregulated 437 RNAs (Fig. 2; see also Table S1 in the supplemental material). Genes most upregulated by TES2 include the chemokines interleukin-8 (IL-8; 12.3-fold), CCL20 (6.2-fold), and CXCL10 (2.3-fold), and the CXCR4 chemokine receptor (6.3-fold). LMP1 TES2 also significantly upregulated IL-32 (5.9-fold) and the IL-6 receptor complex, including IL6R (3.9-fold) and IL6ST (3.7-fold). IL-6 RNA levels did not change significantly, consistent with the previously reported dependence on LMP1 TES1 (15). LMP1 TES2 also markedly increased mRNAs for the tumor necrosis factor (TNF) receptor superfamily members 4-1BB (TNFRSF9; 12-fold), RANK (TNFRSF11A; 3.6-fold), FAS (3.4-fold), and TNFRSF21 (2.5-fold).
Fig. 2.

LMP1 TES2 significantly alters the abundance of numerous cell RNAs. (A) Volcano plot showing effects of 24 h of LMP1 TES2 expression on cell RNAs. Each cell RNA is represented by a dot in the 2-dimensional space. The x axis is defined by the log2 fold change in gene expression at 0 versus 24 h, and the y axis by is the log-adjusted P value. (B) Western blot analysis of LMP1 TES2 expression across the time course.
LMP1 TES2 expression maintained effects on most RNAs once established, despite early and sustained increases in RNAs that encode negative regulators of NF-κB (Fig. 3). LMP1 TES2 expression upregulated RNAs encoding IκBα (4.7-fold), the deubiquitinating enzymes A20 (5.2-fold) and CYLD (3-fold), A20 cofactors TAX1BP1 (2.7-fold) and ABIN1 (2.1-fold), optineurin (OPTN, 1.9-fold), TANK (5.2-fold), the IKKβ phosphatase (38) PPM1B (3.1-fold), and zinc finger RNase ZC3H12c (3.4-fold). ZC3H12c may inhibit NF-κB activation by degrading RNAs that encode pathway signaling components, as described for ZC3H12a (39, 43). Thus, LMP1 effects sustained across the 24-h time course are likely due to LMP1 TES2 constitutive forward signaling.
Fig. 3.

LMP1 TES2 strongly upregulates RNAs that encode the NF-κB inhibitors IκBα and A20. RNA was prepared in triplicate from cells induced for LMP1 TES2 expression for 0, 6, 9, 12, and 24 h. Log2 RMA-normalized RNA levels are shown on the y axis.
LMP1 TES2 upregulated RNAs that encode other NF-κB pathway components, including cIAP2 (BIRC3; 4.5-fold), RAP1a (4.6-fold), RAP2c (4.1-fold), TPL2 (MAP3K8; 2.9-fold), p100 (2.8-fold), RIPK2 (2.7-fold), PELI1 (2.5-fold), c-Rel (2.3-fold), TAK1 (2.3-fold), IκBζ (NFKBIZ; 2.2-fold), IKKα (2.2-fold), IKKβ (1.6-fold), and TAB3 (MAP3K7IP3; 1.5-fold). LMP1 TES2 also downregulated mRNAs that encode the NF-κB negative regulators TRAFD1 (−2.2-fold) and COMMD10 (−2.6 fold). MAP kinase pathway factor RNAs that were also upregulated included JNK activators MAP4K3 (3.2-fold) and MAP4K4 (2.3-fold). JUNB was likewise upregulated by TES2 (3.2-fold).
Many LMP1 TES2-regulated RNAs encode proteins that assemble into an extensive NF-κB interactome (Fig. 4). The network was initially seeded with well-established NF-κB pathway core components, based on the Biocarta database, and supplemented with a manually curated list. The Biogrid database (9) was then searched to identify protein-protein interactions between core NF-κB components and factors encoded by LMP1 TES2-regulated RNAs (Fig. 4). Interestingly, the majority of network nodes (89 of 104) are upregulated by LMP1 TES2. Densely interconnected nodes include UBC13 (UBE2N), TRAF6, TAK1, IKKγ, IKKα, IKKβ, RelA, and p50.
Fig. 4.

LMP1 TES2 regulates RNAs that encode multiple NF-κB pathway components and their direct protein-protein interactors. Core NF-κB pathway components (based on Biocarta) are depicted as diamonds. Edges indicate protein-protein interactions (Biogrid) between NF-κB pathway components and LMP1 TES2 targets. Nodes are shaded by the magnitude of TES2 effects; upregulated and downregulated targets are shaded red and blue, respectively. HUGO nomenclature was used.
Surprisingly, LMP1 TES2 strongly downregulated RNAs encoding several ribosomal proteins: RPS19 (6.6-fold), RPS11 (4.6-fold), and RPS10 (3.6-fold). RNA encoding the USP2 deubiquitinating enzyme was also downregulated 2.8-fold. USP2 associates with TRAF2 and p100, and TNF-α downregulation of USP2 protects hepatocytes from apoptosis (21). Many LMP1 TES2-repressed genes were not NF-κB, JNK, ERK, or p38 pathway components or previously identified transcriptional targets (Table S1 in the supplemental material).
A GSEA, in which gene sets are defined by the KEGG (29), indicated LMP1 TES2-upregulated RNAs were significantly enriched for multiple pathways, including pathways in cancer, Toll-like receptor, B- and T-cell receptor signaling, prostate cancer, apoptosis, small cell lung cancer, and RIG-I-like receptor signaling (all pathways had an adjusted P value of <0.001 [Table 1]). LMP1 TES2 downregulated multiple KEGG pathways, although none achieved statistical significance. By GO molecular function analysis, the most significantly upregulated LMP1-induced categories were Zn-ion binding (242 genes; adjusted P < 0.0003), binding (1,045 components; adjusted P < 0.0003), small conjugating protein ligase activity (38 genes; adjusted P < 0.0004), acid-amino acid ligase activity (38 genes; adjusted P < 0.0005), ligase activity (60 genes; adjusted P < 0.0005), transition metal ion binding (276 genes; adjusted P < 0.002), and ubiquitin protein ligase activity (29 genes; adjusted P < 0.002). The extent to which these GO categories overlap with each other is shown in Table S2 of the supplemental material. The most significantly LMP1 TES2-downregulated GO categories were signal transducer activity and molecular transducer activity (each with 61 genes; adjusted P < 0.06).
Table 1.
KEGG analysis of the top 10 pathways targeted by LMP1 TES2
| KEGG ID no. | Pathway name | P value | No. of genes in pathway | No of pathways targeted by LMP1 |
|
|---|---|---|---|---|---|
| Upregulated | Downregulated | ||||
| 05200 | Pathways in cancer | <0.001 | 326 | 40 | 7 |
| 04660 | T cell receptor signaling | <0.001 | 107 | 13 | 2 |
| 04620 | Toll-like receptor signaling | <0.001 | 98 | 11 | 0 |
| 05215 | Prostate cancer | <0.001 | 89 | 13 | 1 |
| 04210 | Apoptosis | <0.001 | 87 | 12 | 2 |
| 05222 | Small cell lung cancer | <0.001 | 84 | 17 | 0 |
| 04662 | B cell receptor signaling | <0.001 | 75 | 9 | 2 |
| 04622 | RIG-I-like receptor signaling | <0.001 | 70 | 9 | 1 |
| 05120 | Epithelial cell signaling in Helicobacter pylori infection | <0.001 | 68 | 9 | 1 |
| 04920 | Adipocytokine signaling | <0.001 | 66 | 10 | 0 |
Cell proteins encoded by the 1,916 TES2-regulated RNAs assemble into an extensive interactome (see Fig. S2 in the supplemental material). The Cytoscape plug-in ClusterViz (56) was used to identify multiple interconnected modules within the LMP1 TES2-regulated network. Five of these modules are presented in Fig. S2 and are enriched for the GO terms: protein ubiquitination and ubiquitin-protein ligase activity, regulation of fatty acid oxidation and lipid metabolic processes, G2/M transition of cell cycle, G1/S transition of cell cycle, induction of apoptosis by intracellular signals, and cell morphogenesis. Interestingly, LMP1 TES2 upregulates nearly all affected RNAs in these clusters.
Since inflammatory stimuli such as TNF-α induce temporal patterns of gene regulation (22, 53, 61, 63, 69), agglomerative hierarchical clustering was used to determine whether the 1,916 LMP1 TES2-regulated RNAs changed with distinct kinetics. Six clusters were detected, with genes upregulated in four of them (Fig. 5). Within 6 h of LMP1 TES2 induction, the IκBα and RelA serines 536 were substantially phosphorylated (see Fig. S1 in the supplemental material). RNAs from 20 genes were increased at 6 h and were higher at 9 h (Fig. 5, cluster 1). These encoded NF-κB pathway components, such as IκBα, A20, RAP1a, c-Rel, the antiapoptotic protein IER3, and the chemokines IL-8 and CXCL1. RNAs encoded by 7 genes increased at 6 h and increased more substantially again at 24 h (Fig. 5, cluster 2). These encode the noncanonical NF-κB subunit p100, the adhesive ligand JAM2, which binds lymphocyte receptors, and IL-32. RNAs from 1,398 genes decreased slightly at 6 h and then increased ∼4-fold at 9 h (Fig. 5, cluster 3). The most significant KEGG categories within this cluster are ubiquitin-mediated proteolysis (25 genes; adjusted P < 10−14), JAK/STAT signaling pathway (21 genes; adjusted P < 10−9), cell cycle (16 genes; P < 10−6), small cell lung cancer (14 genes; P < 10−7), and renal cell carcinoma (12 genes; P < 10−6). RNAs from 54 genes increased ∼2-fold at 9 h and further increased ∼2-fold from 9 to 24 h (Fig. 5, cluster 4). These encode a variety of proteins, including the NF-κB signal transduction components TPL2 and cIAP2 (BIRC3), the antigen presentation proteins TAP1, TAPBP, and HLA-DQB1, the costimulatory receptor 4-1BB (TNFRSF9), the chemokines CXCL10 and CXCR4, and the T-cell-stimulating cytokine IL-15. RNAs from 430 genes increased ∼2-fold at 6 h and then decreased ∼4 fold at 9 h (Fig. 5, cluster 5). The most significant KEGG categories within this cluster were calcium signaling (9 members; P < 10−5), focal adhesion (9 members; P < 10−4), and MAPK (9 members; P < 10−3.7). RNAs from 7 genes were expressed at high levels at 6 h and decreased ∼3-fold thereafter (Fig. 5, cluster 6).
Fig. 5.

Agglomerative hierarchical clustering analysis revealed distinct temporal patterns of LMP1 TES2 target gene regulation. Triplicate data are shown for each time point.
Overlap with LMP1 RNA targets in EBV-transformed lymphoblastoid cells.
The p50/RelA homodimer is the prototypic canonical NF-κB pathway transcription factor complex. To estimate the extent to which LMP1 TES2 regulates the same genes in EBV-transformed lymphoblastoid cells, we downloaded an Encode RelA Chip-Seq data set. Genome-wide RelA DNA binding was identified using QUEST, using an FDR cutoff of <0.01 (62). RelA DNA binding was detected at the promoter (2 kb upstream of the transcriptional start site) or intron in 868 out of 1,416 (58.6%) 293 cell TES2-upregulated genes. In contrast, RelA DNA binding was detected at the promoter or introns of 120 out of 437 (27%) of 293 cell TES2-downregulated genes. These data are consistent with RelA effects being predominantly upregulatory and suggest overlapping effects on gene sets in LCLs and 293 cells.
An IκBα superrepressor (IκBαSR) inhibits LMP1 TES2 effects on RNA levels.
LMP1 TES2 activates multiple pathways, which can independently, cooperatively, or synergistically increase or decrease RNA levels. To evaluate the extent to which LMP1 TES2 requires canonical NF-κB activity to regulate target genes, LMP1 TES2 was induced together with an IκBα superrepressor in which the first 36 IκBα residues are deleted (11). Changes in RNA levels were determined over 5 time points. Tet-regulated LMP1 TES2 was expressed at similar levels and stimulated p38, JNK, and ERK pathways to a similar extent, despite Tet-regulated IκBα superrepressor expression (Fig. 6 and 7). Although p38, JNK, and ERK were activated at similar levels to cells without IκBαSR coexpression, IκBαSR expression resulted in nearly global ablation of LMP1 TES2 effects on RNA levels. LMP1 TES2 only upregulated 3 RNAs (CALB1, CTH, and INHBE) and downregulated only 2 RNAs (MATR3 and CGA) >2 fold, with an FDR of <0.001 (Fig. 7 to 9). Thus, canonical NF-κB is a critical component of nearly all LMP1 TES2 effects on cell RNA levels. These surprising data were further validated by using reverse transcription-quantitative PCR to independently assess LMP1 TES2 effects on CCL20, IL-8, A20, IκBα, and cIAP2 RNA levels (see Fig. S3 in the supplemental material).
Fig. 6.
LMP1 TES2 activates p38, JNK, and ERK in the presence of an IκBα superrepressor (IκBαSR). Data for Western blot analysis of LMP1 TES2-induced MAPK phosphorylation, degradation of endogenous IκBα, and IκBαSR expression across the time course are shown. LMP1 TES2 and IκBαSR expression were induced at time zero.
Fig. 7.
LMP1 TES2 requires canonical NF-κB activity to regulate essentially all cell target genes. (A) Volcano plot showing effects of 24 h of LMP1 TES2 expression on cell gene transcription in the presence of an IκBα superrepressor (SR). (B) Western blot analysis of LMP1 TES2 expression in profiled samples.
Fig. 8.

LMP1 TES2 requires NF-κB activity to upregulate target genes. Median-centered time course expression profile data are shown for the top 20 LMP1 TES2-upregulated RNAs in the absence (left) or presence (right) of an IκBα superrepressor (SR). *, the IκBαSR message is recognized by the IκBα microarray probe set (gene symbol, NFKBIA). HUGO nomenclature was used.
Fig. 9.

LMP1 TES2 requires NF-κB activity to downregulate target genes. Median-centered time course expression profile data are shown for the top 20 LMP1 TES2-downregulated RNAs in the absence (left) or presence (right) of an IκBα superrepressor (SR). HUGO nomenclature was used.
The unexpectedly essential NF-κB role in almost all LMP1 TES2 RNA effects is surprising. Nevertheless, the effects were not due to initiation of cell death pathways, and hypodiploid cells did not accumulate following LMP1 TES2 and IκBαSR expression (see Fig. S4 in the supplemental material). Furthermore, cells expressing both LMP1 TES2 and IκBαSR robustly activated MAPK pathways, degraded endogenous IκBα in response to LMP1 TES2 expression, and maintained similar LMP1 and IκBαSR levels (Fig. 6).
DISCUSSION
The extent to which LMP1 TES2 requires NF-κB activity to affect target genes has not previously been characterized on either a genome-wide scale or in a non-B-cell context. We chose a 293 cell background, because LMP1 TES2 NF-κB inhibition does not result in cell death. Surprisingly, despite robust activation of the p38, ERK, and JNK pathways, NF-κB activity was critical for LMP1 TES2 effects on all but 5 target genes. The profound IκBα superrepressor effect is at least in part due to an important direct role for NF-κB transcription factors in target gene regulation. NF-κB may serve as a master controller of transcriptional responsiveness to LMP1 TES2 signaling, as has been reported for the inflammatory response (46). Of note, both canonical and noncanonical NF-κB may be affected by the IκBα superrepressor, given the extensive cross talk between the two pathways. Alternatively, LMP1/NF-κB may regulate expression of a target gene(s) important for transcriptional responsiveness. For example, NF-κB activity may be required for the synthesis of enzymes that directly or indirectly modify chromatin, such as histone acetyl-deacetylases, methyltransferases, ubiquitin ligases, or kinases. In this fashion, NF-κB may regulate the ability of other transcription factors to gain access to their DNA-binding sites (24, 55). Additional MAPK pathway dependence has been described for a limited number of LMP1 TES2-affected RNAs, including IL-8 (16). The extent to which p38, JNK, ERK, and IRF7 pathways are also required remains an open question for most LMP1 TES2 targets. Nevertheless, these data indicate that LMP1 TES2 broadly alters cell gene regulation in an NF-κB-dependent fashion. The results presented here provide new evidence for the therapeutic importance of canonical NF-κB activation in EBV-associated malignancies and perhaps for malignancies with elevated NF-κB states more generally. Numerous canonical NF-κB pathway inhibitors are currently in clinical development and may have more pronounced effects on EBV-infected cells than previously envisaged (11).
Inducible LMP1 TES2 expression significantly affected 1,916 cell RNAs >2-fold with an FDR of <0.001, upregulating 1,479 RNAs and downregulating 437 RNAs. In contrast, TNF-α treatment of 3T3 fibroblasts for 12 h upregulated only 180 RNAs and downregulated 70 RNAs, based on a 2-fold cutoff (22). Similarly broad LMP1 effects were observed on 1,926 RNAs upon electroporation of LMP1 into purified human germinal center B cells (64). Likewise, LMP1 upregulated by >2-fold 131 of 1,905 (7%) RNAs sampled in Burkitt lymphoma BL41 cells (10). Twenty-seven of these 131 (21%) BL41 LMP1 target genes were also 2-fold upregulated by LMP1 TES2 in 293 cells. These included the antiapoptotic proteins BCL2, cIAP2, MCL1, and cFLIP (CFLAR), the chemokine CXCL10, the cytokine IL-32, the antigen presentation molecules TAP1 and HLA-DQB1, the transcription factors p100 and JUNB, the NF-κB negative regulators IκBα, A20, and CYLD, the ubiquitin ligase CBLB, and cell surface receptors (FAS, CD44, CD58, and CD83). Differences in microarray platform and the presence of both LMP1 TES1 and TES2 limited comparisons between our 293 cell results and available LMP1 B-cell data sets.
We observed a greater overlap between LMP1 293-upregulated genes and RelA LCLs by Chip-Seq analysis, where RelA occupancy was detectable at 58.6% of LMP1 TES2 293 cell targets. Taken together, these data suggest that there is a significant but limited overlap in LMP1 TES2-regulated genes in 293 versus B-cell contexts. Differences in chromatin accessibility between cell types may profoundly shape transcriptional responses to LMP1 TES2, as has been observed for inflammatory gene expression programs in macrophages versus fibroblasts (18). Differences in basal expression levels between 293 and BL41 cells also contribute to the observed LMP1-induced fold changes.
The onset of LMP1 TES2 expression was tightly coupled to LMP1 effects on RNA levels. Concurrent with LMP1 TES2 expression, NF-κB and MAPK pathway activation were evident by the 6-h time point (Fig. 2). LMP1 TES2 affects the abundance of a small subset of RNAs by 6 h and substantially affects most target genes by the 9-hour time point. Similarly diverse kinetic responses have been observed following stimulation with proinflammatory stimuli, such as TNF-α or lipopolysaccharide (LPS) (22, 46, 61). Although TNF-α and LPS trigger rapid NF-κB nuclear translocation, NF-κB recruitment to individual target gene loci is highly asynchronous (18, 46). NF-κB immediately binds to regulatory elements of so-called “fast gene” loci. Yet, at “slow gene” loci, binding to regulatory elements occurs hours after NF-κB nuclear translocation. Differences in chromatin configuration may underlie this phenomenon. Fast gene loci constitutively exhibit an open chromatin state, which allows NF-κB transcription factors immediate access to their binding sites. By contrast, slow gene loci must undergo chromatin remodeling prior to NF-κB binding (18, 46).
Transient changes associated with chromatin remodeling might also underlie the observation that LMP1 TES2 initially downregulates the abundance of many RNAs that are subsequently upregulated (Fig. 5, cluster 3) and initially upregulates RNAs that are subsequently downregulated (cluster 5). Alternatively, early LMP1-affected RNAs may encode important transcriptional regulatory functions. Genes that are expressed early may directly or indirectly affect transcription factor expression or functionality and, in aggregate, reverse the direction of affected gene transcriptional regulation. For example, one or more genes in cluster 1 may have profound transcriptional regulatory effects. Identification of the gene(s) responsible for these effects would be of considerable interest. Surprisingly, the abundance of most cell RNAs did not change substantially after 9 h. These results contrast with a prior study, in which LMP1 induction of IL-1α and IL-1β was suggested to secondarily account for most LMP1 effects on epithelial cell RNA regulation (45). Indeed, LMP1 TES2-inducible expression activates NF-κB more robustly than culture of the cells with high concentrations of IL-1β (unpublished data).
In contrast to many physiologic NF-κB stimuli that transiently activate NF-κB and are then silenced by multiple negative feedback regulatory loops, LMP1 TES2 constitutively activated NF-κB. TNF-α stimulation of murine embryonic fibroblasts induced more heterogenous RNA changes and distinctive RNA changes (22). TNF-α-upregulated RNAs peaked at 30 min or 2 h, or they continued to increase across 12 h of TNF-α stimulation. TNF-α transiently upregulated many RNAs, despite continued TNF-α stimulation (22). Transcription and mRNA stability contributed to these RNA level effects (22, 53, 61, 63, 69), as likely underlies some of the RNA changes observed here. In multiple instances, TNF-α transiently upregulated the same target genes that LMP1 TES2 persistently upregulates. TNF-α signaling pathways may have evolved to be dependent on multiple factors in addition to NF-κB to limit the duration of inflammatory or innate immune responses. In contrast, LMP1 TES2 may have evolved to provide EBV-transformed cells with relatively persistent NF-κB and MAPK target gene stimulation to better enable cell survival and growth.
Negative regulators of canonical NF-κB, including IκBα, CYLD, A20, TAX1BP1, ABIN1, optineurin, TANK, PPM1B, and ZC3H12C, were among the earliest and most highly TES2-upregulated genes. Nevertheless, LMP1 ligand-independent high-level constitutive forward signaling overcomes much of this underlying negative feedback regulation. Consistent with this possibility, TES2 also induces multiple LMP1/NF-κB pathway activation pathway components, including the kinases TPL2, TAK1, IKKα, and IKKβ. These NF-κB pathway components (Fig. 4) may facilitate robust forward signaling. Small interfering RNA knockdown of each kinase impairs TES2-mediated NF-κB activation in HEK-293 cells (unpublished data). Alternatively, TES2 may alter the activity of negative regulators through undefined posttranscriptional mechanisms.
LMP1 is expressed at a high level in latency III infection of LCLs, where it is essential for lymphoblastoid cell growth, both through TES1 noncanonical and TES2 canonical NF-κB activation. LMP1 is also expressed at very high levels in HD and at a variable level in NPC. A robust inflammatory response is commonly observed in EBV latency III-associated lymphoproliferative diseases, HD and NPC. Indeed, NPC was initially described as a lympho-epithelial malignancy. Proinflammatory cytokines promote tumor development, progression, and metastasis (2, 3, 20). LMP1 TES2 upregulates both chains of the IL-6 receptor complex. While TES2 did not significantly upregulate IL-6, LMP1 TES1 has been reported to upregulate IL-6 in epithelial cells (15). IL-6 provides a link between inflammation and cancer (30). IL-6 levels are elevated in both serum and tumor tissues of NPC patients and decrease with successful tumor therapy (59). Thus, LMP1 TES1 and TES2 may function in concert to provide significant growth factor support to cells of patients with latency III-associated lymphoproliferative diseases, HD and NPC. Anti-IL-6 monoclonal antibodies are currently in trial for treatment of EBV-positive posttransplant lymphoproliferative disorders (47).
IL-8, CCL20, and CXCL10 are among the RNAs most highly upregulated by TES2. CCL20 is a powerful chemoattractant for immature dendritic cells and effector/memory B and T lymphocytes, particularly at skin and mucosal surfaces (52). An IL-8 promoter polymorphism has been associated with NPC susceptibility and aggressiveness (5). CXCL10 is highly upregulated in primary NPC clinical samples and is LMP1 dependent (36). LMP1 TES2 canonical NF-κB activation appears to underlie CXCL10 expression. Furthermore, LMP1 TES2 highly upregulates IL-32, a recently discovered cytokine that further activates MAPK and NF-κB pathways. IL-32 is also implicated in the development of epithelial cancers (17). IL-32 is likewise upregulated in BL41 cells upon LMP1 expression (10). Encode Project LCL Chip-Seq data have identified high-level RelA occupancy at the IL-32 locus, together with RNA polymerase 2 and histone modifications, suggestive of active transcription (31). Small-molecule inhibitors of LMP1-mediated canonical NF-κB activation may have antineoplastic activity by blocking both intracellular and intercellular effects that sustain NPC or HD cell growth or survival.
In conclusion, the studies presented here provide the first whole-genome kinetic analysis of LMP1 TES2 transcriptional effects and demonstrate a surprisingly robust LMP1 TES2 NF-κB dependence. The extent to which LMP1 TES1 also requires NF-κB to regulate target genes remains incompletely defined. Likewise, the amount of overlap between LMP1 TES1 and TES2 transcriptional targets remains unknown. While several LMP1 target genes, such as TRAF1 and the epidermal growth factor receptor, are preferentially induced by LMP1 TES1, other targets, such as Fas and intercellular adhesion molecule 1, are similarly upregulated by both LMP1 TES1 and TES2 (13, 60). Given the importance of both TES1 and TES2 signaling in EBV-associated malignancies, genome-wide analysis of TES1 transcription effects is of significant interest.
Supplementary Material
ACKNOWLEDGMENTS
B.E.G. is a fellow of the Leukemia and Lymphoma Society and the Karin Grunebaum Cancer Foundation. This work was supported by NCI RO1, 1K08CA140780-01, 5R01CA085180-10, and 5P50HG004233-04. N.P.S. was supported by T32 training grant 5T32CA009031-33.
We thank Daniel Portal and Thomas Sommerman for helpful discussions and critical review of the manuscript.
Footnotes
Supplemental material for this article may be found at http://jvi.asm.org/.
Published ahead of print on 4 May 2011.
REFERENCES
- 1. Baichwal V. R., Sugden B. 1988. Transformation of Balb 3T3 cells by the BNLF-1 gene of Epstein-Barr virus. Oncogene 2:461–467 [PubMed] [Google Scholar]
- 2. Beider K., et al. 2009. Interaction between CXCR4 and CCL20 pathways regulates tumor growth. PLoS One 4:e5125. [DOI] [PMC free article] [PubMed] [Google Scholar]
- 3. Ben-Baruch A. 2006. The multifaceted roles of chemokines in malignancy. Cancer Metastasis Rev. 25:357–371 [DOI] [PubMed] [Google Scholar]
- 4. Benjamini Y., Hochberg Y. 1995. Controlling the false discovery rate: a practical and powerful approach to multiple testing. J. R. Stat. Soc. Series B 57:289–300 [Google Scholar]
- 5. Ben Nasr H., et al. 2007. Association of IL-8 (-251)T/A polymorphism with susceptibility to and aggressiveness of nasopharyngeal carcinoma. Hum. Immunol. 68:761–769 [DOI] [PubMed] [Google Scholar]
- 6. Berriz G. F., King O. D., Bryant B., Sander C., Roth F. P. 2003. Characterizing gene sets with FuncAssociate. Bioinformatics 19:2502–2504 [DOI] [PubMed] [Google Scholar]
- 7. Boehm D., Gewurz B. E., Kieff E., Cahir-McFarland E. 2010. Epstein-Barr latent membrane protein 1 transformation site 2 activates NF-κB in the absence of NF-κB essential modifier residues 133–224 or 373–419. Proc. Natl. Acad. Sci. U. S. A. 107:18103–18108 [DOI] [PMC free article] [PubMed] [Google Scholar]
- 8. Brazma A., et al. 2001. Minimum information about a microarray experiment (MIAME)-toward standards for microarray data. Nat. Genet. 29:365–371 [DOI] [PubMed] [Google Scholar]
- 9. Breitkreutz B. J., et al. 2008. The BioGRID Interaction Database: 2008 update. Nucleic Acids Res. 36:D637–D640 [DOI] [PMC free article] [PubMed] [Google Scholar]
- 10. Cahir-McFarland E. D., et al. 2004. Role of NF-kappa B in cell survival and transcription of latent membrane protein 1-expressing or Epstein-Barr virus latency III-infected cells. J. Virol. 78:4108–4119 [DOI] [PMC free article] [PubMed] [Google Scholar]
- 11. Cahir-McFarland E. D., Davidson D. M., Schauer S. L., Duong J., Kieff E. 2000. NF-kappa B inhibition causes spontaneous apoptosis in Epstein-Barr virus-transformed lymphoblastoid cells. Proc. Natl. Acad. Sci. U. S. A. 97:6055–6060 [DOI] [PMC free article] [PubMed] [Google Scholar]
- 12. Chen L. F., et al. 2005. NF-κB RelA phosphorylation regulates RelA acetylation. Mol. Cell. Biol. 25:7966–7975 [DOI] [PMC free article] [PubMed] [Google Scholar]
- 13. Devergne O., et al. 1998. Role of the TRAF binding site and NF-κB activation in Epstein-Barr virus latent membrane protein 1-induced cell gene expression. J. Virol. 72:7900–7908 [DOI] [PMC free article] [PubMed] [Google Scholar]
- 14. Eisen M. B., Spellman P. T., Brown P. O., Botstein D. 1998. Cluster analysis and display of genome-wide expression patterns. Proc. Natl. Acad. Sci. U. S. A. 95:14863–14868 [DOI] [PMC free article] [PubMed] [Google Scholar]
- 15. Eliopoulos A. G., et al. 1997. Epstein-Barr virus-encoded LMP1 and CD40 mediate IL-6 production in epithelial cells via an NF-κB pathway involving TNF receptor-associated factors. Oncogene 14:2899–2916 [DOI] [PubMed] [Google Scholar]
- 16. Eliopoulos A. G., Young L. S. 1998. Activation of the cJun N-terminal kinase (JNK) pathway by the Epstein-Barr virus-encoded latent membrane protein 1 (LMP1). Oncogene 16:1731–1742 [DOI] [PubMed] [Google Scholar]
- 17. Felaco P., et al. 2009. IL-32: a newly-discovered proinflammatory cytokine. J. Biol. Regul. Homeost. Agents 23:141–147 [PubMed] [Google Scholar]
- 18. Ghisletti S., et al. 2010. Identification and characterization of enhancers controlling the inflammatory gene expression program in macrophages. Immunity 32:317–328 [DOI] [PubMed] [Google Scholar]
- 19. Gires O., et al. 1997. Latent membrane protein 1 of Epstein-Barr virus mimics a constitutively active receptor molecule. EMBO J. 16:6131–6140 [DOI] [PMC free article] [PubMed] [Google Scholar]
- 20. Grivennikov S. I., Greten F. R., Karin M. 2010. Immunity, inflammation, and cancer. Cell 140:883–899 [DOI] [PMC free article] [PubMed] [Google Scholar]
- 21. Haimerl F., Erhardt A., Sass G., Tiegs G. 2009. Down-regulation of the de-ubiquitinating enzyme ubiquitin-specific protease 2 contributes to tumor necrosis factor-alpha-induced hepatocyte survival. J. Biol. Chem. 284:495–504 [DOI] [PubMed] [Google Scholar]
- 22. Hao S., Baltimore D. 2009. The stability of mRNA influences the temporal order of the induction of genes encoding inflammatory molecules. Nat. Immunol. 10:281–288 [DOI] [PMC free article] [PubMed] [Google Scholar]
- 23. Hayden M. S., Ghosh S. 2008. Shared principles in NF-κB signaling. Cell 132:344–362 [DOI] [PubMed] [Google Scholar]
- 24. Hori S. 2010. c-Rel: a pioneer in directing regulatory T-cell lineage commitment? Eur. J. Immunol. 40:664–667 [DOI] [PubMed] [Google Scholar]
- 25. Irizarry R. A., et al. 2003. Summaries of Affymetrix GeneChip probe level data. Nucleic Acids Res. 31:e15. [DOI] [PMC free article] [PubMed] [Google Scholar]
- 26. Irizarry R. A., et al. 2005. Multiple-laboratory comparison of microarray platforms. Nat. Methods 2:345–350 [DOI] [PubMed] [Google Scholar]
- 27. Izumi K. M., et al. 1999. The Epstein-Barr virus oncoprotein latent membrane protein 1 engages the tumor necrosis factor receptor-associated proteins TRADD and receptor-interacting protein (RIP) but does not induce apoptosis or require RIP for NF-κB activation. Mol. Cell. Biol. 19:5759–5767 [DOI] [PMC free article] [PubMed] [Google Scholar]
- 28. Izumi K. M., Kaye K. M., Kieff E. D. 1997. The Epstein-Barr virus LMP1 amino acid sequence that engages tumor necrosis factor receptor associated factors is critical for primary B lymphocyte growth transformation. Proc. Natl. Acad. Sci. U. S. A. 94:1447–1452 [DOI] [PMC free article] [PubMed] [Google Scholar]
- 29. Kanehisa M., Goto S. 2000. KEGG: Kyoto encyclopedia of genes and genomes. Nucleic Acids Res. 28:27–30 [DOI] [PMC free article] [PubMed] [Google Scholar]
- 30. Karin M. 2009. NF-κB as a critical link between inflammation and cancer. Cold Spring Harb. Perspect. Biol. 1:a000141. [DOI] [PMC free article] [PubMed] [Google Scholar]
- 31. Kasowski M., et al. 2010. Variation in transcription factor binding among humans. Science 328:232–235 [DOI] [PMC free article] [PubMed] [Google Scholar]
- 32. Kaye K. M., Izumi K. M., Kieff E. 1993. Epstein-Barr virus latent membrane protein 1 is essential for B-lymphocyte growth transformation. Proc. Natl. Acad. Sci. U. S. A. 90:9150–9154 [DOI] [PMC free article] [PubMed] [Google Scholar]
- 33. Kaye K. M., et al. 1999. An Epstein-Barr virus that expresses only the first 231 LMP1 amino acids efficiently initiates primary B-lymphocyte growth transformation. J. Virol. 73:10525–10530 [DOI] [PMC free article] [PubMed] [Google Scholar]
- 34. Kaye K. M., Izumi K. M., Mosialos G., Kieff E. 1995. The Epstein-Barr virus LMP1 cytoplasmic carboxy terminus is essential for B-lymphocyte transformation; fibroblast cocultivation complements a critical function within the terminal 155 residues. J. Virol. 69:675–683 [DOI] [PMC free article] [PubMed] [Google Scholar]
- 35. Kaykas A., Worringer K., Sugden B. 2001. CD40 and LMP-1 both signal from lipid rafts but LMP-1 assembles a distinct, more efficient signaling complex. EMBO J. 20:2641–2654 [DOI] [PMC free article] [PubMed] [Google Scholar]
- 36. Li J., et al. 2007. Expression of immune-related molecules in primary EBV-positive Chinese nasopharyngeal carcinoma: associated with latent membrane protein 1 (LMP1) expression. Cancer Biol. Ther. 6:1997–2004 [DOI] [PubMed] [Google Scholar]
- 37. Li M., Wang J., Chen J. 2008. A fast agglomerate algorithm for mining functional modules in protein interaction networks, p. 3–7 Abstr. 2008 Int. Conf. BioMed. Eng. Inform. IEEE Computer Society, Washington, DC [Google Scholar]
- 38. Li S., Wang L., Berman M. A., Zhang Y., Dorf M. E. 2006. RNAi screen in mouse astrocytes identifies phosphatases that regulate NF-κB signaling. Mol. Cell 24:497–509 [DOI] [PMC free article] [PubMed] [Google Scholar]
- 39. Liang J., et al. 2008. A novel CCCH-zinc finger protein family regulates proinflammatory activation of macrophages. J. Biol. Chem. 283:6337–6346 [DOI] [PubMed] [Google Scholar]
- 40. Liebowitz D., Wang D., Kieff E. 1986. Orientation and patching of the latent infection membrane protein encoded by Epstein-Barr virus. J. Virol. 58:233–237 [DOI] [PMC free article] [PubMed] [Google Scholar]
- 41. Luftig M., et al. 2003. Epstein-Barr virus latent membrane protein 1 activation of NF-κB through IRAK1 and TRAF6. Proc. Natl. Acad. Sci. U. S. A. 100:15595–15600 [DOI] [PMC free article] [PubMed] [Google Scholar]
- 42. Luftig M., et al. 2004. Epstein-Barr virus latent infection membrane protein 1 TRAF-binding site induces NIK/IKK alpha-dependent noncanonical NF-κB activation. Proc. Natl. Acad. Sci. U. S. A. 101:141–146 [DOI] [PMC free article] [PubMed] [Google Scholar]
- 43. Matsushita K., et al. 2009. Zc3h12a is an RNase essential for controlling immune responses by regulating mRNA decay. Nature 458:1185–1190 [DOI] [PubMed] [Google Scholar]
- 44. Moorthy R. K., Thorley-Lawson D. A. 1993. All three domains of the Epstein-Barr virus-encoded latent membrane protein LMP-1 are required for transformation of rat-1 fibroblasts. J. Virol. 67:1638–1646 [DOI] [PMC free article] [PubMed] [Google Scholar]
- 45. Morris M. A., et al. 2008. Epstein-Barr virus-encoded LMP1 induces a hyperproliferative and inflammatory gene expression programme in cultured keratinocytes. J. Gen. Virol. 89:2806–2820 [DOI] [PubMed] [Google Scholar]
- 46. Natoli G. 2009. Control of NF-κB-dependent transcriptional responses by chromatin organization. Cold Spring Harb. Perspect. Biol. 1:a000224. [DOI] [PMC free article] [PubMed] [Google Scholar]
- 47. Naugler W. E., Karin M. 2008. The wolf in sheep's clothing: the role of interleukin-6 in immunity, inflammation and cancer. Trends Mol. Med. 14:109–119 [DOI] [PubMed] [Google Scholar]
- 48. Raab-Traub N. 2002. Epstein-Barr virus in the pathogenesis of NPC. Semin. Cancer Biol. 12:431–441 [DOI] [PubMed] [Google Scholar]
- 49. Rickinson A. B., Kieff E. 2001. Epstein Barr virus and its replication, p. 2511–2574 In Knipe D. M., Howley P. M. (ed.), Fields virology, vol. 2 Lippincott Williams & Wilkins, Philadelphia, PA [Google Scholar]
- 50. Schneider F., et al. 2008. The viral oncoprotein LMP1 exploits TRADD for signaling by masking its apoptotic activity. PLoS Biol. 6:e8. [DOI] [PMC free article] [PubMed] [Google Scholar]
- 51. Schultheiss U., et al. 2001. TRAF6 is a critical mediator of signal transduction by the viral oncogene latent membrane protein 1. EMBO J. 20:5678–5691 [DOI] [PMC free article] [PubMed] [Google Scholar]
- 52. Schutyser E., Struyf S., Van Damme J. 2003. The CC chemokine CCL20 and its receptor CCR6. Cytokine Growth Factor Rev. 14:409–426 [DOI] [PubMed] [Google Scholar]
- 53. Schwamborn J., et al. 2003. Microarray analysis of tumor necrosis factor alpha induced gene expression in U373 human glioblastoma cells. BMC Genomics 4:46. [DOI] [PMC free article] [PubMed] [Google Scholar]
- 54. Shih V. F., Tsui R., Caldwell A., Hoffmann A. 2011. A single NFκB system for both canonical and non-canonical signaling. Cell Res. 21:86–102 [DOI] [PMC free article] [PubMed] [Google Scholar]
- 55. Smale S. T. 2010. Pioneer factors in embryonic stem cells and differentiation. Curr. Opin. Genet. Dev. 20:519–526 [DOI] [PMC free article] [PubMed] [Google Scholar]
- 56. Smoot M. E., Ono K., Ruscheinski J., Wang P. L., Ideker T. 2011. Cytoscape 2.8: new features for data integration and network visualization. Bioinformatics 27:431–432 [DOI] [PMC free article] [PubMed] [Google Scholar]
- 57. Smyth G. K. 2004. Linear models and empirical Bayes methods for assessing differential expression in microarray experiments. Stat. Appl. Genet. Mol. Biol. 3:Article3 [DOI] [PubMed] [Google Scholar]
- 58. Song Y. J., Izumi K. M., Shinners N. P., Gewurz B. E., Kieff E. 2008. IRF7 activation by Epstein-Barr virus latent membrane protein 1 requires localization at activation sites and TRAF6, but not TRAF2 or TRAF3. Proc. Natl. Acad. Sci. U. S. A. 105:18448–18453 [DOI] [PMC free article] [PubMed] [Google Scholar]
- 59. Tan E. L., Selvaratnam G., Kananathan R., Sam C. K. 2006. Quantification of Epstein-Barr virus DNA load, interleukin-6, interleukin-10, transforming growth factor-β1 and stem cell factor in plasma of patients with nasopharyngeal carcinoma. BMC Cancer 6:227. [DOI] [PMC free article] [PubMed] [Google Scholar]
- 60. Thornburg N. J., Raab-Traub N. 2007. Induction of epidermal growth factor receptor expression by Epstein-Barr virus latent membrane protein 1 C-terminal-activating region 1 is mediated by NF-κB p50 homodimer/Bcl-3 complexes. J. Virol. 81:12954–12961 [DOI] [PMC free article] [PubMed] [Google Scholar]
- 61. Tian B., Nowak D. E., Brasier A. R. 2005. A TNF-induced gene expression program under oscillatory NF-κB control. BMC Genomics 6:137. [DOI] [PMC free article] [PubMed] [Google Scholar]
- 62. Valouev A., et al. 2008. Genome-wide analysis of transcription factor binding sites based on ChIP-Seq data. Nat. Methods 5:829–834 [DOI] [PMC free article] [PubMed] [Google Scholar]
- 63. Viemann D., et al. 2004. Transcriptional profiling of IKK2/NF-kappa B- and p38 MAP kinase-dependent gene expression in TNF-alpha-stimulated primary human endothelial cells. Blood 103:3365–3373 [DOI] [PubMed] [Google Scholar]
- 64. Vockerodt M., et al. 2008. The Epstein-Barr virus oncoprotein, latent membrane protein-1, reprograms germinal centre B cells towards a Hodgkin's Reed-Sternberg-like phenotype. J. Pathol. 216:83–92 [DOI] [PubMed] [Google Scholar]
- 65. Wang D., Liebowitz D., Kieff E. 1985. An EBV membrane protein expressed in immortalized lymphocytes transforms established rodent cells. Cell 43:831–840 [DOI] [PubMed] [Google Scholar]
- 66. Wang F., et al. 1990. Epstein-Barr virus latent membrane protein (LMP1) and nuclear proteins 2 and 3C are effectors of phenotypic changes in B lymphocytes: EBNA-2 and LMP1 cooperatively induce CD23. J. Virol. 64:2309–2318 [DOI] [PMC free article] [PubMed] [Google Scholar]
- 67. Wei W. I., Sham J. S. 2005. Nasopharyngeal carcinoma. Lancet 365:2041–2054 [DOI] [PubMed] [Google Scholar]
- 68. Wu L., Nakano H., Wu Z. 2006. The C-terminal activating region 2 of the Epstein-Barr virus-encoded latent membrane protein 1 activates NF-κB through TRAF6 and TAK1. J. Biol. Chem. 281:2162–2169 [DOI] [PubMed] [Google Scholar]
- 69. Zhao B., Stavchansky S. A., Bowden R. A., Bowman P. D. 2003. Effect of interleukin-1β and tumor necrosis factor-α on gene expression in human endothelial cells. Am. J. Physiol. Cell Physiol. 284:C1577–C1583 [DOI] [PubMed] [Google Scholar]
Associated Data
This section collects any data citations, data availability statements, or supplementary materials included in this article.