

Abstract
A growing body of data supports a role for protein motion in enzyme catalysis. In particular, the ability of enzymes to sample catalytically relevant conformational substates has been invoked to model kinetic and spectroscopic data. However, direct experimental links between rapidly interconverting conformations and the chemical steps of catalysis remain rare. We report here on the kinetic analysis and characterization of the hydride transfer step catalyzed by a series of mutant thermophilic alcohol dehydrogenases (ht-ADH), presenting evidence for Arrhenius prefactor values that become enormously elevated above an expected value of approximately 1013 s-1 when the enzyme operates below its optimal temperature range. Restoration of normal Arrhenius behavior in the ht-ADH reaction occurs at elevated temperatures. A simple model, in which reduced temperature alters the ability of the ht-ADH variants to sample the catalytically relevant region of conformational space, can reproduce the available data. These findings indicate an impaired landscape that has been generated by the combined condition of reduced temperature and mutation at a single, active-site hydrophobic side chain. The broader implication is that optimal enzyme function requires the maintenance of a relatively smooth landscape that minimizes low energy traps.
Keywords: conformational sampling, site-specific mutagenesis,
A complete understanding of the origins of the remarkable rate acceleration and specificity achieved by enzymes remains elusive. Increasingly, studies on the fundamental basis for enzymatic catalysis have focused on the requirement for a range of protein motions in order to achieve efficient enzyme catalysis. Among these, evidence for a class of motion termed conformational sampling (or preorganization) has begun to accumulate recently (cf. refs. 1–4). The impact of such motions can be seen either in the formation of an enzyme–substrate complex or in its subsequent conversion to product.
For example, a recent study of adenylate kinase implicates a temperature-dependent preequilibrium among conformers that are either “competent” or “incompetent” toward ligand binding (5). In the context of catalysis, studies of single-enzyme molecules indicate multiple, slowly interconverting conformers that lead to product with different rate constants (6–8). Extensive work on dihydrofolate reductase has shown the role of slow loop closures that occur along the reaction coordinate with the same (millsecond) time constants as catalysis (9, 10).
Although computational studies also suggest a role for rapid conformational sampling in enzyme reactions (11, 12), demonstrating the direct link of these motions to catalysis is quite challenging. In this study, we use the thermophilic alcohol dehydrogenase from Bacillus stearothermophilus (ht-ADH) as a system to examine the presence of rapidly interconverting protein substates during catalysis. The ht-ADH catalyzes the transfer of a hydride equivalent from an alcohol donor to an NAD+ cofactor, and previous studies have shown that ht-ADH carries out its reaction via quantum tunneling, with the kinetic parameters and tunneling properties undergoing an abrupt break near 30 °C (13). The observed kinetic changes correlate with a change in enzyme flexibility, as monitored by hydrogen–deuterium exchange (14). Above 30 °C, where the enzyme has greater demonstrable flexibility, a rapid sampling of multiple protein conformers appears essential to achieve the short hydrogen donor–acceptor distances compatible with the observed temperature-independent kinetic isotope effects (13, 15, 16). Below 30 °C, the enthalpy of activation increases by approximately 7 kcal/mol, resulting in a downward break in the Arrhenius plot, while the magnitude and trends in the primary hydrogen kinetic isotope effects rule out a change in rate-determining step. The origins of the break in behavior at 30 °C have generated much interest because, in the absence of trivial origins such as a change in rate-determining step or an irreversible loss of enzyme activity, abrupt changes in the slope of an Arrhenius are not expected.
A number of previous theoretical approaches have explored possible explanations for the experimental results. In one instance, it was shown that convex Arrhenius curves can arise from a temperature-dependent equilibrium between two enzyme conformations with different kinetic properties (17). Alternatively, noting that the Arrhenius prefactor (cf. Eq. 2) takes on an unusually high value (approximately 1017 s-1) below 30 °C, Marcus proposed a glass-like dynamical transition at the experimental breakpoint (18). Such an explanation is consistent with the hydrogen–deuterium exchange measurements indicating decreased flexibility below 30 °C (14). In the present work, we combine site-specific mutagenesis with temperature effects in the ht-ADH, focusing on the two hydrophobic side chains, Val 260 and Leu 176, that reside behind the region where the nicotinamide ring of the cofactor NAD+ is expected to bind. Both residues had been singled out previously as being part of the protein dynamical transition at 30 °C (19) and are further implicated by present modeling of NAD+ into the published X-ray structure for a complex between ht-ADH and an inert alcohol substrate (20) (Fig. 1). Remarkably, the combination of perturbants described herein produces experimental Arrhenius prefactors (Aobs) as large as 1025 s-1. (Aobs, Ea(obs), ΔH‡, and ΔS‡ are used to refer to measured parameters, in distinction from Aint, Ea(int ),  , and
, and  , which refer to a theoretical value intrinsic to a unimolecular decomposition reaction.) Critical controls rule out temperature-dependent protein unfolding or oligomerization, and pH effects, as the origin of the unusual behavior. We propose that highly inflated Arrhenius prefactor values arise as the result of trapping of protein into catalytically inactive regions of conformational space that become increasingly populated below 30 °C. The Arrhenius behavior that emerges from these experimental data provides an unexpected link between protein conformational landscapes and catalysis.
Fig. 1.

Active site of ht-ADH. The NAD+ cofactor (blue) has been modeled into the X-ray structure for ht-ADH, which was solved previously in the presence of trifluoroethanol (red), a substrate analog 21 (20). The side chains of mutated active site residues, L176 (yellow) and V260 (orange) are rendered in spheres.
Results
The impact of mutagenesis at Val 260 and Leu 176 on kinetic parameters is to reduce the value of the unimolecular rate constant kcat 4- to 60-fold at a reference temperature of 30 °C; this is accompanied by elevated values for the Michaelis constant, Km (NAD+), particularly for L176G and L176Δ, and little change in values for Km (alcohol) (Table 1). The values for  at 30 °C indicate that hydride transfer has remained rate-determining in every case (Table 1); in addition, the observed break in the Arrhenius plot for the wild-type enzyme is retained (Fig. 2). Temperature-dependent kinetic data are tabulated in Table S1. Above the breakpoint, the activation parameters of the mutants show only small changes relative to wild type (Table 2). However, at temperatures below the breakpoint, the activation parameters for the mutant enzymes become strikingly divergent (Table 3). In each instance, below approximately 30 °C ΔH‡ is increased and compensated at the break by an equivalent increase in ΔS‡. When an Arrhenius prefactor is calculated from these data, values are found that greatly exceed the expected value of approximately 1013 s-1 (21). A unique feature of this system is the lack of a detectable change in rate for both wild-type and mutant enzymes at their respective temperature breakpoints (Fig. 2), meaning that the abrupt increases in ΔH‡ below the breakpoint necessitate the corresponding increase in Aobs. This allows a precise and reproducible estimate of Aobs values for wild-type and mutant enzymes that is distinct from any uncertainty that may arise from very long extrapolations of Arrhenius plots.
Table 1.
Kinetic parameters for ht-ADH variants at pH 7, 30 °C
| Enzyme | kcat, s-1 | Km (Alcohol), mM | Km (NAD+), mM |
 * *
|
| Wild type | 24.9 (±2.5) | 6.8 (±0.5) | 1.1 (±0.1) | 3.2 (±0.2) |
| L176V | 1.7 (±0.1) | 5.3 (±0.9) | 1.2 (±0.2) | 4.1 (±0.4) |
| L176A | 2.8 (±0.3) | 5.8 (±1.5) | 2.6 (±0.6) | 4.1 (±0.6) |
| L176G | 7.7 (±1.4) | 9.8 (±3.4) | 25 (±8) | 4.0 (±1.1) |
| L176Δ | 0.43 (±0.09) | 7.5 (±3.5) | 37 (±14) | 4.3 (±1.3) |
| V260A† | 2.4 (±0.2) | 4.2 (±0.8) | 10 (±1.6) | 4.1 (±0.7) |
*This is the ratio of kcat measured with H-benzyl alcohol to that measured with D-benzyl alcohol.
†The Arrhenius break for V260A is at approximately 40 °C; the rest are at 30 °C.
Fig. 2.

Arrhenius plots for the wild-type enzyme and the five mutants studied here.
Table 2.
Activation parameters for ht-ADH variants at pH 7, above the Arrhenius break
| Enzyme | ΔH‡, kcal/mol | TΔS‡, kcal/mol | Log(Aobs) |
| Wild type | 14.7 (±0.5) | −1.2 (±0.5) | 12.4 (±0.3) |
| L176V | 17.9 (±0.6) | 0.6 (±0.6) | 13.7 (±0.4) |
| L176A | 15.3 (±0.5) | −1.8 (±0.4) | 12.0 (±0.3) |
| L176G | 15.0 (±0.5) | −1.5 (±0.5) | 12.1 (±0.3) |
| L176Δ | 12.8 (±0.4) | −5.3 (±0.4) | 9.4 (±0.3) |
| V260A* | 13.6 (±1.0) | −3.3 (±0.9) | 10.9 (±0.6) |
*The breakpoint for this mutant is at 40 °C; the rest are at 30 °C. ΔH‡ is the enthalpy of activation, ΔS‡ is the entropy of activation, and Aobs is the observed Arrhenius prefactor, as defined in the text.
Table 3.
Activation parameters for ht-ADH variants at pH 7, below the Arrhenius break
| Enzyme | ΔH‡, kcal/mol | TΔS‡, kcal/mol | log(Aobs) |
| Wild type | 21.4 (±0.8) | 5.6 (±0.8) | 17.2 (±0.6) |
| L176V | 26.9 (±0.7) | 9.6 (±0.9) | 20.2 (±0.7) |
| L176A | 25.8 (±0.3) | 8.8 (±0.3) | 19.6 (±0.2) |
| L176G | 26.7 (±1.1) | 10.2 (±1.1) | 20.6 (±0.8) |
| L176Δ | 34.8 (±1.5) | 16.5 (±1.6) | 25.2 (±1.6) |
| V260A* | 32.3 (±1.3) | 15.4 (±1.4) | 24.1 (±1.0) |
*The breakpoint for this mutants is at 40 °C; the rest are at 30 °C. ΔH‡ is the enthalpy of activation, ΔS‡ is the entropy of activation, and Aobs is the observed Arrhenius prefactor, as defined in the text.
Values of Aobs far in excess of 1013 s-1 indicate an unusual temperature dependence for chemical reactions modeled by transition state theory (21–24). To confirm that this kinetic behavior reflects properties intrinsic to the chemical reaction, we explored possible mechanisms by which processes other than hydride transfer might contribute to the observed temperature dependence of kcat. All mutants show kinetic isotope effects similar to wild-type enzyme with no evidence for a change in rate-determining step as a function of temperature. A number of critical controls were performed using one of the enzymes with the most deviant behavior, V260A. Because wild-type ht-ADH has a rate-controlling pKa that is greater than 7, the pKa for V260A was determined by measuring kcat in the pH range of 6.0 to 9.0 at 10, 30, and 45 °C. As shown in Fig. 3A, the pKa varies only slightly with temperature, with estimated values of 7.6, 7.8, and 7.8 at 45, 30, and 10 °C, respectively. To determine whether the active enzyme tetramer dissociates or aggregates into an inactive form at low temperature, analytical size-exclusion chromatography was performed. At 4 °C, V260A exists overwhelmingly as a tetramer, with no activity observed in the minor peaks eluting as dimer or monomer (Fig. 3B). This rules out trapping of enzyme into inactive oligomers at reduced temperatures. The observed catalytic activity was a linear function of enzyme concentration, further supporting the conclusion that the tetrameric form of enzyme is stable and functional under the assay conditions. To test for temperature-dependent protein unfolding, circular dichroism (CD) spectra were collected at multiple temperatures for V260A and were found to be superimposable with each other, confirming that the secondary structure of the enzyme remains unchanged (Fig. 3C). As an additional test for protein unfolding at low temperature, tryptophan and tyrosine fluorescence were measured and found to decrease monotonically and reversibly both above and below the breakpoint (Fig. 3D). The lack of a detectable break in the CD and fluorescence measurements indicates little or no change in the average structure of the protein, implicating subtle changes in protein dynamics/flexibility as the origin of the observed kinetic effects. Such a conclusion is consistent with earlier hydrogen–deuterium exchange experiments that demonstrated a change in local protein flexibility for the wild-type protein below 30 °C (14).
Fig. 3.

Critical controls for potential origins of unusual Arrhenius behavior in ht-ADH mutants. (A) Arrhenius behavior of V260A at several pH values. Estimates of kcat were made at pH 6.0 (diamonds), 7.0 (closed squares), 8.0 (open squares), and 9.0 (circles). The resulting pKa values at three temperatures (10, 30, and 45 °C) are indicated above the points. (B) Elution profile from a size-exclusion column showing the predominance of the tetrameric form of V260A (peak 1) at 4 °C. (C) Comparison of CD spectra for V260A above (solid line) and below (dashed line) the Arrhenius break. The spectra are essentially superimposable, as shown by the difference spectrum (double line). (D) Fluorescence intensity for V260A at 340 nm as a function of temperature. The enzyme was excited at 280 nm (open squares) or 295 nm (closed squares) to preferentially excite tyrosine and tryptophan, respectively.
Discussion
Mounting data for enzymes that transfer hydrogen by a tunneling mechanism have led to a model for enzyme catalysis that implicates at least two classes of protein motion (15, 16, 25–30). Tunneling has been modeled with an expanded Marcus-like equation that assigns the thermal reaction barrier to the environmental reorganization terms that produce transient degeneracy between reactant and product wells and lead to sampling of a range of donor–acceptor distances (31–33). Because tunneling requires a short donor to acceptor distance (approximately 2.8 Å) that is not represented in static X-ray structures (typical distance of 3.2 to 3.4 Å), the enzyme must be able to sample a range of protein substates in order to achieve a tunneling configuration.
This can be accomplished in two distinct ways. The reduced distance can be reached via a local, picosecond–nanosecond timescale distance sampling contribution to the reorganization barrier (29–40). Evidence for distance sampling has been obtained repeatedly from highly temperature-dependent kinetic isotope effects and has been discussed extensively in the literature (refs. 15, 16, 29–42, and references therein). Alternatively, a second, more global type of motion on the nanosecond–millisecond timescale, termed conformational sampling (preorganization), is capable of a transiently formed, very short donor–acceptor tunneling distance, which eliminates the need for significant distance sampling. This second means of reaching tunneling-ready distances has been invoked in the context of the repeated observation of temperature-independent kinetic isotope effects for enzymes functioning under their physiological conditions and with their preferred substrates (15, 16). Impaired enzyme function in the presence of modifications distal to the active site (16) or at cryogenic temperatures has previously been attributed to the disruption of functional conformational sampling (27, 43). In the present work, we argue that anomalous Arrhenius preexponential factors provide a previously unrecognized probe of the role of conformational sampling in enzyme reactions.
The expectation of experimental values for the Arrhenius prefactor at or below a value of 1013 s-1 has been confirmed for the large majority of chemical reactions (21). When the entropy of activation ΔS‡ takes large positive values, the Arrhenius prefactor will become inflated (see below). Values as large as 1017 s-1 have been reported in the gas phase for small molecule reactions with loose transition states; however, these usually arise for bond rupture reactions that yield two radicals (24). By contrast, the hydride transfer catalyzed by ht-ADH most closely resembles a unimolecular isomerization, and this class of reactions is associated with “tight” transition states (21). In solution, reactions between charged molecules that yield a neutral product are generally associated with positive values for ΔS‡, but again, the resulting Arrhenius prefactor typically falls in the range of 1013–1017 s-1 (44). Although the ht-ADH reaction represents an ion annihilation, this property is preserved both above and below the breakpoint temperature. Reports of values for an Arrhenius prefactor in excess of 1017 s-1 are exceedingly rare, and we are not aware of an instance where a value as large as 1025 s-1 has been measured previously. For reactions proceeding by a tunneling mechanism, a tunnel correction predicts reduced values of Arrhenius prefactor (45), while the Marcus formalism for electron tunneling predicts Arrhenius behavior (46), with values for Aint not expected to greatly exceed 1013 s-1; experimental data for intramolecular electron transfer confirm these expectations (47–51).
For the reasons summarized above, a change in the reorganization barrier is insufficient to explain elevated Aobs values, making it evident that a second process must contribute to the activation parameters for the enzyme below the temperature breakpoint. The moderately inflated value of Aobs ∼ 1017 s-1 for wild-type ht-ADH has been discussed in the context of possible temperature-dependent changes in protein viscosity (18, 52). However, typical changes in preexponentials that have been associated with glass transitions are on the order of an additional factor of 106 (53). The larger elevations of Aobs, approaching an additional 1012-fold in the most extreme ht-ADH variants (Table 3), become much more difficult to model without invoking additional constraints, such as the substate sampling model presented herein.
Kinetic evidence from nonenzymatic reactions supports a model in which conformational substates can contribute to observed kinetic parameters. For example, inflated Aobs values (as large as 1019 s-1) were reported for the desorption of alkanes from metal surfaces (54). In that case, conformational heterogeneity was proposed to contribute to both the activation energies and the preexponential factor Aobs. The presence of multiple interconverting ligand conformers has likewise been linked to altered ΔH‡ and Aobs (via the electronic coupling, HAB) in the context of electron transfer (47). We now propose that the highly unusual temperature-dependent kinetics of ht-ADH mutants (Table 3), together with numerous critical controls for potential trivial origins for the behavior (Fig. 3) and extensive previous characterization of wild-type ht-ADH (13, 14, 55), provide a direct link between conformational substates and observed kinetic parameters for an enzymatic reaction.
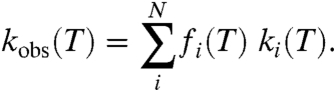
To explain the highly unusual kinetic properties of our ht-ADH mutants, the observed rigidification of the wild-type enzyme below its temperature break (14) is attributed to the induction of a more rugged conformational landscape that is greatly exacerbated by active site mutation. We note that an irreversible “trapping” of conformers into an inactive region of conformational space would result in an abrupt drop in rate (Fig. S1), and a diminished value for Aobs, neither of which is observed in the present case. By contrast, if a very low activity or inactive region of conformational space is increasingly populated below the temperature break, the data can be appropriately modeled using a hypothetical one-dimensional protein conformational landscape, which is depicted in Fig. 4 for illustrative purposes. This phenomenon can be represented mathematically in Eq. 1, where kobs(T) refers to the observed parameter, kcat, as a function of temperature (T):
 |
[1] |
The parameter kobs(T) comprises a sum of rate constants ki associated with an ensemble of conformers i, weighted by the fraction of enzyme fi that can be found in conformer i. Eq. 1 is, in fact, a general distribution function for the conformational ensemble sampled by the enzyme–substrate complex. In the event that heat is needed in order to reequilibrate stable, inactive conformers into a catalytically relevant region of conformational space, Eq. 1 introduces an additional temperature-dependent term into the final rate constant that now contains the product of two exponential functions.
Fig. 4.

Simulation of conformational sampling that leads to elevated values of Aobs. The conformational landscape of the enzyme is represented by a solid black line in panels A–C, with energy increasing along the vertical axis. Four states (i = 1–4) available to the enzyme are numbered, and the fraction of enzyme fi occupying each conformer is proportional to the number of black dots, with one dot = 1% of the enzyme. States 1, 2, and 3 are designated as the catalytically active region of the conformational space, and state 4 is inactive (k4 = 0 at all temperatures). (A) At 5 °C k1, k2, and k3, which represent the intrinsic rate constant for the corresponding conformers, are all set at 20 s-1. Using Eq. 2, the observed rate constant is calculated as f1 ∗ k1 + f2 ∗ k2 + f3 ∗ k3 + f4 ∗ k4 = 0.01 ∗ 20 + 0.01 ∗ 20 + 0 ∗ 20 + 0.98 ∗ 0 = 0.4 s-1. (B) At 20 °C the fractional occupation of the respective conformers has shifted, and the intrinsic rate constant for conformers 1–3 has increased. When the observed rate constant is calculated again, a value of 8.0 s-1 is obtained. (C) At temperatures above 30 °C deep local minima are avoided, as a result of a cooperative transition that eliminates the low energy trap from the conformational ensemble. The behavior represented in C is expected to be representative of native enzymes under optimal conditions. (D) An Arrhenius plot for V260A demonstrates how temperature-dependent sampling of active conformational space can greatly inflate Arrhenius parameters.
The first exponential of the rate expression comes from the familiar Arrhenius equation that represents the chemical energy of activation as Ea (Eq. 2):
| [2] |
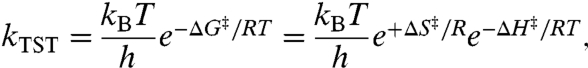
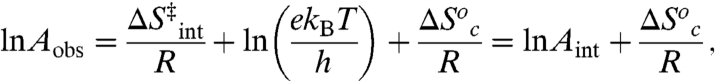
where R is the molar gas constant. This phenomenological equation appears frequently in the extensive literature on the temperature dependence of chemical reactions, with the value for Aint often related to transition state structure (24). It is useful to also express k in terms of transition state theory (TST), in order to relate Ea to ΔH‡ and Aint to ΔS‡:
 |
[3] |
where R is the molar gas constant, kB is Boltzmann’s constant, and h is Planck’s constant. We now consider the consequences of Eq. 1 for the thermodynamic activation parameters of the ht-ADH reaction, when either k, Eq. 2 or kTST, Eq. 3, is substituted for ki(T) in Eq. 1. The second exponential function that contributes to kobs will derive from fi and represent the free energy change for conformational reequilibration,  . The simplest case of a two-state equilibrium between active and inactive conformers, described first by Truhlar and Kohen (56) and developed further by Limbach et al. (17), is given by:
| [4] |
where Kin↔ac is the equilibrium constant for the conversion of an inactive to an active conformer.
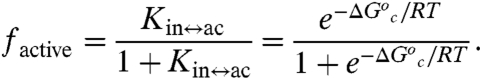
The fraction of enzyme in the active conformer (factive) is then given by Eq. 5:
 |
[5] |
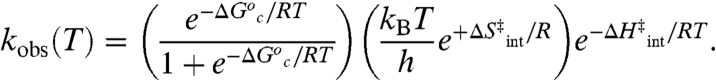
Multiplication of Eq. 5 by Eq. 3 gives the final observed rate as a function of temperature:
 |
[6] |
To model our data, we require that the distribution of inactive conformers increases significantly below the Arrhenius break, but becomes small and temperature-independent above the break. Under these circumstances, the first term of Eq. 6 goes to unity above the temperature break and reduces to  at low temperature. The latter regime results in the following expressions for Aobs and Ea(obs), where Ea = ΔH‡ + RT:
 |
[7] |
| [8] |
Here,  and
and  are the entropy and enthalpy of activation, respectively, intrinsic to the hydride transfer (i.e., above the breakpoint), whereas
  and
and  represent the thermodynamic parameters for conformational interconversion. In Table 4,
  and
and  were calculated using Eqs. 7 and 8. In this calculation we assume conformational sampling does not contribute significantly to the observed activation parameters above the Arrhenius break, so that
  and
and  are zero. Under these assumptions,
  , and
, and  , where the superscripts “Hi” and “Low” refer to the temperature regimes above and below the break, respectively. The nearly exact entropy–enthalpy compensation is attributed to the absence of a significant change in the absolute rate at the breakpoint. As has been pointed out previously, spurious relationships between ΔH‡ and ΔS‡ can arise when comparing datasets wherein there is little or no change in the absolute rate of reaction (57), as in the present case. Nevertheless, an intuitive physical interpretation of the observed compensation between
  and
and  at the breakpoint is that the enthalpy
  reflects the depth of the low energy well, and the large and positive
  reflects a transition from a rigid, conformationally restricted inactive state to a more flexible active state. In our model, the breakpoint represents the temperature at which the thermodynamically unfavorable
  is matched by the favorable
  .
.
Table 4.
Contributions of conformational sampling to activation parameters for ht-ADH variants below the temperature break
| Enzyme |
 , kcal/mol , kcal/mol |
 , kcal/mol , kcal/mol |
| Wild type | 6.7 (±0.3) | 6.8 (±0.3) |
| L176V | 8.9 (±0.4) | 9.0 (±0.4) |
| L176A | 10.5 (±0.3) | 10.6 (±0.3) |
| L176G | 11.7 (±0.6) | 11.7 (±0.6) |
| L176Δ | 22.0 (±1.1) | 21.9 (±1.2) |
| V260A | 18.7 (±1.5) | 18.8 (±1.4) |
 and
and  are the enthalpy and entropy associated with the conformational change converting the enzyme from an inactive to an active conformer.
Although we show here that a small number of states is sufficient to model the behavior of both wild-type and mutant enzymes below the break, we anticipate a much more complicated conformational landscape that depends on a large number of variables and is subject to a cooperative transition at the breakpoint (SI Text). Time-resolved fluorescence spectroscopy studies aimed at characterizing the nature of this transition are now underway. Independent of the precise physical origins of the change in conformational distribution, fi(T), above and below the temperature breakpoint, neither the wild-type nor mutant forms of ht-ADH below 30 °C indicate a significant change in static protein structure, implicating a dynamical origin for the enormously elevated Arrhenius prefactors.
A key feature of the ht-ADH is our ability to examine the impact of mutation over a large temperature range. We especially note that the mutations have little effect on activation parameters at elevated, physiologically optimal temperatures, only becoming deleterious at decreased temperatures that are below a dynamically important temperature breakpoint. This surprising sensitivity of the conformational landscape to changes in the size of a single active site hydrophobic side chain likely reflects a delicate evolutionary balance between protein flexibility and enzymatic efficiency (58), with the excessively rugged conformational landscape for the mutants at low temperature representing a condition that evolution has sought to avoid. The effects of conformational sampling on rate constants are sufficiently large to merit consideration in future studies of all classifications of enzymes, as well as in the development of synthetic protein catalysts.
Materials and Methods
Materials.
Benzyl alcohol was purchased from Fisher Scientific, and purified by vacuum fractional distillation prior to use. The α,α-d2-benzyl alcohol was purchased from CDN Isotopes, and used without further purification. Chemical purity and the extent of isotopic labeling of the alcohols were both determined to be greater than 99% by NMR and GC-MS. NAD+ was purchased as the protonated hydrate from Sigma and used without further purification.
Structural Modeling and in Silico Mutagenesis.
A model of the ternary complex of ht-ADH bound to cofactor and trifluroethanol (a substrate analog) was prepared using the X-ray structure of alcohol dehydrogenase from Pseudomonas aeruginosa [Protein Data Bank (PDB) ID code 1LLU] in complex with NAD+ and ethylene glycol (59) and the X-ray structure from ht-ADH (PDB ID code 1RJW) (20). A ternary complex of ht-ADH with trifluoroethanol and NAD+ bound was modeled into the closed, ternary complex structure of the pseudomonas enzyme using the program MODELLER (60) implemented in Python (61–63). A total of 50 models were generated for the wild-type ternary complex and each of the site-directed mutants. The models were subsequently subjected to an optimization using the variable target function method with the program automodel (62) and a maximum of 300 iterations. Models were then refined using molecular dynamics with simulated annealing. The relative energies of the models following optimization were assessed with the program DOPE (64) in the MODELLER environment, and the lowest energy models were examined visually to assess potential impacts of mutation on the enzyme structure. To predict the mutant structures, the residue of interest was replaced with the appropriate side chain in the PDB file and then modeled as above.
Size-Exclusion Chromatography.
Protein oligomerization was estimated for V260A at low temperature (4 °C), using a superdex 200 FPLC column in 50 mM sodium phosphate buffer at pH 7.0 and 150 mM NaCl. The column was calibrated with commercially available molecular weight standards (from 6,000 to 690,000 Da), at a flow rate of 0.25 mL/ min. The elution profile was monitored by UV absorption at 280 nm and Bradford protein assays.
Kinetic Assays.
Kinetic data were collected for the oxidation of benzyl alcohol (or its α,α-d2 isotopolog) to benzaldehyde with concomitant reduction of NAD+ to NADH, as previously described (13), and activation parameters and kinetic isotope effects were calculated as described previously (55). Cofactor concentrations as high as 100 mM did not lead to inhibition. Although high levels of benzyl alcohol showed some substrate inhibition at the lowest concentrations of NAD+, this was alleviated as the concentration of NAD+ was elevated. Fitting the data to include substrate inhibition yielded very similar estimates of kcat at all temperatures, but led to an error of fitting that was similar or larger. We have thus reported kinetic parameters obtained by fitting the data to bisubstrate Michaelis–Menten kinetics as previously described (13).
The enzyme pKa values were determined by measuring kcat for V260A as a function of pH at 10, 30, and 45 °C. Phosphate buffer (below pH 8) or pyrophosphate buffer (at and above pH 8.0) was adjusted to pH at the appropriate temperature for measurements. The final concentration of the buffer was 200 mM Pi (pH 7), 350 mM Pi (pH 6), 50 mM PPi (pH 9), and 60 mM PPi (pH 8). These levels of buffer at each indicated pH produced a constant ionic strength of 500 mM. No inhibition by Pi or PPi buffers was observed in this range. The resulting data could be fit to a single pKa according to Eq. 9:
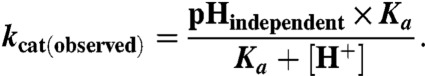 |
[9] |
In this equation, kcat (observed) is the maximal velocity at a given pH, kcat (pH independent) is the velocity for the fully ionized enzyme, and Ka is the acidity constant of the group that must be ionized for catalysis to occur.
Kinetic parameters were found to be insensitive to ionic strength (110–500 mM) at pH 7 and 30 °C. Because V260A showed a rapid loss of activity at high ionic strength and temperatures at or above 50 °C, the buffer was maintained at 50 mM KPi (μ = 110 mM) for detailed kinetic analyses of all the mutants as a function of temperatures; these are the conditions employed in the original studies of the wild-type enzyme (13). In the case of mutants where the Km for NAD+ is greatly elevated, this led to a small variation in ionic strength during the kinetic analyses of L176G, L176A, and V260A. The range in ionic strength and its upper limit were as follows: L176G: 110–160 mM; L176A: 110–160 mM; and V260A: 110–140 mM. Stock solutions of 200 mM NAD+ were prepared in 25 mM KPi and adjusted to pH 7.0; 100 mM stock solutions of benzyl alcohol were prepared in 50 mM KPi. Upon mixing of reagents, pH was found to remain at 7.0 up to the experimental limit of 60 mM NAD+.
CD.
Spectra were collected using an Aviv 410 spectropolarimeter in a quartz cuvette with a 1-mm path length and a protein concentration of 0.5 mg/mL, in 50 mM phosphate, pH 7.0. The temperature was controlled by a Peltier temperature controller. Data points were taken every 1 nm. The signal is reported in units of mean residue elipticity.
Supplementary Material
Acknowledgments.
This work was supported by grants from the National Institutes of Health (GM025765) and National Science Foundation (MCB0446395) to J.P.K. and National Institutes of Health (1R01HL084366) to B.J.B.
Footnotes
The authors declare no conflict of interest.
This article contains supporting information online at www.pnas.org/lookup/suppl/doi:10.1073/pnas.1104989108/-/DCSupplemental.
References
- 1.Benkovic SJ, Hammes G, Hammes-Schiffer S. Free-energy landscape of enzyme catalysis. Biochemistry. 2008;47:3317–3321. doi: 10.1021/bi800049z. [DOI] [PubMed] [Google Scholar]
- 2.Henzler-Wildman KA, et al. Intrinsic motions along an enzymatic reaction trajectory. Nature. 2007;450:838–844. doi: 10.1038/nature06410. [DOI] [PubMed] [Google Scholar]
- 3.Fraser JS, et al. Hidden alternative structures of proline isomerase essential for catalysis. Nature. 2009;462:669–673. doi: 10.1038/nature08615. [DOI] [PMC free article] [PubMed] [Google Scholar]
- 4.Baldwin AJ, Kay LE. NMR spectroscopy brings invisible protein states into focus. Nat Chem Biol. 2009;5:808–814. doi: 10.1038/nchembio.238. [DOI] [PubMed] [Google Scholar]
- 5.Schrank TP, Bolen DW, Hilser VJ. Rational modulation of conformational fluctuations in adenylate kinase reveals a local unfolding mechanism for allostery and functional adaptation in proteins. Proc Natl Acad Sci USA. 2009;106:16984–16989. doi: 10.1073/pnas.0906510106. [DOI] [PMC free article] [PubMed] [Google Scholar]
- 6.English BP, et al. Ever-fluctuating single enzyme molecules: Michaelis-Menten equation revisited. Nat Chem Biol. 2006;2:87–94. doi: 10.1038/nchembio759. [DOI] [PubMed] [Google Scholar]
- 7.Min W, Xie XS, Bagchi B. Two-dimensional reaction free energy surfaces of catalytic reaction: Effects of protein conformational dynamics on enzyme catalysis. J Phys Chem B. 2008;112:454–466. doi: 10.1021/jp076533c. [DOI] [PubMed] [Google Scholar]
- 8.Min W, Xie XS, Bagchi B. Role of conformational dynamics in kinetics of an enzymatic cycle in a nonequilibrium steady state. J Chem Phys. 2009;131:065104. doi: 10.1063/1.3207274. [DOI] [PubMed] [Google Scholar]
- 9.Antikainen NM, Smiley RD, Benkovic SJ, Hammes GG. Conformation coupled enzyme catalysis: Single-molecule and transient kinetics investigation of dihydrofolate reductase. Biochemistry. 2005;44:16835–16843. doi: 10.1021/bi051378i. [DOI] [PubMed] [Google Scholar]
- 10.Boehr DD, McElheny D, Dyson HJ, Wright PE. Millisecond timescale fluctuations in dihydrofolate reductase are exquisitely sensitive to the bound ligands. Proc Natl Acad Sci USA. 2010;107:1373–1378. doi: 10.1073/pnas.0914163107. [DOI] [PMC free article] [PubMed] [Google Scholar]
- 11.Arora K, Brooks Iii CL., 3rd Functionally important conformations of the Met20 loop in dihydrofolate reductase are populated by rapid thermal fluctuations. J Am Chem Soc. 2009;131:5642–5647. doi: 10.1021/ja9000135. [DOI] [PMC free article] [PubMed] [Google Scholar]
- 12.Henzler-Wildman KA, et al. A hierarchy of timescales in protein dynamics is linked to enzyme catalysis. Nature. 2007;450:913–916. doi: 10.1038/nature06407. [DOI] [PubMed] [Google Scholar]
- 13.Kohen A, Cannio R, Bartolucci S, Klinman JP. Enzyme dynamics and hydrogen tunneling in a thermophilic alcohol dehydrogenase. Nature. 1999;399:496–499. doi: 10.1038/20981. [DOI] [PubMed] [Google Scholar]
- 14.Liang Z-X, Lee T, Resing KA, Ahn NG, Klinman JP. Thermal-activated protein mobility and its correlation with catalysis in thermophilic alcohol dehydrogenase. Proc Natl Acad Sci USA. 2004;101:9556–9561. doi: 10.1073/pnas.0403337101. [DOI] [PMC free article] [PubMed] [Google Scholar]
- 15.Nagel ZD, Klinman JP. A 21st century revisionist's view at a turning point in enzymology. Nat Chem Biol. 2009;5:543–550. doi: 10.1038/nchembio.204. [DOI] [PubMed] [Google Scholar]
- 16.Klinman JP. An integrated model for enzyme catalysis emerges from studies of hydrogen tunneling. Chem Phys Lett. 2009;471:179–193. doi: 10.1016/j.cplett.2009.01.038. [DOI] [PMC free article] [PubMed] [Google Scholar]
- 17.Limbach HH, Lopez JM, Kohen A. Arrhenius curves of hydrogen transfers: Tunnel effects, isotope effects and effects of pre-equilibria. Philos Trans R Soc Lond B Biol Sci. 2006;361:1399–1415. doi: 10.1098/rstb.2006.1872. [DOI] [PMC free article] [PubMed] [Google Scholar]
- 18.Marcus RA. Beyond the historical perspective on hydrogen and electron transfers. In: Allemann RK, Scrutton NS, editors. Quantum Tunneling in Enzyme-Catalysed Reactions. Cambridge, UK: RSC Publishing; 2009. [Google Scholar]
- 19.Zhang XH, Bruice TC. Temperature-dependent structure of the E·S complex of Bacillus stearothermophilus alcohol dehydrogenase. Biochemistry. 2007;46:837–843. doi: 10.1021/bi062110+. [DOI] [PubMed] [Google Scholar]
- 20.Ceccarelli C, et al. Crystal structure and amide H/D exchange of binary complexes of alcohol dehydrogenase from Bacillus stearothermophilus: Insight into thermostability and cofactor binding. Biochemistry. 2004;43:5266–5277. doi: 10.1021/bi049736p. [DOI] [PubMed] [Google Scholar]
- 21.Holbrook KA, Pilling M, Robertson S. Unimolecular Reactions. 2nd Ed. Chichester, UK: John Wiley & Sons; 1996. [Google Scholar]
- 22.Trautz M. Law of the reaction rate and the equation in gases—Confirmation of the additivity of C-v-3/2 R—New determination of the intergration constants and the molecular diameter. Z Anorg Allg Chem. 1916;96:1–28. [Google Scholar]
- 23.Evans MG, Polanyi M. Some applications of the transition state method to the calculation of reaction velocities, especially in solution. Trans Faraday Soc. 1935;31:875–893. [Google Scholar]
- 24.Forst W. Theory of Unimolecular Reactions. New York: Academic; 1973. [Google Scholar]
- 25.Kohen A, Jonsson T, Klinman JP. Effects of protein glycosylation on catalysis: Changes in hydrogen tunneling and enthalpy of activation in the glucose oxidase reaction. Biochemistry. 1997;36:2603–2611. doi: 10.1021/bi962492r. [DOI] [PubMed] [Google Scholar]
- 26.Seymour SL, Klinman JP. Comparison of rates and kinetic isotope effects using PEG-modified variants and glycoforms of glucose oxidase: The relationship of modification of the protein envelope to C-H activation and tunneling. Biochemistry. 2002;41:8747–8758. doi: 10.1021/bi020054g. [DOI] [PubMed] [Google Scholar]
- 27.Tsai SC, Klinman JP. Probes of hydrogen tunneling with horse liver alcohol dehydrogenase at subzero temperatures. Biochemistry. 2001;40:2303–2311. doi: 10.1021/bi002075l. [DOI] [PubMed] [Google Scholar]
- 28.Wang L, Goodey NM, Benkovic SJ, Kohen A. Coordinated effects of distal mutations on environmentally coupled tunneling in dihydrofolate reductase. Proc Natl Acad Sci USA. 2006;103:15753–15758. doi: 10.1073/pnas.0606976103. [DOI] [PMC free article] [PubMed] [Google Scholar]
- 29.Meyer MP, Tomchick DR, Klinman JP. Enzyme structure and dynamics affect hydrogen tunneling: The impact of a remote side chain (1553) in soybean lipoxygenase-1. Proc Natl Acad Sci USA. 2008;105:1146–1151. doi: 10.1073/pnas.0710643105. and correction (2008) 105:19562. [DOI] [PMC free article] [PubMed] [Google Scholar]
- 30.Maglia G, Allemann RK. Evidence for environmentally coupled hydrogen tunneling during dihydrofolate reductase catalysis. J Am Chem Soc. 2003;125:13372–13373. doi: 10.1021/ja035692g. [DOI] [PubMed] [Google Scholar]
- 31.Kuznetsov AM, Ulstrup J. Proton and hydrogen atom tunnelling in hydrolytic and redox enzyme catalysis. Can J Chem. 1999;77:1085–1096. [Google Scholar]
- 32.Knapp MJ, Rickert K, Klinman JP. Temperature-dependent isotope effects in soybean lipoxygenase-1: Correlating hydrogen tunneling with protein dynamics. J Am Chem Soc. 2002;124:3865–3874. doi: 10.1021/ja012205t. [DOI] [PubMed] [Google Scholar]
- 33.Soudackov A, Hammes-Schiffer S. Derivation of rate expressions for nonadiabatic proton-coupled electron transfer reactions in solution. J Chem Phys. 2000;113:2385–2396. [Google Scholar]
- 34.Klinman JP. Linking protein structures and dynamics to catalysis: The role of hydrogen tunneling. Philos Trans R Soc Lond B Biol Sci. 2006;361:1323–1331. doi: 10.1098/rstb.2006.1870. [DOI] [PMC free article] [PubMed] [Google Scholar]
- 35.Nagel ZD, Klinman JP. Tunneling and dynamics in enzymatic hydride transfer. Chem Rev. 2006;106:3095–3118. doi: 10.1021/cr050301x. [DOI] [PubMed] [Google Scholar]
- 36.Pudney CR, Johannissen LO, Sutcliffe MJ, Hay S, Scrutton NS. Direct analysis of donor-acceptor distance and relationship to isotope effects and the force constant for barrier compression in enzymatic H-tunneling reactions. J Am Chem Soc. 2010;132:11329–11335. doi: 10.1021/ja1048048. [DOI] [PubMed] [Google Scholar]
- 37.Francisco WA, Knapp MJ, Blackburn NJ, Klinman JP. Hydrogen tunneling in peptidylglycine alpha-hydroxylating monooxygenase. J Am Chem Soc. 2002;124:8194–8195. doi: 10.1021/ja025758s. [DOI] [PubMed] [Google Scholar]
- 38.Basran J, Sutcliffe MJ, Scrutton NS. Enzymatic H-transfer requires vibration-driven extreme tunneling. Biochemistry. 1999;38:3218–3222. doi: 10.1021/bi982719d. [DOI] [PubMed] [Google Scholar]
- 39.Basran J, Sutcliffe MJ, Scrutton NS. Deuterium isotope effects during carbon-hydrogen bond cleavage by trimethylamine dehydrogenase—Implications for mechanism and vibrationally assisted hydrogen tunneling in wild-type and mutant enzymes. J Biol Chem. 2001;276:24581–24587. doi: 10.1074/jbc.M101178200. [DOI] [PubMed] [Google Scholar]
- 40.Abad JL, Camps F, Fabrias G. Is hydrogen tunneling involved in acylCoA desaturase reactions? The case of a Delta(9) desaturase that transforms (E)-11-tetradecenoic acid into (Z,E)-9,11-tetradecadienoic acid. Angew Chem Int Ed Engl. 2000;39:3279–3281. doi: 10.1002/1521-3773(20000915)39:18<3279::aid-anie3279>3.0.co;2-g. [DOI] [PubMed] [Google Scholar]
- 41.Klinman JP. Beyond tunneling corrections: Full tunneling modes for enzymatic C-H activation reactions. In: Alemann R, Scrutton N, editors. RS-Quantum Tunneling in Enzyme-Catalysed Reactions. Cambridge, UK: RSC Publishing; 2009. [Google Scholar]
- 42.Klinman JP. A new model for the origin of kinetic hydrogen isotope effects. J Phys Org Chem. 2010;23:606–612. [Google Scholar]
- 43.Heyes DJ, Sakuma M, de Visser SP, Scrutton NS. Nuclear quantum tunneling in the light-activated enzyme photochlorophyllide oxidoreductase. J Biol Chem. 2009;284:3762–3767. doi: 10.1074/jbc.M808548200. [DOI] [PubMed] [Google Scholar]
- 44.Schaleger LL, Long FA. Entropies of activation and mechanisms of reactions in solution. In: Gold V, editor. Advances in Physical Organic Chemistry. New York: Academic; 1963. pp. 1–31. [Google Scholar]
- 45.Bell RP. The Tunneling Effect in Chemistry. New York: Chapman & Hall; 1980. [Google Scholar]
- 46.Marcus RA, Sutin N. Electron transfers in chemistry and biology. Biochim Biophys Acta. 1985;811:265–322. [Google Scholar]
- 47.Wiedenfeld D, et al. Temperature and isotope effects on the rates of photoinduced iridium(I)-pyridinium electron-transfer reactions. J Phys Chem B. 1997;101:8823–8826. [Google Scholar]
- 48.Kuciauskas D, et al. Photoinduced electron transfer in carotenoporphyrin-fullerene triads: Temperature and solvent effects. J Phys Chem B. 2000;104:4307–4321. [Google Scholar]
- 49.Lemmetyinen H, Tkachenko NV, Efimov A, Niemi M. Temperature independent ultrafast photoinduced charge transfer in donor-acceptor pairs forming exciplexes. J Phys Chem C. 2009;113:11475–11483. [Google Scholar]
- 50.Lancaster K, et al. Intramolecular electron-transfer rates in mixed-valence triarylamines: Measurement by variable-temperature ESR spectroscopy and comparison with optical data. J Am Chem Soc. 2009;131:1717–1723. doi: 10.1021/ja808465c. [DOI] [PubMed] [Google Scholar]
- 51.Liu M, et al. Solvent friction effect on intramolecular electron transfer. J Am Chem Soc. 2005;127:17867–17876. doi: 10.1021/ja055596a. [DOI] [PubMed] [Google Scholar]
- 52.Marcus RA. Interaction between experiments. analytical theories, and computation. J Phys Chem C. 2009;113:14598–14608. [Google Scholar]
- 53.Doremus RH. Viscosity of silica. J Appl Phys. 2002;92:7619–7629. [Google Scholar]
- 54.Fichthorn KA, Miron RA. Thermal desorption of large molecules from solid surfaces. Phys Rev Lett. 2002;89:196103. doi: 10.1103/PhysRevLett.89.196103. [DOI] [PubMed] [Google Scholar]
- 55.Liang Z-X, Tsigos I, Bouriotis V, Klinman JP. Impact of protein flexibility on hydride-transfer parameters in thermophilic and psychrophilic alcohol dehydrogenases. J Am Chem Soc. 2004;126:9500–9501. doi: 10.1021/ja047087z. [DOI] [PubMed] [Google Scholar]
- 56.Truhlar DG, Kohen A. Convex Arrhenius plots and their interpretation. Proc Natl Acad Sci USA. 2001;98:848–851. doi: 10.1073/pnas.98.3.848. [DOI] [PMC free article] [PubMed] [Google Scholar]
- 57.Sharp K. Entropy-enthalpy compensation: Fact or artifact? Protein Sci. 2001;10:661–667. doi: 10.1110/ps.37801. [DOI] [PMC free article] [PubMed] [Google Scholar]
- 58.Somero GN. Temperature adaptation of enzymes—Biological optimization through structure-function compromises. Annu Rev Ecol Syst. 1978;9:1–29. [Google Scholar]
- 59.Levin I, Meiri G, Peretz M, Burstein Y, Frolow F. The ternary complex of Pseudomonas aeruginosa alcohol dehydrogenase with NADH and ethylene glycol. Protein Sci. 2004;13:1547–1556. doi: 10.1110/ps.03531404. [DOI] [PMC free article] [PubMed] [Google Scholar]
- 60.Eswar N, et al. Comparative protein structure modeling using MODELLER. In: Baxevanis AD, Petsko GA, Stein LD, Stormo GD, editors. Current Protocols in Bioinformatics. New York: John Wiley & Sons, Inc; 2009. [Google Scholar]
- 61.Sanner MF. Python: A programming language for software integration and development. J Mol Graph Model. 1999;17:57–61. [PubMed] [Google Scholar]
- 62.Sali A, Blundell TL. Comparative protein modelling by satisfaction of spatial restraints. J Mol Biol. 1993;234:779–815. doi: 10.1006/jmbi.1993.1626. [DOI] [PubMed] [Google Scholar]
- 63.Madhusudhan MS, Marti-Renom MA, Sanchez R, Sali A. Variable gap penalty for protein sequence-structure alignment. Protein Eng Des Sel. 2006;19:129–133. doi: 10.1093/protein/gzj005. [DOI] [PubMed] [Google Scholar]
- 64.Shen MY, Sali A. Statistical potential for assessment and prediction of protein structures. Protein Sci. 2006;15:2507–2524. doi: 10.1110/ps.062416606. [DOI] [PMC free article] [PubMed] [Google Scholar]
Associated Data
This section collects any data citations, data availability statements, or supplementary materials included in this article.