

The physiological function of Opa1, a dynamin-related GTPase required for mitochondrial fusion, is described in glucose-stimulated ATP production in pancreatic beta cells.
Abstract
Previous studies using in vitro cell culture systems have shown the role of the dynamin-related GTPase Opa1 in apoptosis prevention and mitochondrial DNA (mtDNA) maintenance. However, it remains to be tested whether these functions of Opa1 are physiologically important in vivo in mammals. Here, using the Cre-loxP system, we deleted mouse Opa1 in pancreatic beta cells, in which glucose-stimulated ATP production in mitochondria plays a key role in insulin secretion. Beta cells lacking Opa1 maintained normal copy numbers of mtDNA; however, the amount and activity of electron transport chain complex IV were significantly decreased, leading to impaired glucose-stimulated ATP production and insulin secretion. In addition, in Opa1-null beta cells, cell proliferation was impaired, whereas apoptosis was not promoted. Consequently, mice lacking Opa1 in beta cells develop hyperglycemia. The data suggest that the function of Opa1 in the maintenance of the electron transport chain is physiologically relevant in beta cells.
INTRODUCTION
Mitochondria are highly dynamic organelles that continuously undergo fusion and division in many cell types (Rube and van der Bliek, 2004; Okamoto and Shaw, 2005; Chan, 2006; Cerveny et al., 2007; Hoppins et al., 2007; Westermann, 2008; Molina et al., 2009; Soubannier and McBride, 2009; Scott and Youle, 2010). A balance between mitochondrial fusion and division is critical for maintaining normal mitochondrial structure. Mitochondrial dynamics is regulated by at least three dynamin-related GTPases, including Opa1, mitofusin, and Drp1. Whereas Opa1 and mitofusin mediate mitochondrial fusion, Drp1 regulates division. Highlighting the importance of mitochondrial fusion and division in human health, defects in these dynamin-related proteins cause human diseases such as dominant optic atrophy for Opa1, Charcot-Marie-Tooth disease type 2A for mitofusin 2, and a developmental defect for Drp1 (Benard and Karbowski, 2009).
Mammalian Opa1 has been studied in in vitro cell culture systems and suggested to play roles in a variety of processes, including apoptosis prevention and mitochondrial DNA (mtDNA) maintenance. Opa1 is associated with the inner membrane in the intermembrane space of mitochondria (Olichon et al., 2003; Griparic et al., 2004). It has been suggested that homotypic interactions between a yeast homologue of Opa1, Mgm1p, on opposite membranes mediate mitochondrial fusion (Meeusen et al., 2006). Although Opa1 is located in the inner membrane, Opa1 also regulates fusion of the outer membrane, probably through interactions with the outer membrane proteins, mitofusins (Sesaki et al., 2003; Cipolat et al., 2004). Reduced mitochondrial fusion decreases oxidative phosphorylation (Chen et al., 2005, 2010). Although the underlying mechanisms are largely unknown, the loss of mtDNA is proposed as a possible reason (Chen et al., 2010). In addition to mitochondrial fusion, Opa1 also controls the structure of inner membrane cristae and thereby the release of cytochrome c during apoptosis (Olichon et al., 2003; Griparic et al., 2004; Frezza et al., 2006; Meeusen et al., 2006). However, studies focusing on the role of Opa1 in mammalian tissues have been limited, as homozygous mutations of Opa1 lead to embryonic lethality in mice, and mice carrying its heterozygous mutations show normal phenotypes except for the degeneration of optic nerves in old animals (Supplemental Figure S1) (Alavi et al., 2007; Davies et al., 2007). Therefore the physiological roles of Opa1 are virtually unknown in most tissues.
In this study, to investigate the physiological role of Opa1 in mammals, we generated a conditional allele using the Cre-loxP system. We focused pancreatic beta cells since mitochondrial oxidative phosphorylation plays key roles in glucose homeostasis in this cell type (Wallace, 1999; Maechler and Wollheim, 2001; Lamson and Plaza, 2002; Rolo and Palmeira, 2006; Wikstrom et al., 2007). When glucose enters beta cells, it is metabolized through glycolysis and mitochondrial oxidative phosphorylation to produce ATP (MacDonald et al., 2005; Maechler and de Andrade, 2006; Fujimoto et al., 2007). Rising ATP levels cause closure of ATP-sensitive potassium channels and depolarization of the plasma membrane, leading to the opening of voltage-gated calcium channels and induction of insulin granule exocytosis. During ATP production, electron transport chain (ETC) complexes also generate reactive oxygen species (ROS) (Wallace and Fan, 2009). Although ROS function as signaling molecules, excess ROS can cause apoptosis in beta cells and are suggested to contribute to the pathogenesis of type 2 diabetes. Therefore it is critical to control the functional competence of mitochondria to protect against diabetes. Here, using a new mouse model, we show that mice lacking Opa1 in beta cells develop hyperglycemia due to defects in ETC complex IV without losing mtDNA.
RESULTS
Aberrant mitochondrial structure in Opa1-deficient beta cells
Opa1 is encoded by a single gene that undergoes alternative splicing and partial proteolytic processing. To identify Opa1 isoforms expressed in pancreatic beta cells, we took advantage of the five known Opa1 isoforms expressed in mouse embryonic fibroblasts (MEFs): L1, L2, S3, S4, and S5 (Figure 1A) (Merkwirth et al., 2008; Song et al., 2009). L1 and L2 are uncleaved forms, whereas S3–S5 are proteolytic products of the long (L) forms. Both the uncleaved and cleaved forms are necessary for Opa1 function. We found that these five Opa1 isoforms are also expressed in islets, in which beta cells are predominant (Figure 1A). Of interest, the relative expression level of each isoform was different between the two cell types: whereas L2 is the major form in MEFs, S5 is dominant in beta cells.
FIGURE 1:

Loss of Opa1 results in fragmentation of mitochondria and alternation of cristae structure in pancreatic beta cells. (A) Wild-type MEFs and control islets were analyzed by immunoblotting using Opa1 antibodies. MEFs have been shown to mainly express five Opa1 isoforms (L1, L2, S3, S4, and S5) (Song et al., 2007; Merkwirth et al., 2008). Islets also expressed these five isoforms with different expression levels. Whereas isoform L2 demonstrated the highest levels in MEFs, S5 isoform was dominant in islets. (B) Islets isolated from control and RIP2-Opa1KO (KO) mice were subjected to immunoblotting using antibodies to Opa1. Tim23, a mitochondrial inner membrane protein, was used as a control. (C) EM analysis of control and RIP2-Opa1KO beta cells. Low-magnification images (top) and high-magnification images (bottom) are shown. Arrows indicate cristae junctions in insets. (D) Distribution of mitochondrial length (n = 3; a total of 671 mitochondria for control and 1704 for RIP2-Opa1KO). (E) We measured width of cristae junction, which connects the intermembrane space with the intracristal space, using ImageJ software (National Institutes of Health, Bethesda, MD) (n = 3; a total of 213 cristae for control and 709 for RIP2-Opa1KO). (F) Volume densities of mitochondria were determined using a point-counting method (n = 11).
To delete Opa1 in pancreatic beta cells, we introduced loxP sites into the Opa1 gene (Supplemental Figure S1) and crossed Opa1flox/flox mice with Opa1+/− mouse strains expressing Cre recombinase under the control of the rat insulin promoter (RIP2-Cre Opa1+/−). RIP2-Cre is dominantly expressed in beta cells and has been used in many studies (Postic et al., 1999). Levels of all the five isoforms of Opa1 decreased by ∼90% in islets isolated from RIP2-Opa1 knockout (KO) mice compared with those from littermate control mice (Figure 1B). These results demonstrate that most beta cells in RIP2-Opa1KO mice are Opa1 null.
Electron microscopy revealed that mitochondria in Opa1-deficient beta cells are highly fragmented compared with the short tubules observed in littermate control mice (Figure 1C). Quantitative analysis showed that mitochondria became shorter in Opa1KO beta cells (Figure 1D). In addition, cristae were found to be wider in RIP2-Opa1KO mitochondria than in control mitochondria (Figure 1C, bottom). The width of the cristae junction increased by ∼40% in RIP2-Opa1KO mice (Figure 1E). In contrast, volume densities of mitochondria were unaffected in RIP2-Opa1KO mice (Figure 1F). Our data indicate that Opa1 is required for the morphology of mitochondria in beta cells. Consistent with our findings, a previous study has shown that reduced levels of Opa1 block mitochondrial fusion in insulin-secreting INS1 cells (Twig et al., 2009).
RIP2-Cre is also known to express in the hypothalamus, which regulates food intake and body weight. We observed similar body weight, adiposity, lean content, food intake, and locomotion in control (RIP2-Cre Opa1flox/+) and RIP2-Opa1KO mice (RIP2-Cre Opa1flox/−) at 8–12 wk (Supplemental Figure S2). To minimize possible hypothalamic effects, we used 8- to 12-wk-old animals in all experiments except in analysis of newborn mice.
RIP2-Opa1KO mice are glucose intolerant
Next we determined whether loss of Opa1 in beta cells affects glucose homeostasis. RIP2-Opa1KO mice showed significantly higher blood glucose levels than littermate control mice under both fasted and random-fed conditions (Figure 2A). To further characterize glucose homeostasis, we examined the ability of RIP2-Opa1KO and control mice to dispose of a glucose load, using a glucose tolerance test. Mice were fasted for 14 h and then subjected to intraperitoneal injection of glucose. We measured blood glucose levels at different time points after injection (Figure 2B). RIP2-Opa1KO mice had higher blood glucose levels that took longer to return to normal levels compared with those in littermate control mice. These results indicate that RIP2-Opa1KO mice are intolerant to glucose.
FIGURE 2:

RIP2-Opa1KO mice show hyperglycemia and impaired insulin responses. (A) Blood glucose levels were measured in mice that were fasted for 14–16 h or randomly fed using a glucose meter (n ≥ 12). (B) Glucose tolerance test. Mice were fasted for 14–16 h and subjected to intraperitoneal injection of glucose (1.5 mg/g body weight). Blood glucose levels were measured at the indicated times (n ≥ 11). (C) Insulin tolerance test. After fasting for 14–16 h, mice were subjected to intraperitoneal injection of insulin (0.5 U/kg body weight). Blood glucose concentrations were determined at different time points (n ≥ 11). (D) Blood insulin levels after intraperitoneal glucose injection. Mice between 8 and 12 wk of age were fasted for 14–16 h and subjected to intraperitoneal injection of glucose (1.5 mg/g body weight). Blood insulin concentrations were determined at the indicated time points (n = 15).
Glucose intolerance could result from defects in beta cells (e.g., compromised insulin secretion) and defects in insulin-responsive peripheral tissues (e.g., insulin resistance in skeletal muscle, liver, and adipocytes). Because we disrupted Opa1 in beta cells, we predicted that peripheral tissues would take up glucose normally after insulin stimulation in RIP2-Opa1KO mice. We confirmed this prediction using an insulin tolerance test. We measured blood glucose levels after intraperitoneal injection of insulin and found that RIP2-Opa1KO and control mice similarly respond to insulin and decreased glucose levels with indistinguishable kinetics (Figure 2C).
Because beta cells control glucose homeostasis by secreting insulin, we examined insulin response in RIP2-Opa1KO mice. We injected glucose intraperitoneally and measured the blood insulin levels at different time points. Littermate control mice showed increased blood insulin levels after glucose injection (Figure 2D). In contrast, RIP2-Opa1KO mice demonstrated virtually no increase in blood insulin levels (Figure 2D). We noticed that the relative insulin levels were slightly decreased following glucose injection in RIP2-Opa1KO mice, and this decrease may be due to insulin uptake by peripheral tissues after glucose injection. Because glucose levels slowly went back to the basal level in glucose tolerance tests in RIP2-Opa1KO mice (Figure 2B), we suspect that RIP2-Opa1KO mice can still slowly secrete insulin in response to glucose. Consistent with this idea, steady-state levels of blood insulin were decreased in RIP2-Opa1KO mice but not significantly different from control mice (control, 0.1 ± 0.09 ng/ml; and RIP2-Opa1KO, 0.087 ± 0.01 ng/ml; n ≥ 13).
Impaired cell proliferation in Opa1-deficient beta cells
To understand the reason for the altered insulin responses in RIP2-Opa1KO mice, we determined whether Opa1 loss in beta cells affects islet size. We performed immunohistochemisty on pancreas sections with insulin antibodies for beta cells and glucagon antibodies for alpha cells at 8–12 wk. Beta cell islet size (insulin-positive area) was decreased in RIP2-Opa1KO mice compared with littermate controls (Figure 3, A and B). In addition, the density of the islets was also decreased by ∼60% in adult RIP2-Opa1KO mice (Figure 3C).
FIGURE 3:

Opa1 deficiency causes reduced islet size. (A) Immunofluorescence of pancreas sections prepared from adult mice (8–12 wk old) using antibodies to insulin for beta cells (red) and glucagon for alpha cells (green). (B) Distribution of beta cell islet size in adult. Insulin-positive area was determined using ImageJ software (n = 3). (C) The number of islets in pancreas sections was determined to calculate their density (n = 3).
The reduction in islet size in RIP2-Opa1KO mice may result from decreased cell proliferation and/or increased apoptosis. We first examined cell proliferation in adult (8–12 wk) and newborn mice (1 wk) using immunofluorescence with antibodies against Ki67, a marker for cell proliferation. When we examined adult pancreas specimens, indistinguishable staining patters for the proliferation markers were observed in littermate control and RIP2-Opa1KO mice (Figure 4, A and B). In contrast, when we examined samples from newborn mice, we found that the number of Ki67-positive beta cells decreased by ∼60% in RIP2-Opa1KO mice (Figure 4, A and B). Consistent with these results, the average area of the beta cell islets (Figure 4C) and the beta cell–to–alpha cell ratio (Figure 4D) were reduced in adult RIP2-Opa1KO mice but not in newborn mice. Our data indicate that postnatal proliferation of beta cells is compromised in RIP2-Opa1KO mice and suggest that the altered insulin response in RIP2-Opa1KO mice at least partially resulted from reduced islet mass.
FIGURE 4:

Beta cell proliferation is defective in RIP2-Opa1KO mice. (A) Immunofluorescence of pancreas sections using antibodies to Ki67 for cell proliferation (green) and insulin for beta cells (red) in newborns (1 wk old) and adults (8–12 wk old). (B) The percentage of beta cells showing Ki67 signals was determined (n ≥ 3). (C) Insulin-positive islet area in newborn and adult mice was measured (n = 3). (D) Ratio of beta cell area to alpha cell area was calculated (n = 3). (E) Sections of pancreas were subjected to TUNEL analysis using the In Situ Cell Death Detection Kit (Roche Applied Science, Indianapolis, IN). TUNEL signals (green) and immunostaining using anti-insulin antibodies are shown (red). As a positive control, sections were incubated with DNase I according to the manufacturer's instructions. (F) Quantification of islets that contain TUNEL-positive beta cells. Average ± SEM is shown (n = 3). Numbers in parentheses indicate the total number of islets examined. (G) Immunoblotting of islets using antibodies to PARP, caspase-3, and actin.
Second, terminal deoxynucleotidyl transferase–mediated dUTP nick end labeling (TUNEL)–positive staining was rarely observed in RIP2-Opa1KO and littermate control mice at all ages examined (Figure 4, E and F). Consistent with these results, neither activated form of caspase-3 (17 and 19 kDa) nor a cleaved form of PARP (89 kDa) was exhibited by RIP2-Opa1KO islets (Figure 4G). Given that Opa1 has been shown to function as an antiapoptotic factor (Olichon et al., 2003; Griparic et al., 2004), it was surprising that we did not observe increased apoptosis in Opa1-deficient beta cells. It is possible that Opa1 has different roles in apoptosis in different cell types. Consistent with our findings, a previous study showed that loss of Opa1 function did not increase apoptosis in vivo in Caenorhabditis elegans (Kanazawa et al., 2008).
Opa1 facilitates normal glucose-stimulated ATP production in beta cells
To further investigate the mechanisms underlying the altered insulin responses in RIP2-Opa1KO mice, we isolated islets and determined their insulin content and ability to secrete insulin in response to glucose. We found that islets isolated from RIP2-Opa1KO mice contained reduced amounts of insulin (∼30% of control islets) (Figure 5A). Then, we examined insulin secretion by normalizing secreted insulin levels relative to total insulin levels. Whereas RIP2-Opa1KO and control islets secreted similar percentages of insulin at nonstimulatory glucose levels (3 mM), RIP2-Opa1KO islets showed decreased insulin secretion at stimulatory glucose levels (11 mM) (Figure 5B). Further supporting this notion, glucose-stimulated calcium influx, which is a downstream event of mitochondrial ATP production, was greatly reduced at 11 mM glucose, but not 3 mM glucose, in RIP2-Opa1KO islets (Figure 5C). These data suggest that both reduced insulin contents and impaired glucose-stimulated insulin secretion also contribute to defects in insulin responses in RIP2-Opa1KO mice.
FIGURE 5:
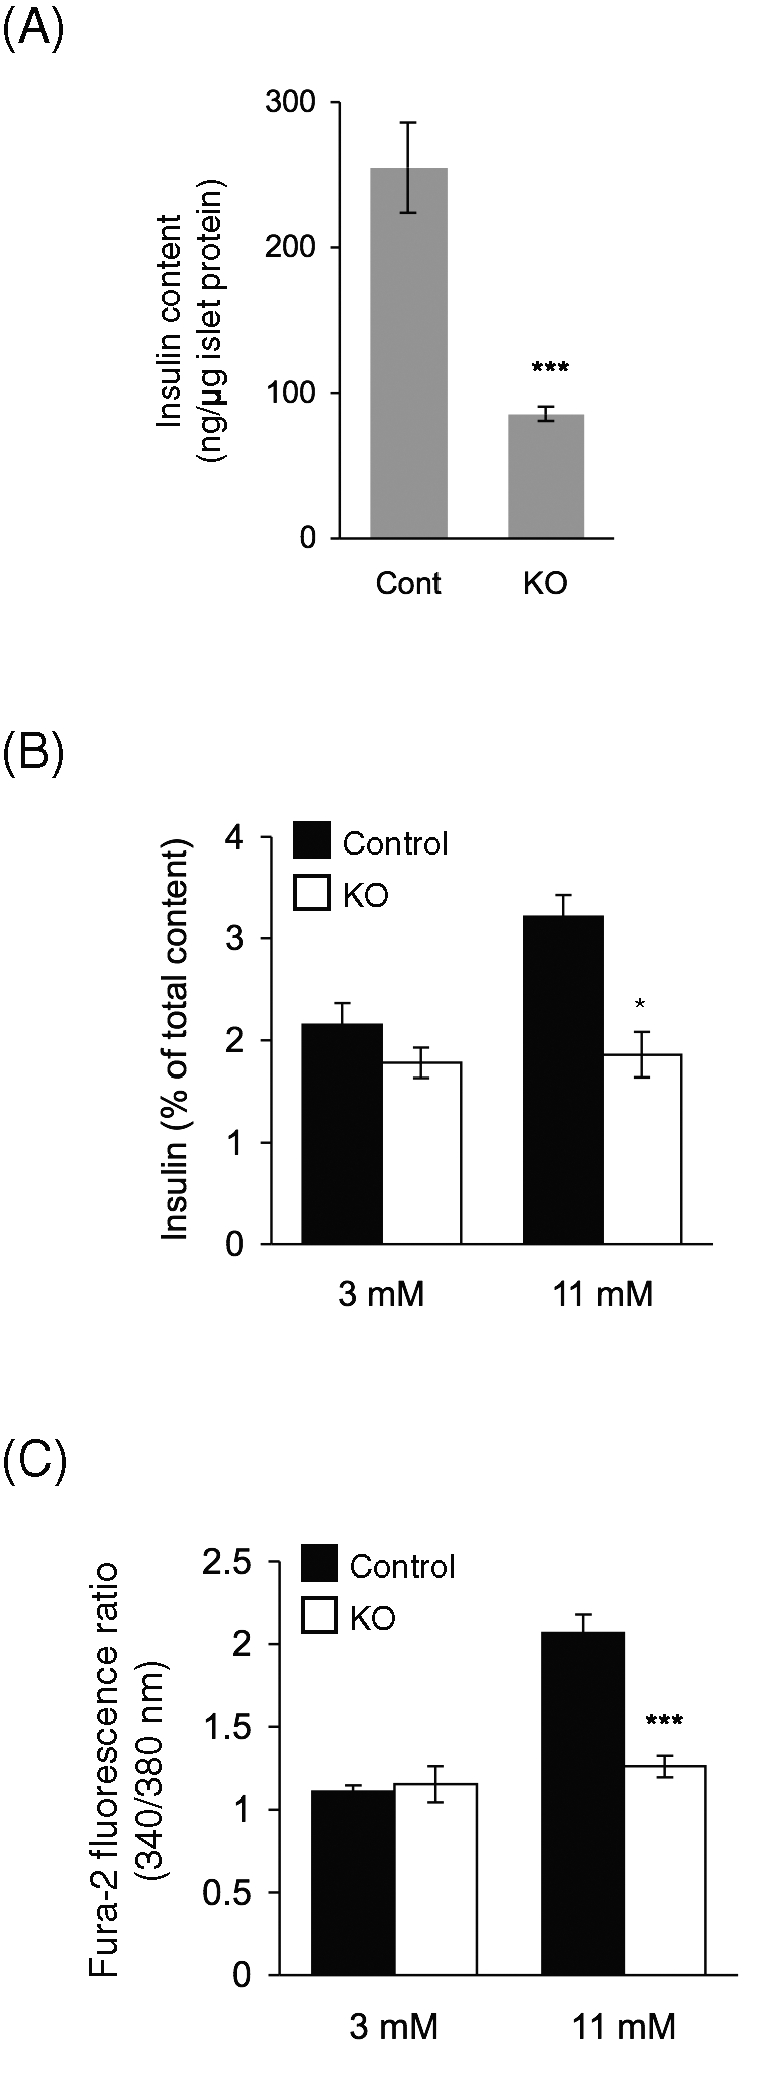
Deletion of Opa1 causes impaired insulin secretion in mice and in isolated islets. (A) Insulin contents in isolated islets were determined and normalized to total protein amounts (n = 3). (B) Insulin secretion from isolated islets. Isolated islets were incubated with 3 and 11 mM glucose for 1 h. Secreted insulin levels were determined and normalized to total insulin contents (n = 3). (C) Isolated islets were stained with 2 μM Fura 2-AM and stimulated with 3 and 11 mM glucose (n > 4). The 340 nm/380 nm fluorescence ratio was measured under a fluorescence microscope at 8 min after stimulation.
Because glucose-stimulated ATP production by mitochondria stimulates insulin secretion in beta cells, we isolated islets and measured ATP content. ATP levels were normalized to protein levels to exclude the effect of islet size. At nonstimulatory glucose levels (3 mM), control and RIP2-Opa1KO islets showed indistinguishable levels of ATP (Figure 6A), indicating that loss of Opa1 does not cause gross changes in intracellular ATP levels. When incubated at stimulatory glucose levels (11 mM), control islets increased ATP levels by approximately fivefold. However, glucose-stimulated ATP production was significantly compromised in Opa1-deficient beta cells (Figure 6A). Further supporting defects in mitochondrial oxidative phosphorylation, RIP2-Opa1KO islets were impaired in oxygen consumption rates in response to glucose. In control islets, oxygen consumption rates were increased upon addition of glucose and decreased to low levels by oligomycin, an inhibitor of ETC complex V. However, glucose-stimulated oxygen consumption rates were significantly lower in RIP2-Opa1KO islets (Figure 6B).
FIGURE 6:

RIP2-Opa1KO islets are defective in normal glucose-stimulated ATP production. (A) Glucose-stimulated ATP production. Isolated islets were incubated with the indicated concentrations of glucose for 5 min. Total ATP amounts were measured and normalized to protein amounts (n = 3). (B) The oxygen consumption rate (OCR) was measured in isolated isolates (n = 3). Glucose and oligomycin were added at the time indicated by the arrow and arrowhead, respectively.
Opa1 is required for the maintenance of complex IV
The presence of defects in glucose-stimulated ATP production in RIP2-Opa1 KO islets prompted us to analyze the levels of subunits of ETC complexes (complexes I–V). We found that the subunits of complex IV (subunits I, IV, and Vb) were significantly decreased in RIP2-Opa1 KO islets (Figure 7A). In addition, levels of NDUFB8 (a subunit of complex I) were also decreased, albeit to a lesser extent. In contrast, subunits of complexes II, III, and V and cytochrome c remained unaffected in RIP2-Opa1 KO islets (Figure 7A). Consistent with decreased complex IV levels, activity was also decreased in RIP2-Opa1KO islets (Figure 7B). However, complex I activity remained intact in RIP2-Opa1 KO mice (Figure 7B). These data indicate that Opa1 loss leads to a reduction in the amount and activity of complex IV.
FIGURE 7:

RIP2-Opa1KO islets contain decreased complex IV level. (A) Isolated islets were subjected to immunoblotting using antibodies against ETC complexes (NDUFB8 for complex I, FeS for complex II, Core2 for complex III, subunits I, IV, and Vb for complex IV, α subunit for complex V, and cytochrome c). Antibodies against Tim23 and actin were used as controls. Band intensity was quantitated and normalized to control samples (n = 3). (B) Activities of complexes I and IV in RIP2-Opa1KO islets were normalized to those in controls (n = 3). (C) mtDNA copy number relative to nuclear genome in isolated islets was determined using quantitative PCR. (D) Southern blotting was performed for mtDNA and nuclear DNA (nDNA). DNA was extracted from control (C) and RIP2-Opa1KO (K) islets. The expected sizes of mtDNA and nDNA are 16.3 and 6.3 kbp, respectively. (E) Isolated islets were solubilized with digitonin and analyzed by density gradient centrifugation, followed by immunoblotting using the indicated antibodies. Migration patterns of ETC components are shown (n = 3). Molecular weights are shown in kilodaltons.
To test whether the decreased amounts of complexes I and IV resulted from a reduction in mtDNA, we measured its copy number using quantitative PCR. We found that control and Opa1-deficient beta cells contain ∼200 copies of mtDNA per nuclear genome (Figure 7C). Consistent with this result, Southern blot analyses also showed similar amounts of mtDNA in control and RIP2-Opa1KO islets (Figure 7D). In addition, although the amounts decreased, subunits of complexes I and IV were assembled normally. We solubilized isolated islets using a mild detergent—digitonin—and analyzed the size of each ETC complex using glycerol density gradient centrifugation. The sizes of complexes IV and I were similar in control and RIP2-Opa1KO islets (Figure 7E). Similarly, the other complexes (i.e., II, III, and V) were also normally assembled in RIP2-Opa1 KO islets (Figure 7E).
DISCUSSION
The dynamin-related GTPase Opa1 controls mitochondrial fusion and inner membrane cristae structure. In this study, we showed that Opa1 deficiency in pancreatic beta cells causes defects in glucose-stimulated ATP production. We also found that Opa1 is important for maintenance of ETC complex IV in beta cells. In the absence of Opa1, complex IV levels were decreased, and consequently its activity was reduced in RIP2-Opa1KO islets. Decreased complex IV activity accounts for defects in glucose-stimulated ATP production, oxygen consumption, calcium dynamics, and insulin secretion. Because the basal levels of ATP remained unaltered in the absence of Opa1, the reduced complex IV levels are apparently sufficient to support basal ATP levels, but the extra “load” of secretion in response to higher glucose concentrations likely overtaxes the Opa1-null mitochondria. Therefore we suggest that the effect of mitochondrial morphology on glucose-stimulated ATP production is mediated by the mitochondria's inability to meet the increased demand of secretion due to decreased level and activity of complex IV. Consistent with our findings, a previous study showed that knockdown of Opa1 in cultured cells causes a reduction in oxygen consumption (Chen et al., 2005).
In addition to pancreatic beta cells, RIP2-Cre is also known to express in the hypothalamus. We measured animal behaviors and physiology because we sought to assess the effect of Opa1 deletion on the hypothalamus, which controls food intake and therefore fat content in the body. We observed no differences in food intake, fat content, and locomotive activity between control and RIP2-Opa1KO mice. Therefore the effect of Opa1 deficiency on the hypothalamus is negligible. The data also suggest that reduced insulin secretion and hyperglycemia did not affect general animal physiology in RIP2-Opa1KO mice.
It would be interesting to speculate whether the inability to respond to high glucose and reduction in beta cell mass occur in parallel during the lifespan of RIP2-Opa1KO mice. We found that young RIP2-Opa1KO mice have a normal beta cell mass but exhibit significantly higher blood glucose levels (control, 130 ± 3 mg/dl; and RIP2-Opa1KO, 173 ± 10 mg/dl; n ≥ 27), suggesting that the stimulus–secretion coupling defect may arise first. During postnatal growth, beta cell mass did not increase due to defects in cell proliferation, further contributing to hyperglycemia in adult RIP2-Opa1KO mice.
How the loss of Opa1 affects complexes IV and I remains to be determined. One possible hypothesis is that a reduction in complexes IV and I may result from reduced levels of mtDNA. Because mtDNA encodes 13 subunits of ETC complexes (7 subunits of complex I, 1 subunit of complex III, 3 subunits of complex IV, and 2 subunits of complex V), decreases in its copy number could lower ETC complex levels. Consistent with this idea, the loss of mitofusins, which are required for mitochondrial outer membrane fusion, has been shown to cause a decrease of mtDNA levels and impaired respiration in skeletal muscle (Chen et al., 2010). However, we found similar copy numbers of mtDNA in control and Opa1-deficient beta cells. In addition, levels of other complexes, such as complexes III and V, which contain subunits encoded by mtDNA, were unaffected in RIP2-Opa1KO islets. Furthermore, subunits IV and Vb of complex IV, which are encoded by nuclear DNA, also decreased. Therefore it is unlikely that the reduced levels of complexes IV and I simply result from decreased mtDNA levels.
Second, fragmentation of mitochondria due to fusion defects may produce an uneven distribution of mtDNA. In this hypothesis, total amounts of mtDNA in cells remain unchanged, but mtDNA amounts per individual mitochondria vary. Some mitochondria have more mtDNA, whereas others contain no or reduced mtDNA copies. Because ETC subunits are encoded by both nuclear DNA and mtDNA, improper ratios of ETC subunits will be generated and assembly will be altered, likely affecting oxidative phosphorylation (Chen et al., 2010). However, we found that ETC complexes are assembled normally in the absence of Opa1. In addition, this hypothesis is unable to explain our observation that complexes IV and I were specifically affected. A third hypothesis is that the partial release of cytochrome c from the inner membrane cristae destabilizes complex IV. Supporting this idea, cytochrome c binds to complex IV and is required for the stability and activity of this complex (Vempati et al., 2009). Because the closed morphology of cristae junctions maintains cytochrome c inside the inner membrane cristae (Frezza et al., 2006), opening cristae junctions could relocate a fraction of cytochrome c to the intermembrane space in Opa1-null mitochondria, compromising its interactions with complex IV and supercomplex containing complexes IV and I. It would be important to test these hypotheses and further understand the role of Opa1 in mitochondrial structure and function in future studies.
Previous reports have suggested that beta cell mitochondrial dysfunction is involved in type 2 diabetes (Lamson and Plaza, 2002; Lowell and Shulman, 2005; Prentki and Nolan, 2006). For example, the maintenance of normal mtDNA is critical for normal beta cell function, as loss of mtDNA leads to hyperglycemia in mice carrying beta cell–specific deletion of Tfam, which is a mitochondrial transcriptional factor required for mtDNA maintenance (Silva et al., 2000). Because mitochondrial fusion is thought to be important for mtDNA maintenance, we initially expected RIP2-Opa1KO mice to lose mtDNA. On the contrary, Opa1 loss resulted in a reduction in the quantity and activity of complex IV without mtDNA deficiency. Therefore our experiments provide a new model for mitochondrial diabetes. In addition, our findings also show differences in the effect of Opa1 loss in tissues and cultured cells. To better understand physiological roles of Opa1, it would be important to examine its function in vivo as well as in vitro. We speculate that the observed differences between islets and cultured cells may result from varying demand on glycolysis for ATP production. Moreover, we propose that changes in Opa1 levels may associate directly with the pathogenesis and progression of this disease. In support of this idea, a recent study showed that islet Opa1 levels decrease before the onset of type 2 diabetes in ob/ob mouse models (Keller et al., 2008). Furthermore, a Goto–Kakizaki rat model for type 2 diabetes exhibits fragmented mitochondria with altered cristae morphology that is different from the normal tubular shape observed in beta cells (Mizukami et al., 2008). Such changes in mitochondrial morphology may be a consequence of defects in Opa1. This study clearly demonstrates the physiological importance of Opa1 in mammals and provides a mechanism by which mitochondrial structure and dynamics are linked to metabolism.
MATERIALS AND METHODS
Generation of knockout mice
All animal work was done according to guidelines established by the Johns Hopkins University Committee on Animal Care. We inserted a neomycin-resistant marker flanked by FRT and loxP sites next to exons 10 and 13, which are located in an essential GTPase domain. The targeting vector was transfected into C57BL/6–129/SvEv ES cells by electroporation. G418-resistant colonies were screened by PCR. Targeted ES cells were injected into C57BL/6 blastocysts to create chimeric mice. To create the null Opa1 allele, we crossed Flox-neo mice with EIIa-Cre transgenic mice as described (Wakabayashi et al., 2009). In addition, upon loxP recombination, a stop codon was generated immediately after exon 9 due to a frame shift. To generate the conditional allele, Flox-neo mice were crossed with a transgenic strain that ubiquitously expresses Flp recombinase (Wakabayashi et al., 2009). We bred these strains with a wild-type strain and isolated mice heterozygous for the null or conditional allele but not for Cre or Flp recombinase. All mice were kept on a mixed C57BL/6–129/SvEv background. We used RIP2-Opa1KO mice (RIP2-Cre Opa1flox/−) and littermate controls (RIP2-Cre Opa1flox/+) at 8–12 wk in all of the experiments.
Antibodies
The following antibodies were used in this study: Opa1 (612607; BD Biosciences, Franklin Lakes, NJ), Tim23 (611222; BD Biosciences), insulin (4011–1; Millipore, Billerica, MA), glucagon (AB932; Chemicon, Temecula, CA), Ki67 (ab15580; Abcam, Cambridge, MA); PARP (9542; Cell Signaling Technology, Beverly, MA), caspase-3 (9665; Cell Signaling Technology), actin (sc-1615; Santa Cruz Biotechnology, Santa Cruz, CA), OXPHOS cocktails for NDUFB8, FeS, Core2, subunit I, and subunit α (MS604; MitoSciences, Eugene, OR), subunit IV (MS407, MitoSciences), subunit Vb (MS410, MitoSciences), and cytochrome c (556432, BD Biosciences).
Electron microscopy
Pancreas tissues were dissected and fixed in 3% paraformaldehyde, 1.5% glutaraldehyde, 2.5% sucrose, and 100 mM cacodylate, pH 7.4, for 2 d. Samples were processed, sectioned, and observed as described (Wakabayashi et al., 2009). Volume densities of mitochondria were calculated using a point-counting method with a grid consisting of 400 grids.
Measurements of food intake, adiposity, lean content, and locomotion
Daily food intake data were acquired during a 4-d experimental period using an Oxymax Equal Flow System (Columbus Instruments, Columbus, OH). Fat and lean contents were determined using an EcoMRI apparatus (Echo Medical Systems, Houston, TX). Novelty-induced activity in the open field was assessed over a 30-min period using activity chambers with infrared beams (San Diego Instruments, San Diego, CA). Horizontal and vertical activities were automatically recorded as described previously (Pletnikov et al., 2008).
Glucose and insulin measurement in vivo
Tail vein blood glucose concentrations were immediately determined using a OneTouch UltraMini Meter (Lifescan, Milpitas, CA). Nonfasting blood glucose concentrations were measured between 10 a.m. and 12 p.m. in mice between 8 and 12 wk of age. Fasting blood glucose concentrations were obtained in the morning after 14–16 h of overnight starvation in mice between 8 and 12 wk of age.
Glucose tolerance tests were performed at 8–12 wk of age. Mice were fasted for 14–16 h and subjected to intraperitoneal injection of glucose (1.5 mg/g body weight). Blood glucose concentrations were determined using a OneTouch UltraMini Meter. Insulin tolerance was performed at 8–12 wk of age. After fasting for 14–16 h, mice were subjected to intraperitoneal injection of insulin (0.5 U/kg body weight). Blood glucose concentrations were determined at different time points.
To measure blood insulin levels after glucose injection, mice between 8 and 12 wk of age were fasted for 14–16 h and subjected to intraperitoneal injection of glucose (1.5 mg/g body weight). Plasma was obtained by centrifuging blood collected from the tail vein. Insulin concentration in the plasma was determined using an ultrasensitive mouse insulin enzyme-linked immunosorbent assay (ELISA) kit (Crystal Chem, Downers Grove, IL).
Immunohistochemistry
Pancreas tissues were dissected, fixed in 4% paraformaldehyde overnight at 4°C, and embedded in paraffin. Paraffin sections were deparafinized, rehydrated, and heated in a microwave in 10 mM citrate acid. After blocking in 10% goat and donkey sera diluted in TPBS, sections were incubated with guinea pig anti-insulin antibodies (1:2000; Millipore) and rabbit anti-glucagon antibodies (1:2000; Chemicon). Immunocomplexes were visualized using fluorescently labeled secondary antibodies, including goat anti–guinea pig Alexa Fluor 594 (1:2000; Invitrogen, Carlsbad, CA) and donkey anti–rabbit Alexa Fluor 488 (1:2000; Invitrogen). Images were captured using an Olympus (Center Valley, PA) IX 71 microscope equipped with a Photometrics (Tucson, AZ) Cascade 512B-intensified charge-coupled device (CCD) camera. Islet area and size were determined using ImageJ software.
Insulin secretion from isolated islets
Approximately 100 isolated islets were incubated in buffer A (135 mM NaCl, 3.6 mM KCl, 5 mM NaH2PO4, 0.5 mM MgCl2, 1.5 mM CaCl2, 2 mM NaHCO3, 0.07% bovine serum albumin [BSA], and 10 mM HEPES, pH 7.4) containing 3 mM glucose for 1 h at 37°C, collected by centrifugation, and incubated in buffer A containing 3 or 11 mM glucose for 1 h at 37°C. After centrifugation, supernatant insulin levels were determined using an ultrasensitive mouse insulin ELISA kit (Crystal Chem). Islet protein concentration was determined using a Pierce BCA Protein Assay Kit (Thermo Fisher Scientific, Rockford, IL) and used to normalize insulin amounts.
ATP measurement
Pancreatic islets were isolated from mutant and control mice using standard collagenase digestion followed by purification through a Ficoll gradient (Hussain et al., 2006). Islets were hand picked under light microscope and cultured in RPMI-1640 containing 5.5 mM glucose and 10% fetal calf serum overnight in a humidified incubator (5% CO2) at 37°C. After preincubation with 3 mM glucose for 1 h, islets were treated with or without 11 mM glucose for 5 min at 37°C (Li et al., 2003). Approximately 100 islets were then collected by centrifugation, incubated with 10 μl of 5% trichloroacetic acid (TCA) for 5 min at room temperature, and mixed with 90 μl of 1% Triton X-100 and 100 mM Tris-acetate, pH 8.0. ATP amounts were determined using an Enliten ATP assay kit (Promega, Madison, WI).
Oxygen consumption
Measurement of oxygen consumption in isolated islets was performed using a Seahorse XF24 analyzer according to the manufacturer's instructions (Seahorse Bioscience, North Billerica, MA). Approximately 70 islets were suspended in modified XF assay medium containing 3 mM glucose and then transferred into the depressed chamber. To stimulate islets, 20 mM glucose was used for islet stimulation. To block F1Fo-ATPase, 5 μM oligomycin was used. After the XF24 calibration was complete, the islet plate was placed into the XF24, and then the program was started. Basal respiration rates were used for normalization.
Calcium measurement
Isolated islets were placed in Cell-Tak–coated (BD Biosciences), Nunc eight-well chambered coverglasses (Thermo Fisher Scientific) and then loaded with 2 μM Fura 2-AM for 30 min in RPMI containing 3 mM glucose. After washing, islets were incubated in Krebs buffer containing 3 mM glucose and 0.07% BSA. For islet stimulation, we used 3 and 11 mM glucose. The 340 nm/380 nm fluorescence ratio was measured using an Olympus IX81 motorized inverted microscope with a 40× objective (UAPO/340, 1.35 numerical aperture), a Hamamatsu C9100-02 front-illuminated EM-CCD camera (Hamamatsu, Japan), and 3i Slidebook software.
Activities of electron transport chain systems
The activities of complexes I and IV were determined using the complex I and IV enzyme activity dipstick assay kits (MitoSciences) according to the manufacturer's protocol.
Quantitative PCR for mtDNA amounts
mtDNA copy number per nuclear genome in isolated islets was quantitated as described (Chen et al. 2010). A Fermentas Maxima SYBR Green/Fluorescein qPCR Mater Mix (Thermo Fisher Scientific) and an iQ Cycler (Bio-Rad, Hercules, CA) were used according to the manufacturers' protocols. The primers used for mtDNA were CCTATCACCCTTGCCATCAT and GAGGCTGTTGCTTGTGTGAC. For nuclear DNA (PECAM), ATGGAAAGCCTGCCATCATG and TCCTTGTTGTTCAGCATCAC were used.
Southern blotting
Southern blotting was performed as described (Ide et al., 2001; Naini and Shanske, 2007) with a few minor modifications. Briefly, DNA was extracted from islets using the DNeasy Blood and Tissue Kit (Qiagen, Valencia, CA). Then, the DNA (2 μg) was digested with SacI, resolved by electrophoresis, and transferred to nitrocellulose membrane (Amersham Hybond-N+; GE Healthcare Bio-Sciences, Piscataway, NJ). Hybridization was performed using the Amersham ECL Direct Nucleic Acid Labelling and Detection System according to the manufacturer's instructions. The probe used for mtDNA corresponds to position 10643–11224 of the mouse mitochondrial genome, and the PCR primers corresponding to this probe were ACTGCTAATTGCCCTCATCT and GGGAAGACCATTTGAAGTCC. The probe used for nuclear DNA corresponds to position 939–1505 of the 18S rRNA gene, and the primers corresponding to this probe were ATTCGTATTGCGCCGCTAGA and AAGGGCATCACAGACCTGTT.
Glycerol density gradient centrifugation
Glycerol density gradient centrifugation was performed as previously described (Tamura et al., 2009). Islets were solubilized at 0.5 μg protein/μl in digitonin buffer (1% digitonin, 20 mM Tris-HCl [pH 7.5], 50 mM NaCl, 10% [vol/vol] glycerol, 0.1 mM EDTA, and 1 mM phenylmethylsulfonylfluoride) for 20 min on ice and then centrifuged at 16,100 × g for 15 min. The 200-μl supernatant was placed onto a 5-ml glycerol gradient (20–40%) in 20 mM Tris-HCl (pH 7.4), 50 mM NaCl, 50 mM 6-aminohexanoic acid, 0.1 mM EDTA, 0.1% digitonin, and protease inhibitor cocktail and then centrifuged at 45,000 rpm for 15 h in a SW55Ti rotor (Beckman Coulter, Brea, CA) at 4°C. After centrifugation, 270-μl fractions were collected from the top of the gradient. Proteins were precipitated with 10% TCA and then resolved by DS-PAGE followed by immunoblotting with OXPHOS antibody cocktail (MitoSciences). The band intensity in each fraction was normalized relative to the total intensity.
Statistical analysis
All values are means ± SEM. Results were statistically analyzed using the t test (*p < 0.05; **p < 0.01; ***p < 0.001).
Supplementary Material
Acknowledgments
We thank Michael Wolfgang for critically reading the manuscript and for help with glucose measurements, Miriam Wahl for help with calcium measurement, and Boyang Li for data quantitation. This work is supported by the National Institutes of Health (Grant GM 084015 to M.I., Grant GM089853 to H.S., and Grants DK081472 and DK079639 to M.A.H.) and the American Heart Association (Grant 0765345U to M.I. and Grant 0730247N to H.S.).
Abbreviations used:
- ELISA
enzyme-linked immunosorbent assay
- ETC
electron transport chain
- KO
knockout
- MEFs
mouse embryonic fibroblasts
- mtDNA
mitochondrial DNA
- ROS
reactive oxygen species
- TUNEL
terminal deoxynucleotidyl transferase–mediated dUTP nick end labeling
Footnotes
This article was published online ahead of print in MBoC in Press (http://www.molbiolcell.org/cgi/doi/10.1091/mbc.E10-12-0933) on May 5, 2011.
REFERENCES
- Alavi MV, et al. A splice site mutation in the murine Opa1 gene features pathology of autosomal dominant optic atrophy. Brain. 2007;130:1029–1042. doi: 10.1093/brain/awm005. [DOI] [PubMed] [Google Scholar]
- Benard G, Karbowski M. Mitochondrial fusion and division: regulation and role in cell viability. Semin Cell Dev Biol. 2009;20:365–374. doi: 10.1016/j.semcdb.2008.12.012. [DOI] [PMC free article] [PubMed] [Google Scholar]
- Cerveny KL, Tamura Y, Zhang Z, Jensen RE, Sesaki H. Regulation of mitochondrial fusion and division. Trends Cell Biol. 2007;17:563–569. doi: 10.1016/j.tcb.2007.08.006. [DOI] [PubMed] [Google Scholar]
- Chan DC. Mitochondria: dynamic organelles in disease, aging, and development. Cell. 2006;125:1241–1252. doi: 10.1016/j.cell.2006.06.010. [DOI] [PubMed] [Google Scholar]
- Chen H, Chomyn A, Chan DC. Disruption of fusion results in mitochondrial heterogeneity and dysfunction. J Biol Chem. 2005;280:26185–26192. doi: 10.1074/jbc.M503062200. [DOI] [PubMed] [Google Scholar]
- Chen H, Vermulst M, Wang YE, Chomyn A, Prolla TA, McCaffery JM, Chan DC. Mitochondrial fusion is required for mtDNA stability in skeletal muscle and tolerance of mtDNA mutations. Cell. 2010;141:280–289. doi: 10.1016/j.cell.2010.02.026. [DOI] [PMC free article] [PubMed] [Google Scholar]
- Cipolat S, Martins de Brito O, Dal Zilio B, Scorrano L. OPA1 requires mitofusin 1 to promote mitochondrial fusion. Proc Natl Acad Sci USA. 2004;101:15927–15932. doi: 10.1073/pnas.0407043101. [DOI] [PMC free article] [PubMed] [Google Scholar]
- Davies VJ, Hollins AJ, Piechota MJ, Yip W, Davies JR, White KE, Nicols PP, Boulton ME, Votruba M. Opa1 deficiency in a mouse model of autosomal dominant optic atrophy impairs mitochondrial morphology, optic nerve structure and visual function. Hum Mol Genet. 2007;16:1307–1318. doi: 10.1093/hmg/ddm079. [DOI] [PubMed] [Google Scholar]
- Frezza C, et al. OPA1 controls apoptotic cristae remodeling independently from mitochondrial fusion. Cell. 2006;126:177–189. doi: 10.1016/j.cell.2006.06.025. [DOI] [PubMed] [Google Scholar]
- Fujimoto S, Nabe K, Takehiro M, Shimodahira M, Kajikawa M, Takeda T, Mukai E, Inagaki N, Seino Y. Impaired metabolism-secretion coupling in pancreatic beta-cells: role of determinants of mitochondrial ATP production. Diabetes Res Clin Pract. 2007;77(suppl 1):S2–S10. doi: 10.1016/j.diabres.2007.01.026. [DOI] [PubMed] [Google Scholar]
- Griparic L, van der Wel NN, Orozco IJ, Peters PJ, van der Bliek AM. Loss of the intermembrane space protein Mgm1/OPA1 induces swelling and localized constrictions along the lengths of mitochondria. J Biol Chem. 2004;279:18792–18798. doi: 10.1074/jbc.M400920200. [DOI] [PubMed] [Google Scholar]
- Hoppins S, Lackner L, Nunnari J. The machines that divide and fuse mitochondria. Annu Rev Biochem. 2007;76:751–780. doi: 10.1146/annurev.biochem.76.071905.090048. [DOI] [PubMed] [Google Scholar]
- Hussain MA, Porras DL, Rowe MH, West JR, Song WJ, Schreiber WE, Wondisford FE. Increased pancreatic beta-cell proliferation mediated by CREB binding protein gene activation. Mol Cell Biol. 2006;26:7747–7759. doi: 10.1128/MCB.02353-05. [DOI] [PMC free article] [PubMed] [Google Scholar]
- Ide T, Tsutsui H, Hayashidani S, Kang D, Suematsu N, Nakamura K, Utsumi H, Hamasaki N, Takeshita A. Mitochondrial DNA damage and dysfunction associated with oxidative stress in failing hearts after myocardial infarction. Circ Res. 2001;88:529–535. doi: 10.1161/01.res.88.5.529. [DOI] [PubMed] [Google Scholar]
- Kanazawa T, Zappaterra MD, Hasegawa A, Wright AP, Newman-Smith ED, Buttle KF, McDonald K, Mannella CA, van der Bliek AM. The C. elegans Opa1 homologue EAT-3 is essential for resistance to free radicals. PLoS Genet. 2008;4:e1000022. doi: 10.1371/journal.pgen.1000022. [DOI] [PMC free article] [PubMed] [Google Scholar]
- Keller MP, et al. A gene expression network model of type 2 diabetes links cell cycle regulation in islets with diabetes susceptibility. Genome Res. 2008;18:706–716. doi: 10.1101/gr.074914.107. [DOI] [PMC free article] [PubMed] [Google Scholar]
- Lamson DW, Plaza SM. Mitochondrial factors in the pathogenesis of diabetes: a hypothesis for treatment. Altern Med Rev. 2002;7:94–111. [PubMed] [Google Scholar]
- Li C, Najafi H, Daikhin Y, Nissim IB, Collins HW, Yudkoff M, Matschinsky FM, Stanley CA. Regulation of leucine-stimulated insulin secretion and glutamine metabolism in isolated rat islets. J Biol Chem. 2003;278:2853–2858. doi: 10.1074/jbc.M210577200. [DOI] [PubMed] [Google Scholar]
- Lowell BB, Shulman GI. Mitochondrial dysfunction and type 2 diabetes. Science. 2005;307:384–387. doi: 10.1126/science.1104343. [DOI] [PubMed] [Google Scholar]
- MacDonald PE, Joseph JW, Rorsman P. Glucose-sensing mechanisms in pancreatic beta-cells. Philos Trans R Soc Lond B Biol Sci. 2005;360:2211–2225. doi: 10.1098/rstb.2005.1762. [DOI] [PMC free article] [PubMed] [Google Scholar]
- Maechler P, de Andrade PB. Mitochondrial damages and the regulation of insulin secretion. Biochem Soc Trans. 2006;34:824–827. doi: 10.1042/BST0340824. [DOI] [PubMed] [Google Scholar]
- Maechler P, Wollheim CB. Mitochondrial function in normal and diabetic beta-cells. Nature. 2001;414:807–812. doi: 10.1038/414807a. [DOI] [PubMed] [Google Scholar]
- Meeusen S, DeVay R, Block J, Cassidy-Stone A, Wayson S, McCaffery JM, Nunnari J. Mitochondrial inner-membrane fusion and crista maintenance requires the dynamin-related GTPase Mgm1. Cell. 2006;127:383–395. doi: 10.1016/j.cell.2006.09.021. [DOI] [PubMed] [Google Scholar]
- Merkwirth C, Dargazanli S, Tatsuta T, Geimer S, Lower B, Wunderlich FT, von Kleist-Retzow JC, Waisman A, Westermann B, Langer T. Prohibitins control cell proliferation and apoptosis by regulating OPA1-dependent cristae morphogenesis in mitochondria. Genes Dev. 2008;22:476–488. doi: 10.1101/gad.460708. [DOI] [PMC free article] [PubMed] [Google Scholar]
- Mizukami H, Wada R, Koyama M, Takeo T, Suga S, Wakui M, Yagihashi S. Augmented beta cell loss and mitochondrial abnormalities in sucrose-fed GK rats. Virchows Arch. 2008;452:383–392. doi: 10.1007/s00428-007-0508-2. [DOI] [PubMed] [Google Scholar]
- Molina AJ, et al. Mitochondrial networking protects beta-cells from nutrient-induced apoptosis. Diabetes. 2009;58:2303–2315. doi: 10.2337/db07-1781. [DOI] [PMC free article] [PubMed] [Google Scholar]
- Naini A, Shanske S. Detection of mutations in mtDNA. Methods Cell Biol. 2007;80:437–463. doi: 10.1016/S0091-679X(06)80022-1. [DOI] [PubMed] [Google Scholar]
- Okamoto K, Shaw JM. Mitochondrial morphology and dynamics in yeast and multicellular eukaryotes. Annu Rev Genet. 2005;39:503–536. doi: 10.1146/annurev.genet.38.072902.093019. [DOI] [PubMed] [Google Scholar]
- Olichon A, Baricault L, Gas N, Guillou E, Valette A, Belenguer P, Lenaers G. Loss of OPA1 perturbates the mitochondrial inner membrane structure and integrity, leading to cytochrome c release and apoptosis. J Biol Chem. 2003;278:7743–7746. doi: 10.1074/jbc.C200677200. [DOI] [PubMed] [Google Scholar]
- Pletnikov MV, Ayhan Y, Xu Y, Nikolskaia O, Ovanesov M, Huang H, Mori S, Moran TH, Ross CA. Enlargement of the lateral ventricles in mutant DISC1 transgenic mice. Mol Psychiatry. 2008;13:115. doi: 10.1038/sj.mp.4002144. [DOI] [PubMed] [Google Scholar]
- Postic C, Shiota M, Niswender KD, Jetton TL, Chen Y, Moates JM, Shelton KD, Lindner J, Cherrington AD, Magnuson MA. Dual roles for glucokinase in glucose homeostasis as determined by liver and pancreatic beta cell-specific gene knock-outs using Cre recombinase. J Biol Chem. 1999;274:305–315. doi: 10.1074/jbc.274.1.305. [DOI] [PubMed] [Google Scholar]
- Prentki M, Nolan CJ. Islet beta cell failure in type 2 diabetes. J Clin Invest. 2006;116:1802–1812. doi: 10.1172/JCI29103. [DOI] [PMC free article] [PubMed] [Google Scholar]
- Rolo AP, Palmeira CM. Diabetes and mitochondrial function: role of hyperglycemia and oxidative stress. Toxicol Appl Pharmacol. 2006;212:167–178. doi: 10.1016/j.taap.2006.01.003. [DOI] [PubMed] [Google Scholar]
- Rube DA, van der Bliek AM. Mitochondrial morphology is dynamic and varied. Mol Cell Biochem. 2004;256–257:331–339. doi: 10.1023/b:mcbi.0000009879.01256.f6. [DOI] [PubMed] [Google Scholar]
- Scott I, Youle RJ. Mitochondrial fission and fusion. Essays Biochem. 2010;47:85–98. doi: 10.1042/bse0470085. [DOI] [PMC free article] [PubMed] [Google Scholar]
- Sesaki H, Southard SM, Yaffe MP, Jensen RE. Mgm1p, a dynamin-related GTPase, is essential for fusion of the mitochondrial outer membrane. Mol Biol Cell. 2003;14:2342–2356. doi: 10.1091/mbc.E02-12-0788. [DOI] [PMC free article] [PubMed] [Google Scholar]
- Silva JP, Kohler M, Graff C, Oldfors A, Magnuson MA, Berggren PO, Larsson NG. Impaired insulin secretion and beta-cell loss in tissue-specific knockout mice with mitochondrial diabetes. Nat Genet. 2000;26:336–340. doi: 10.1038/81649. [DOI] [PubMed] [Google Scholar]
- Song Z, Chen H, Fiket M, Alexander C, Chan DC. OPA1 processing controls mitochondrial fusion and is regulated by mRNA splicing, membrane potential, and Yme1L. J Cell Biol. 2007;178:749–755. doi: 10.1083/jcb.200704110. [DOI] [PMC free article] [PubMed] [Google Scholar]
- Song Z, Ghochani M, McCaffery JM, Frey TG, Chan DC. Mitofusins and OPA1 mediate sequential steps in mitochondrial membrane fusion. Mol Biol Cell. 2009;20:3525–3532. doi: 10.1091/mbc.E09-03-0252. [DOI] [PMC free article] [PubMed] [Google Scholar]
- Soubannier V, McBride HM. Positioning mitochondrial plasticity within cellular signaling cascades. Biochim Biophys Acta. 2009;1793:154–170. doi: 10.1016/j.bbamcr.2008.07.008. [DOI] [PubMed] [Google Scholar]
- Tamura Y, Endo T, Iijima M, Sesaki H. Ups1p and Ups2p antagonistically regulate cardiolipin metabolism in mitochondria. J Cell Biol. 2009;185:1029–1045. doi: 10.1083/jcb.200812018. [DOI] [PMC free article] [PubMed] [Google Scholar]
- Twig G, et al. Fission and selective fusion govern mitochondrial segregation and elimination by autophagy. EMBO J. 2009;27:433–446. doi: 10.1038/sj.emboj.7601963. [DOI] [PMC free article] [PubMed] [Google Scholar]
- Vempati UD, Han X, Moraes CT. Lack of cytochrome c in mouse fibroblasts disrupts assembly/stability of respiratory complexes I and IV. J Biol Chem. 2009;284:4383–4391. doi: 10.1074/jbc.M805972200. [DOI] [PMC free article] [PubMed] [Google Scholar]
- Wakabayashi J, Zhang Z, Wakabayashi N, Tamura Y, Fukaya M, Kensler TW, Iijima M, Sesaki H. The dynamin-related GTPase Drp1 is required for embryonic and brain development in mice. J Cell Biol. 2009;186:805–816. doi: 10.1083/jcb.200903065. [DOI] [PMC free article] [PubMed] [Google Scholar]
- Wallace DC. Mitochondrial diseases in man and mouse. Science. 1999;283:1482–1488. doi: 10.1126/science.283.5407.1482. [DOI] [PubMed] [Google Scholar]
- Wallace DC, Fan W. The pathophysiology of mitochondrial disease as modeled in the mouse. Genes Dev. 2009;23:1714–1736. doi: 10.1101/gad.1784909. [DOI] [PMC free article] [PubMed] [Google Scholar]
- Westermann B. Molecular machinery of mitochondrial fusion and fission. J Biol Chem. 2008;283:13501–13505. doi: 10.1074/jbc.R800011200. [DOI] [PubMed] [Google Scholar]
- Wikstrom JD, et al. Beta-cell mitochondria exhibit membrane potential heterogeneity that can be altered by stimulatory or toxic fuel levels. Diabetes. 2007;56:2569–2578. doi: 10.2337/db06-0757. [DOI] [PubMed] [Google Scholar]
Associated Data
This section collects any data citations, data availability statements, or supplementary materials included in this article.