

Abstract
Organic substances can adopt an amorphous solid or semisolid state, influencing the rate of heterogeneous reactions and multiphase processes in atmospheric aerosols. Here we demonstrate how molecular diffusion in the condensed phase affects the gas uptake and chemical transformation of semisolid organic particles. Flow tube experiments show that the ozone uptake and oxidative aging of amorphous protein is kinetically limited by bulk diffusion. The reactive gas uptake exhibits a pronounced increase with relative humidity, which can be explained by a decrease of viscosity and increase of diffusivity due to hygroscopic water uptake transforming the amorphous organic matrix from a glassy to a semisolid state (moisture-induced phase transition). The reaction rate depends on the condensed phase diffusion coefficients of both the oxidant and the organic reactant molecules, which can be described by a kinetic multilayer flux model but not by the traditional resistor model approach of multiphase chemistry. The chemical lifetime of reactive compounds in atmospheric particles can increase from seconds to days as the rate of diffusion in semisolid phases can decrease by multiple orders of magnitude in response to low temperature or low relative humidity. The findings demonstrate that the occurrence and properties of amorphous semisolid phases challenge traditional views and require advanced formalisms for the description of organic particle formation and transformation in atmospheric models of aerosol effects on air quality, public health, and climate.
Keywords: Stokes-Einstein, percolation theory, glass transition, secondary organic aerosol partitioning, ozonolysis
Aerosols are ubiquitous in the atmosphere and have strong effects on climate and public health (1–3). Depending on chemical composition, phase state, and surface properties, aerosol particles can act as nuclei for cloud droplets and ice crystals, and they can affect the abundance of trace gases through heterogeneous chemical reactions (4–8). Gas-particle interactions can also significantly change the physical and chemical properties of aerosols such as toxicity, reactivity, hygroscopicity, and radiative properties (9–13). Chemical reactions and mass-transport lead to continuous transformation and changes in the composition of atmospheric aerosols (“chemical aging”) (14–20).
Atmospheric aerosol particles may occur as solids or liquids or as a mixture of both depending on their composition and ambient conditions (21, 22). Carbonaceous combustion aerosol particles such as soot and related substances are known to be quasi-solid and undergo chemical reactions at the surface rather than in the bulk (black or elemental carbon, graphene, and polycyclic aromatic hydrocarbons) (1, 23–25). Until recently, secondary organic aerosol (SOA) particles formed in the atmosphere from condensable oxidation products of volatile organic compounds were assumed to be liquid (26–28). Virtanen et al. (2010) (29), however, showed that biogenic SOA particles formed in plant chamber experiments and in new particle formation events over boreal forests can adopt an amorphous semisolid state, which is in line with the observed presence of oligomers or other organic compounds with high molecular mass and low volatility in SOA (30, 31). Many organic substances, including carboxylic acids, carbohydrates, and proteins, tend to form amorphous phases upon cooling or drying of aqueous solution droplets (32–34). Depending on viscosity and microstructure, the amorphous phases can be classified as glasses, rubbers, gels, or ultraviscous liquids (32).
Amorphous substances have no long-range atomic order and are classified as solid glasses when their viscosity exceeds 1012 Pa s (35). Semisolid substances like rubbers, gels, or ultraviscous liquids have viscosities that are in the range of ∼1012 to ∼102 Pa s, which is still orders of magnitude higher than the viscosity of liquid water at ambient conditions (∼10-3 Pa s) (32, 36). Through the Stokes-Einstein equation, the viscosity of an amorphous organic substance can be related to its molecular self-diffusion coefficient (Dorg):
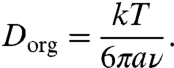 |
[1] |
Here k is the Boltzmann constant (1.38 × 10⁻²³ J K-1), T is the temperature (K), a is the effective molecular radius (m), and ν is the dynamic viscosity (Pa s). Typical viscosity values and related diffusion coefficients for liquid, semisolid, and solid phases are listed in Table 1. Note that Dorg can vary over fifteen orders of magnitude from ∼10-5 cm2 s-1 in a liquid to ∼10-20 cm2 s-1 in a solid organic matrix.
Table 1.
Characteristic magnitudes of viscosity for different phase states, corresponding self-diffusion coefficients of organic matrix molecules (Dorg, Eq. 1 assuming a = 10-10 m at 298 K), and condensed phase diffusion coefficients of small molecules like water and atmospheric oxidants (Dox)
| Phase state | ν (Pa s) | Dorg(cm2 s-1) | Dox(cm2 s-1) |
| Liquid | ∼10-3 | ∼10-5 | ∼10-5 |
| Semisolid | ∼102–1012 | ∼10-10–10-20 | ∼10-7–10-9 |
| Solid | ≥1012 | ≤ 10-20 | ∼10-10 |
Compared to the self-diffusion coefficients of the large organic molecules constituting the bulk material of amorphous organic particles (multifunctional hydrocarbon derivatives, oligomers, and macromolecules), the bulk diffusion coefficients of atmospheric photooxidants and other small gas molecules entering the organic matrix (O3, OH, NOx, H2O, etc.) are usually orders of magnitude larger and less variable. Typically, the diffusion coefficients of water and photo-oxidants (Dox) are around ∼10-10 cm2 s-1 in solids (37, 38), ∼10-9—10-6 cm2 s-1 in semisolid (39), and ∼10-5 cm2 s-1 in liquid organic matrices (37, 40).
Fig. 1 shows the characteristic time of mass-transport and mixing by molecular diffusion τcd in aerosol particles (41) according to
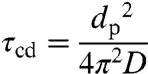 |
[2] |
as a function of particle diameter (dp = 1 nm–10 μm) and diffusion coefficient (D = 10-5 cm2 s-1 to 10-21 cm2 s-1). In case of nonreactive gas uptake (partitioning), τcd is the e-folding time of equilibration, i.e., the time after which the concentration in the particle core deviates by less than a factor of 1/e from the equilibrium value.
Fig. 1.

Characteristic time of bulk diffusion (τcd) in liquid, semisolid, and solid particles as a function of diffusion coefficient and particle diameter. In the size range of the atmospheric aerosol accumulation mode (dp ≈ 102 nm), τcd in semisolid particles varies from seconds to years (light green arrow).
In the size range of the accumulation mode of atmospheric aerosols (dp ≈ 102 nm), τcd for nonvolatile organic species varies from microseconds to milliseconds for liquids, seconds to years for semisolids, and many years for solids. Thus, diffusion is likely to limit the kinetics of mass-transport and chemical reaction in amorphous organic aerosol particles, but so far the effects of diffusivity and their dependence on ambient conditions have hardly been quantified (29, 42–44).
The viscosity and diffusivity of water soluble and hygroscopic organic substances depend strongly on the ambient relative humidity (RH), because water can act as a plasticizer and increase the mobility of the organics (32, 43). Accordingly, the glass transition temperature of organic substances depends on RH (33, 34), and amorphous semisolids can undergo moisture-induced phase transitions (32, 43, 44). The viscosity and bulk diffusion coefficient of amorphous proteins can be estimated as a function of relative humidity, using the Stokes-Einstein relation with published viscosity and hygroscopic growth factor data (45–47) (SI Text). As shown in Fig. 2A, the phase of the protein bovine serum albumin (BSA) changes from solid to semisolid as RH increases, while Dorg increases from 10-21 cm2 s-1 up to 10-10 cm2 s-1. Fig. 2B shows the diffusion coefficient of ozone in the aqueous protein as estimated from percolation theory and hygroscopicity data [SI Text, (47–49)]. Dox is ∼10-10 cm2 s-1 at < 20% RH, but it increases up to ∼10-5 cm2 s-1 as RH increases to 100%.
Fig. 2.

(A) Viscosity (ν) and self-diffusion coefficient (Dorg) of the protein BSA estimated as a function of relative humidity (RH) using the Stokes-Einstein relation with published viscosity data and hygroscopic growth factor data for BSA. As RH increases, the protein phase changes from solid over semisolid to viscous liquid, while Dorg increases from ∼10-21 cm2 s-1 to ∼10-10 cm2 s-1. (B) Diffusion coefficient of ozone (Dox) in BSA estimated as a function of RH by theoretical calculations using hygroscopic growth factor data. Dox is ∼5 × 10⁻¹⁰ cm2 s-1 in solid BSA at RH < 20%, but it increases up to ∼10-6 cm2 s-1 in a viscous liquid aqueous phase at RH > 95%. The shaded areas represent uncertainties of estimation. The red stars show the Dorg and Dox values derived from the ozone uptake experiments, and the error bars indicate corresponding uncertainties.
Experimental and theoretical studies investigating atmospheric multiphase processes usually apply resistor model formulations that build on analogies with electric circuits (14, 15, 50, 51). The traditional resistor models, however, are usually based on simplifying assumptions such as steady state conditions, homogeneous mixing, and limited numbers of species and processes. To overcome these limitations, we use kinetic flux models to analyze measurement data of ozone uptake by amorphous semisolid organics and to elucidate the effects of bulk diffusion on gas uptake and chemical aging of atmospheric aerosols. Ozone uptake experiments were performed in a flow tube coated with the protein BSA as a proxy for semisolid organic aerosol (32, 47), and numerical simulations were performed with kinetic double- and multilayer models of aerosol surface and bulk chemistry [K2-SUB (52), KM-SUB (42)].
Results and Discussion
Ozone Uptake by Amorphous Protein.
Measurements of ozone uptake by amorphous protein were conducted in a coated wall flow tube for a wide range of ozone concentrations and relative humidities (42–207 ppb O3, 0–95% RH, 296 K, 1 atm). The measurement results are ozone uptake coefficients (γO3) which represent the probability that ozone molecules colliding with the surface are taken up by the condensed phase [net loss from the gas phase (53, 54)].
Fig. 3 shows double-logarithmic plots of γO3 plotted against reaction time (t), which exhibit a slope that is characteristic for diffusion-limited gas uptake (γ ∝ (D/πt)1/2, ∂ ln γ/∂ ln t = -0.5) (51, 55, 56). As shown in Fig. 3A, the uptake coefficients observed at a given relative humidity decreased with increasing gas-phase concentration of ozone, which is due to more rapid depletion of condensed phase reactants (reactive amino acids in the protein). Fig. 3B shows that the uptake coefficients observed at a given ozone concentration level increased with increasing relative humidity. This behavior can be explained by a decrease of viscosity and increase of diffusivity with increasing RH, while the amorphous protein is transformed from a glassy to a semisolid state.
Fig. 3.

Ozone uptake coefficients (γO3) on protein films (BSA, 246 nm) observed (A) at 50% RH and different gas-phase O3 concentrations (volume mixing ratios) and (B) at ∼140 ppb O3 and different relative humidities. The decrease of γO3 over time exhibits a double-logarithmic slope close to -0.5, which is characteristic for bulk diffusion-limited gas uptake. The time, RH, and O3 concentration dependence of γO3 can be reproduced by the kinetic multilayer model KM-SUB (dotted lines).
The time, concentration, and humidity dependence of γO3 can be reproduced by the kinetic multilayer flux model KM-SUB (42) as illustrated by the dotted lines in Fig. 3 and in Fig. S1. The model input parameters include the surface accommodation coefficient of ozone, the surface and bulk reaction rate coefficients between ozone and reactive amino acids, and the bulk diffusion coefficients of ozone and reactive amino acids (Dox, Dorg). Initial estimates of these parameters were taken from previous work (12, 24, 52), and best fit values were obtained by iterative variation as detailed in SI Text. The best fit values and humidity dependence of Dox and Dorg derived from the kinetic experiments are shown in Fig. 2. The experimental results agree well with the estimates obtained from theoretical calculations using literature data of protein viscosity and hygroscopic growth.
Fig. 4 displays the model simulation results for the experiment performed at 42 ppb O3 and 50% RH. Initially γO3 equals the surface accommodation coefficient αs,O3 ≈ 1 due to adsorption of ozone onto the particle surface. After ∼10-8 s the ozone concentration at the surface reaches a steady state level of ∼107 cm-2 (Fig. S2A) determined by the combination of reversible adsorption, surface reaction, and surface-to-bulk transport, and γO3 decreases to the value of the bulk accommodation coefficient of αb,O3 ≈ 10-5 (Fig. 4A), indicating that the contribution of the surface reaction to the total ozone uptake is relatively minor. Up to ∼10 s, γO3 remains as large as αb,O3, i.e., the uptake kinetics are limited by the transfer of ozone from the surface to the near-surface-bulk where it can readily oxidize reactive amino acids in the amorphous protein. After ∼10 s, which is the time when experimental data become available, γO3 decreases below αb,O3, because the uptake is kinetically limited by diffusion in the bulk where ozone can oxidize further reactive amino acids.
Fig. 4.

Kinetic model results for the ozone uptake by semisolid protein (BSA) at 42 ppb O3 and 50% RH. (A) Ozone uptake coefficients (γO3) as observed (data points) and simulated with a multilayer model (KM-SUB, solid line) and with a resistor-based double-layer model (K2-SUB, dashed line). (B) Radial profile of ozone bulk concentration ([Ox]) calculated with KM-SUB; r/rp is the distance from the particle center normalized by the particle radius (r/rp = 1 at the surface).
In Fig. 4B the y-axis indicates the radial distance from the bottom of the protein coating (r) normalized by the film thickness (rp), ranging from the bottom (r/rp ≈ 0) to the surface of the film (r/rp ≈ 1). The isolines in Fig. 4B show the radial distribution and temporal evolution of ozone in the amorphous protein matrix. Due to low diffusivity and reactive consumption, ozone initially exhibits a steep concentration gradient near the surface (r/rp > 0.90), while the underlying bulk material remains essentially ozone-free. After ∼10 s ozone begins to diffuse further into the bulk (Fig. 4B), the reactive amino acids are depleted near the surface (Fig. S2C), and the reaction front proceeds further into the particle bulk (Fig. S2D).
In contrast to the kinetic multilayer model KM-SUB, the kinetic double-layer model K2-SUB failed to reproduce the experimental results. In analogy to traditional resistor models, K2-SUB does not resolve radial profiles but approximates the effect of bulk processes by a reacto-diffusive flux term (50, 51, 53). This term accounts for the diffusion of gaseous reactants but neglects the diffusion of condensed phase reactants, assuming that the latter are homogeneously mixed. Using the same kinetic parameters as KM-SUB, K2-SUB cannot reproduce the observed time dependence of the ozone uptake coefficient. Instead, the predicted value of γO3 would remain constant over an extended period to 103 s and then drop off steeply due to rapid depletion of reactive amino acids throughout the homogeneously mixed protein film (dashed line in Fig. 4A). The results demonstrate that the assumption of homogeneous mixing and the application of the reacto-diffusive term of traditional resistor models are not appropriate for condensed phase reactants with low diffusivity in an amorphous semisolid matrix. Reliable predictions for such reaction systems require models that are able to resolve the diffusion of both gaseous and condensed phase reactants.
Atmospheric Implications.
To explore and characterize the effects of bulk diffusion on the chemical aging of semisolid organic aerosols in the atmosphere, we calculated the chemical half-life (t1/2) of reactive amino acids in amorphous protein particles exposed to ozone under a wide range of ambient relative humidity and temperature. t1/2 is defined as the time after which the number of reactive amino acids in the particle has decreased to half of its initial value. The particle diameter was set to 200 nm, which is typical for the accumulation mode of atmospheric aerosols, and the ozone concentration was varied in the range of zero to 200 ppb, covering clean and polluted conditions in the lower atmosphere. The kinetic parameters were the same as in the model simulation of the flow tube experiments (Table S1). The dependence of Dox and Dorg on relative humidity is shown in Fig. 2, and their temperature dependence is discussed in the supplement (SI Text).
The results of these calculations are shown in Fig. 5. As expected, t1/2 decreases with increasing ozone gas-phase concentration. Fig. 5A shows that t1/2 depends strongly on the ambient relative humidity at 25 °C. At 50 ppb O3, for instance, t1/2 is ∼4 h at 20% RH, ∼1.5 h at 50% RH, and only ∼0.1 h at 90% RH. This variation is mainly because of the increase of Dox at higher RH due to the moisture-induced phase transition of protein particles (i.e., solid at low RH, semisolid at medium RH, and viscous liquid at high RH). Fig. 5B shows the dependence of t1/2 on ambient temperature at 50% RH: t1/2 is ∼1.5 h at 25 °C, and it increases to ∼20 h at -60 °C due to the decrease of Dox. To account for the possibility of freezing at low temperatures, we added a scenario assuming a diffusion coefficient similar to the values characteristic for small molecules in ice, i.e., Dox ≈ 10-11 cm2 s-1 (57), resulting in t1/2 ≈ 100 h at 50 ppb O3 and -60 °C (upper bound of shaded area). Note that a decrease of reaction rate coefficients with decreasing temperature may increase t1/2 even further. The results show that the chemical half-life of organics can increase dramatically when particles are transported from the boundary layer to the upper free troposphere.
Fig. 5.

Chemical half-life (t1/2) of reactive amino acids in a protein particle of 200 nm diameter calculated as a function of gas-phase ozone concentration (volume mixing ratio, 1 atm). (A) t1/2 at 25 °C for different relative humidities between 20% and 90%. (B) t1/2 at 50% RH for different temperatures between 25°C and -60 °C. The shaded area shows the range of t1/2 at -60 °C estimated for supercooled water vs. ice.
Fig. 6 illustrates how the phase state, viscosity, and diffusivity of atmospheric organic aerosol particle may vary upon changes in ambient relative humidity and temperature (physical transformation). Consequently, the chemical transformation and aging upon exposure to atmospheric oxidants such as O3, OH, NO3, N2O5, and halogen radicals will proceed differently (58, 59). In solid particles, the reactants are essentially confined to the surface, whereas they are rapidly mixed throughout the bulk of liquid particles. The chemical aging of semisolid organic substances is likely to be limited by the rate of molecular diffusion in the particle bulk. Our measurement and model results demonstrate that chemical reactions in amorphous semisolid aerosol particles are indeed limited by bulk diffusion, and that the rate of reaction can be strongly influenced by changes in relative humidity leading to changes in phase state and diffusivity due to hygroscopic water uptake. Thus, the chemical half-life of reactive organic compounds can change by orders of magnitude depending on ambient temperature and relative humidity, and uptake can become limited either by surface reaction, surface-bulk exchange, or bulk diffusion, underpinning the large potential effects of phase state for chemical aging (29, 42, 60, 61). The results of this study demonstrate quantitatively that mass-transport can have strong nonlinear effects on the chemical composition of atmospheric aerosols (16), and that amorphous semisolid states with high viscosity and low diffusion coefficients can effectively shield reactive organic compounds from degradation by atmospheric oxidants.
Fig. 6.

Atmospheric processing of amorphous organic aerosol particles from primary emissions or secondary formation in the atmosphere. The phase state can fluctuate between glassy solid, semisolid and liquid depending on ambient relative humidity and temperature (physical transformation). Depending on phase state and diffusivity, the chemical transformation and aging upon interaction with atmospheric oxidants and other trace gases (small red circles) proceeds differently: relatively slow via surface adsorption and reaction on solid particles or relatively fast via bulk absorption and reaction in liquid particles. Upon cloud formation, solid aerosol particles are more likely to be activated as ice nuclei (IN) forming ice crystals, whereas liquid aerosol particles are more likely to be activated as cloud condensation nuclei (CCN) forming water droplets.
In addition to chemical aging of atmospheric aerosol particles, kinetic limitations of gas uptake by bulk diffusion may also influence the gas-particle partitioning of semivolatile organic compounds (SVOCs). In current gas-particle partitioning models, SVOCs are usually assumed to be well mixed throughout the particle (62–64). However, slow bulk diffusion may change the growth of SOA particles from absorptive to adsorptive, resulting in steep concentration gradients. On the other hand, slow transport from the bulk to the surface may play an important role in the suppression of SOA evaporation (65). Moreover, aerosol hygroscopic growth and the nucleation of cloud droplets or ice crystals can be retarded or inhibited by slow diffusion (29, 32, 34, 43, 44, 47, 54, 66–69). The occurrence and properties of amorphous semisolid phases challenge traditional views and require new formalisms for the description of organic particle transformation and partitioning in atmospheric models of aerosol effects on air quality, public health, cloud physics, and climate.
Methods
BSA was obtained from Sigma-Aldrich (> 96%, Sigma); it is a globular protein with a molecular mass of 67 kDa. Ozone uptake experiments with BSA were conducted in a cylindrical coated wall flow tube reactor (surface area 120 cm2, surface-to-volume ratio 5 cm-1). The sand-blasted inner surface of the pyrex tube was coated with BSA dissolved in water (18.2 MΩ cm, Milli Q plus 185, Millipore) and dried gently with a flow of nitrogen. This procedure led to about 2–4 mg of BSA deposited on the tube, which corresponds to a film thickness of BSA of 130–350 nm, assuming BSA to be evenly spread. O3 was introduced into the flow reactor with synthetic air as carrier gas with a total flow rate of ∼1 L min-1. The experiments were conducted at atmospheric pressure and room temperature (∼1 atm, ∼296 K) and different relative humidities (0–95%). The gas-phase ozone concentration was monitored using a photometric ozone analyzer. The uptake coefficients of ozone (γO3) were calculated using the Cooney-Kim-Davis method to concomitantly take into account radial gas-phase diffusion and first-order loss at the wall (70, 71). The model approach applied to analyze the experimental results is described in the SI Text [KM-SUB (42), K2-SUB (52), Figs. S3, S4, S5, and S6].
Supplementary Material
Acknowledgments.
We thank Y. Sosedova, A. Rouviere, S. Steimer, and M. Birrer for their help in the kinetic experiments; C. Pfrang, E. Mikhailov, T. Huthwelker, K. Binder and W. Schirmacher, J. Crowley, and T. Hoffmann for stimulating discussions. M.S. acknowledges support from the Max Planck Graduate Center—Johannes Gutenberg University Mainz, the Ministry of Education, Culture, Sports, Science and Technology—Japan (MEXT), and the University of Tokyo. This work was funded by the Max Planck Society (MPG), Swiss National Foundation (Grant no. 130175), and the European integrated project on cloud climate and air quality interactions (No 036833-2 EUCAARI).
Footnotes
The authors declare no conflict of interest.
*This Direct Submission article had a prearranged editor.
This article contains supporting information online at www.pnas.org/lookup/suppl/doi:10.1073/pnas.1103045108/-/DCSupplemental.
References
- 1.Pöschl U. Atmospheric aerosols: Composition, transformation, climate and health effects. Angew Chem-Int Edit. 2005;44:7520–7540. doi: 10.1002/anie.200501122. [DOI] [PubMed] [Google Scholar]
- 2.IPCC. Climate Change 2007: The Physical Science Basis. Contribution of Working Group 1 to the 4th Assessment Report of the IPCC. Cambridge, United Kingdom: Cambridge University Press; 2007. [Google Scholar]
- 3.Finlayson-Pitts BJ. Atmospheric chemistry. Proc Natl Acad Sci USA. 2010;107:6566–6567. doi: 10.1073/pnas.1003038107. [DOI] [PMC free article] [PubMed] [Google Scholar]
- 4.Andreae MO, Rosenfeld D. Aerosol-cloud-precipitation interactions. Part 1. The nature and sources of cloud-active aerosols. Earth-Sci Rev. 2008;89:13–41. [Google Scholar]
- 5.Fuzzi S, et al. Critical assessment of the current state of scientific knowledge, terminology, and research needs concerning the role of organic aerosols in the atmosphere, climate, and global change. Atmos Chem Phys. 2006;6:2017–2038. [Google Scholar]
- 6.Ammann M, et al. Heterogeneous production of nitrous acid on soot in polluted air masses. Nature. 1998;395:157–160. [Google Scholar]
- 7.Monge ME, et al. Light changes the atmospheric reactivity of soot. Proc Natl Acad Sci USA. 2010;107:6605–6609. doi: 10.1073/pnas.0908341107. [DOI] [PMC free article] [PubMed] [Google Scholar]
- 8.Pöschl U, et al. Rainforest aerosols as biogenic nuclei of clouds and precipitation in the Amazon. Science. 2010;329:1513–1516. doi: 10.1126/science.1191056. [DOI] [PubMed] [Google Scholar]
- 9.Rudich Y. Laboratory perspectives on the chemical transformations of organic matter in atmospheric particles. Chem Rev. 2003;103:5097–5124. doi: 10.1021/cr020508f. [DOI] [PubMed] [Google Scholar]
- 10.Wiedensohler A, et al. Rapid aerosol particle growth and increase of cloud condensation nucleus activity by secondary aerosol formation and condensation: a case study for regional air pollution in northeastern China. J Geophys Res-Atmos. 2009;114:D00G08. [Google Scholar]
- 11.Shiraiwa M, et al. Radiative impact of mixing state of black carbon aerosol in Asian outflow. J Geophys Res-Atmos. 2008;113:D24210. [Google Scholar]
- 12.Shiraiwa M, et al. The role of long-lived reactive oxygen intermediates in the reaction of ozone with aerosol particles. Nature Chemistry. 2011;3:291–295. doi: 10.1038/nchem.988. [DOI] [PubMed] [Google Scholar]
- 13.Enami S, Hoffmann MR, Colussi AJ. Acidity enhances the formation of a persistent ozonide at aqueous ascorbate/ozone gas interfaces. Proc Natl Acad Sci USA. 2008;105:7365–7369. doi: 10.1073/pnas.0710791105. [DOI] [PMC free article] [PubMed] [Google Scholar]
- 14.Hanson DR. Surface-specific reactions on liquids. J Phys Chem B. 1997;101:4998–5001. [Google Scholar]
- 15.Schwartz SE, Freiberg JE. Mass-transport limitation to the rate of reaction of gases in liquid droplets—Application to oxidation of SO2 in aqueous-solutions. Atmos Environ. 1981;15:1129–1144. [Google Scholar]
- 16.Smith GD, Woods E, Baer T, Miller RE. Aerosol uptake described by numerical solution of the diffusion—Reaction equations in the particle. J Phys Chem A. 2003;107:9582–9587. [Google Scholar]
- 17.Ammann M, Pöschl U. Kinetic model framework for aerosol and cloud surface chemistry and gas-particle interactions—Part 2: exemplary practical applications and numerical simulations. Atmos Chem Phys. 2007;7:6025–6045. [Google Scholar]
- 18.Jimenez JL, et al. Evolution of organic aerosols in the atmosphere. Science. 2009;326:1525–1529. doi: 10.1126/science.1180353. [DOI] [PubMed] [Google Scholar]
- 19.Maria SF, Russell LM, Gilles MK, Myneni SCB. Organic aerosol growth mechanisms and their climate-forcing implications. Science. 2004;306:1921–1924. doi: 10.1126/science.1103491. [DOI] [PubMed] [Google Scholar]
- 20.Kroll JH, et al. Carbon oxidation state as a metric for describing the chemistry of atmospheric organic aerosol. Nature Chemistry. 2011;3:133–139. doi: 10.1038/nchem.948. [DOI] [PubMed] [Google Scholar]
- 21.Martin ST. Phase transitions of aqueous atmospheric particles. Chem Rev. 2000;100:3403–3453. doi: 10.1021/cr990034t. [DOI] [PubMed] [Google Scholar]
- 22.Marcolli C, Luo BP, Peter T. Mixing of the organic aerosol fractions: liquids as the thermodynamically stable phases. J Phys Chem A. 2004;108:2216–2224. [Google Scholar]
- 23.Andreae MO, Gelencser A. Black carbon or brown carbon? The nature of light-absorbing carbonaceous aerosols. Atmos Chem Phys. 2006;6:3131–3148. [Google Scholar]
- 24.Shiraiwa M, Garland RM, Pöschl U. Kinetic double-layer model of aerosol surface chemistry and gas-particle interactions (K2-SURF): degradation of polycyclic aromatic hydrocarbons exposed to O3, NO2, H2O, OH and NO3. Atmos Chem Phys. 2009;9:9571–9586. [Google Scholar]
- 25.Sadezky A, Muckenhuber H, Grothe H, Niessner R, Pöschl U. Raman microspectroscopy of soot and related carbonaceous materials: spectral analysis and structural information. Carbon. 2005;43:1731–1742. [Google Scholar]
- 26.Hallquist M, et al. The formation, properties and impact of secondary organic aerosol: current and emerging issues. Atmos Chem Phys. 2009;9:5155–5235. [Google Scholar]
- 27.Kanakidou M, et al. Organic aerosol and global climate modelling: a review. Atmos Chem Phys. 2005;5:1053–1123. [Google Scholar]
- 28.Pankow JF. An absorption-model of the gas aerosol partitioning involved in the formation of secondary organic aerosol. Atmos Environ. 1994;28:189–193. [Google Scholar]
- 29.Virtanen A, et al. An amorphous solid state of biogenic secondary organic aerosol particles. Nature. 2010;467:824–827. doi: 10.1038/nature09455. [DOI] [PubMed] [Google Scholar]
- 30.Kalberer M, et al. Identification of polymers as major components of atmospheric organic aerosols. Science. 2004;303:1659–1662. doi: 10.1126/science.1092185. [DOI] [PubMed] [Google Scholar]
- 31.Russell LM, Bahadur R, Ziemann PJ. Identifying organic aerosol sources by comparing functional group composition in chamber and atmospheric particles. Proc Natl Acad Sci USA. 2011;108:3516–3521. doi: 10.1073/pnas.1006461108. [DOI] [PMC free article] [PubMed] [Google Scholar]
- 32.Mikhailov E, Vlasenko S, Martin ST, Koop T, Pöschl U. Amorphous and crystalline aerosol particles interacting with water vapor: conceptual framework and experimental evidence for restructuring, phase transitions and kinetic limitations. Atmos Chem Phys. 2009;9:9491–9522. [Google Scholar]
- 33.Zobrist B, Marcolli C, Pedernera DA, Koop T. Do atmospheric aerosols form glasses? Atmos Chem Phys. 2008;8:5221–5244. [Google Scholar]
- 34.Murray BJ. Inhibition of ice crystallization in highly viscous aqueous organic acid droplets. Atmos Chem Phys. 2008;8:5423–5433. [Google Scholar]
- 35.Angell CA. Formation of glasses from liquids and biopolymers. Science. 1995;267:1924–1935. doi: 10.1126/science.267.5206.1924. [DOI] [PubMed] [Google Scholar]
- 36.Hecksher T, Nielsen AI, Olsen NB, Dyre JC. Little evidence for dynamic divergences in ultraviscous molecular liquids. Nat Phys. 2008;4:737–741. [Google Scholar]
- 37.Bird RB, Stewart WE, Lightfoot EN. Transport Phenomena . (2nd Ed) New York: John Wiley & Sons, Inc; 2007. [Google Scholar]
- 38.Huthwelker T, Ammann M, Peter T. The uptake of acidic gases on ice. Chem Rev. 2006;106:1375–1444. doi: 10.1021/cr020506v. [DOI] [PubMed] [Google Scholar]
- 39.Parker R, Ring SG. Diffusion in maltose-water mixtures at temperatures close to the glass-tranition. Carbohydr Res. 1995;273:147–155. doi: 10.1016/s0008-6215(00)00203-2. [DOI] [PubMed] [Google Scholar]
- 40.Johnson PN, Davis RA. Diffusivity of ozone in Wwater. J Chem Eng Data. 1996;41:1485–1487. [Google Scholar]
- 41.Seinfeld JH, Pandis SN. Atmospheric chemistry and physics—From air pollution to climate change. New York: John Wiley & Sons, Inc; 1998. [Google Scholar]
- 42.Shiraiwa M, Pfrang C, Pöschl U. Kinetic multi-layer model of aerosol surface and bulk chemistry (KM-SUB): the influence of interfacial transport and bulk diffusion on the oxidation of oleic acid by ozone. Atmos Chem Phys. 2010;10:3673–3691. [Google Scholar]
- 43.Zobrist B, et al. Ultra-slow water diffusion in aqueous sucrose glasses. Phys Chem Chem Phys. 2011;13:3514–3526. doi: 10.1039/c0cp01273d. [DOI] [PubMed] [Google Scholar]
- 44.Tong HJ, Reid JP, Bones DL, Luo BP, Krieger UK. Measurements of the timescales for the mass transfer of water in glassy aerosol at low relative humidity and ambient temperature. Atmos Chem Phys. 2011;11:4739–4754. doi: 10.5194/acp-11-4739-2011. [Google Scholar]
- 45.Hottot A, Daoussi R, Andrieu J. Thermophysical properties of aqueous and frozen states of BSA/water/Tris systems. Int J Biol Macromol. 2006;38:225–231. doi: 10.1016/j.ijbiomac.2006.02.022. [DOI] [PubMed] [Google Scholar]
- 46.Brownsey GJ, Noel TR, Parker R, Ring SG. The glass transition behavior of the globular protein bovine serum albumin. Biophys J. 2003;85:3943–3950. doi: 10.1016/S0006-3495(03)74808-5. [DOI] [PMC free article] [PubMed] [Google Scholar]
- 47.Mikhailov E, Vlasenko S, Niessner R, Pöschl U. Interaction of aerosol particles composed of protein and salts with water vapor: hygroscopic growth and microstructural rearrangement. Atmos Chem Phys. 2004;4:323–350. [Google Scholar]
- 48.Murata T, Lee MS, Tanioka A. An application of percolation theory to the electrolyte penetration through porous water-swollen cellulose triacetate membrane. J Colloid Interface Sci. 1999;220:250–254. doi: 10.1006/jcis.1999.6529. [DOI] [PubMed] [Google Scholar]
- 49.Shante VKS, Kirkpatrick S. Introduction to percolation theory. Adv Phys. 1971;20:325–357. [Google Scholar]
- 50.Worsnop DR, Morris JW, Shi Q, Davidovits P, Kolb CE. A chemical kinetic model for reactive transformations of aerosol particles. Geophys Res Lett. 2002;29:57-1–57-4. [Google Scholar]
- 51.Finlayson-Pitts BJ, Pitts JN, editors. Chemistry of the upper and lower atmosphere. San Diego, CA: Academic Press; 2000. [Google Scholar]
- 52.Pfrang C, Shiraiwa M, Pöschl U. Coupling aerosol surface and bulk chemistry with a kinetic double layer model (K2-SUB): an exemplary study of the oxidation of oleic acid by ozone. Atmos Chem Phys. 2010;10:4357–4557. [Google Scholar]
- 53.Pöschl U, Rudich Y, Ammann M. Kinetic model framework for aerosol and cloud surface chemistry and gas-particle interactions—Part 1: General equations, parameters, and terminology. Atmos Chem Phys. 2007;7:5989–6023. [Google Scholar]
- 54.Kolb CE, et al. An overview of current issues in the uptake of atmospheric trace gases by aerosols and clouds. Atmos Chem Phys. 2010;10:10561–10605. [Google Scholar]
- 55.Huthwelker T, Peter T. Analytical description of gas transport across an interface with coupled diffusion in two phases. J Chem Phys. 1996;105:1661–1667. [Google Scholar]
- 56.Danckwerts PV. Absorption by simultaneous diffusion and chemical reaction into particles of various shapes and into falling drops. T Faraday Soc. 1951;47:1014–1023. [Google Scholar]
- 57.Livingston FE, Smith JA, George SM. General trends for bulk diffusion in ice and surface diffusion on ice. J Phys Chem A. 2002;106:6309–6318. [Google Scholar]
- 58.George IJ, Abbatt JPD. Heterogeneous oxidation of atmospheric aerosol particles by gas-phase radicals. Nature Chemistry. 2010;2:713–722. doi: 10.1038/nchem.806. [DOI] [PubMed] [Google Scholar]
- 59.Xiao S, Bertram AK. Reactive uptake kinetics of NO3 on multicomponent and multiphase organic mixtures containing unsaturated and saturated organics. Phys Chem Chem Phys. 2011;13:6628–6636. doi: 10.1039/c0cp02682d. [DOI] [PubMed] [Google Scholar]
- 60.Knopf DA, Anthony LM, Bertram AK. Reactive uptake of O3 by multicomponent and multiphase mixtures containing oleic acid. J Phys Chem A. 2005;109:5579–5589. doi: 10.1021/jp0512513. [DOI] [PubMed] [Google Scholar]
- 61.Zahardis J, Petrucci GA. The oleic acid-ozone heterogeneous reaction system: products, kinetics, secondary chemistry, and atmospheric implications of a model system—a review. Atmos Chem Phys. 2007;7:1237–1274. [Google Scholar]
- 62.Donahue NM, Robinson AL, Stanier CO, Pandis SN. Coupled partitioning, dilution, and chemical aging of semivolatile organics. Environ Sci Technol. 2006;40(8):02635–02643. doi: 10.1021/es052297c. [DOI] [PubMed] [Google Scholar]
- 63.Robinson AL, et al. Rethinking organic aerosols: semivolatile emissions and photochemical aging. Science. 2007;315:1259–1262. doi: 10.1126/science.1133061. [DOI] [PubMed] [Google Scholar]
- 64.Zuend A, Marcolli C, Peter T, Seinfeld JH. Computation of liquid-liquid equilibria and phase stabilities: implications for RH-dependent gas/particle partitioning of organic-inorganic aerosols. Atmos Chem Phys. 2010;10:7795–7820. [Google Scholar]
- 65.Vaden TD, Imre D, Beranek J, Shrivastava M, Zelenyuk A. Evaporation kinetics and phase of laboratory and ambient secondary organic aerosol. Proc Natl Acad Sci USA. 2011;108:2190–2195. doi: 10.1073/pnas.1013391108. [DOI] [PMC free article] [PubMed] [Google Scholar]
- 66.Snider JR, et al. Intercomparison of cloud condensation nuclei and hygroscopic fraction measurements: coated soot particles investigated during the LACIS Experiment in November (LExNo) J Geophys Res-Atmos. 2010;115:D11205. [Google Scholar]
- 67.Barahona D, Rodriguez J, Nenes A. Sensitivity of the global distribution of cirrus ice crystal concentration to heterogeneous freezing. J Geophys Res-Atmos. 2010;115:D23213. [Google Scholar]
- 68.Pöschl U. Gas-particle interactions of tropospheric aerosols: kinetic and thermodynamic perspectives of multiphase chemical reactions, amorphous organic substances, and the activation of cloud condensation nuclei. Atmos Res. 2011 doi: 10.1016/j.atmosres.2010.12.12.018. [Google Scholar]
- 69.Murray BJ, et al. Heterogeneous nucleation of ice particles on glassy aerosols under cirrus conditions. Nature Geoscience. 2010;3:233–237. [Google Scholar]
- 70.Cooney DO, Kim SS, Davis EJ. Analyses of mass-transfer in hemodialyzers for laminar blood-flow and homogeneous dialysate. Chem Eng Sci. 1974;29:1731–1738. [Google Scholar]
- 71.Ammann M, Rossler E, Strekowski R, George C. Nitrogen dioxide multiphase chemistry: uptake kinetics on aqueous solutions containing phenolic compounds. Phys Chem Chem Phys. 2005;7:2513–2518. doi: 10.1039/b501808k. [DOI] [PubMed] [Google Scholar]
Associated Data
This section collects any data citations, data availability statements, or supplementary materials included in this article.