Abstract
Transformation of normal cloned rat embryo fibroblast (CREF) cells with cellular oncogenes results in acquisition of anchorage-independent growth and oncogenic potential in nude mice. These cellular changes correlate with an induction in the expression of a cancer progression-promoting gene, progression elevated gene-3 (PEG-3). To define the mechanism of activation of PEG-3 as a function of transformation by the Ha-ras and v-raf oncogenes, evaluations of the signaling and transcriptional regulation of the ~2.0 kb promoter region of the PEG-3 gene, PEG-Prom, was undertaken. The full-length and various mutated regions of the PEG-Prom were linked to a luciferase reporter construct and tested for promoter activity in CREF and oncogene-transformed CREF cells. An analysis was also performed using CREF cells doubly transformed with Ha-ras and the Ha-ras specific suppressor gene Krev-1, which inhibits the transformed phenotype in vitro. These assays document an association between expression of the transcription regulator PEA3 and PEG-3. The levels of PEA3 and PEG-3 RNA and proteins are elevated in the oncogenically transformed CREF cells, and reduced in transformation and tumorigenic suppressed Ha-ras/Krev-1 doubly transformed CREF cells. Enhanced tumorigenic behavior, PEG-3 promoter function and PEG-3 expression in Ha-ras transformed cells were all dependent upon increased activity within the mitogen-activated protein kinase (MAPK) pathway. Electrophoretic mobility shift assays and DNase I footprinting experiments indicate that PEA3 binds to sites within the PEG-Prom in transformed rodent cells in an area adjacent to the TATA box in a MAPK-dependent fashion. These findings demonstrate an association between Ha-ras and v-raf transformation of CREF cells with elevated PEA3 and PEG-3 expression, and they implicate MAPK signaling via PEA3 as a signaling cascade involved in activation of the PEG-Prom.
INTRODUCTION
Although intensively scrutinized, the molecular determinants of cancer development and progression for the vast majority of neoplastic diseases remain ill-defined (1–5). To identify, clone and characterize genes regulated during cancer progression, we have employed a Sprague–Dawley rat embryo cell culture model system transformed by a temperature sensitive mutant of type 5 adenovirus, H5ts125 (6–10), in combination with various molecular cloning strategies, including subtraction hybridization (11) and reciprocal subtraction differential RNA display (12). In the H5ts125-RE transformation model, immortal morphologically transformed RE cells temporally develop new and qualitatively distinct properties, changes that can be accelerated by selection for enhanced aggressiveness in vivo in nude mice or by ectopic expression of various oncogenes, including Ha-ras, v-src, v-raf and HPV-18 transforming genes (6–11). Subtraction hybridization between a highly progressed nude mouse tumor-derived H5ts125-transformed clone, E11-NMT, and its unselected non-aggressive H5ts125 parental clone, E11, resulted in the identification and cloning of progression elevated gene-3 (PEG-3) (11). PEG-3 expression directly correlates with expression of the progression phenotype in a series of progressed and progression-suppressed rodent cell clones, including azacytidine-treated and oncogenically transformed somatic cell hybrids, (11). When ectopically expressed in E11 cells, PEG-3 induces an aggressive oncogenic phenotype, which correlates with induction of elevated expression of vascular endothelial growth factor (VEGF), a major determinant of new blood vessel formation (angiogenesis) (13). Similarly, inhibition of PEG-3 using an antisense strategy in progressed E11-NMT cells results in a reversion in properties to that of the unprogressed E11 parental cells, including suppression in agar growth, increase in tumor latency time (decreased tumor aggressiveness) and suppression in VEGF expression and angiogenesis (13). These observations suggest that PEG-3 is both associated with and casually related to development of an aggressive cancer phenotype and the induction of angiogenesis in this rodent progression model system.
To investigate the genetic changes associated with and potentially mediating cancer progression, a second model system has been developed which uses a specific clone of normal immortal cloned rat embryo fibroblast (CREF) cells (14). CREF cells manifest properties of untransformed RE cells, i.e. they are contact inhibited, they do not form colonies in agar and they lack tumorigenic potential when injected into athymic nude mice or syngeneic Fischer rats (14,15). Moreover, CREF cells are very sensitive to transformation to an oncogenic state by mechanistically diverse acting cellular and viral oncogenes, including Ha-ras, v-src, v-raf, HPV-18 and a specific temperature sensitive mutant of type 5 adenovirus (H5hr1) (15–19). In the case of Ha-ras transformed CREF cells, coexpression of the Krev-1 gene, which inhibits Ha-ras post-translationally, results in suppression of transformation, as indicated by a reversion of transformed cells to a normal CREF-like morphology and inhibition in tumor formation in nude mice (18). However, with extended time in animals, CREF cells expressing both the Ha-ras and Krev-1 gene escape transformation suppression and both tumors and metastases develop in nude mice (18).
Previous studies document that expression, based on northern blotting, of the PEG-3 gene is elevated in CREF cells as a function of oncogenic transformation (11). Expression directly correlates with the transformed state, since Ha-ras + Krev-1 transformed CREF clones that are suppressed in transformation display reduced PEG-3 expression, whereas tumors and metastases developing from transformed cells that have escaped suppression re-express PEG-3. Since increased transcription of the PEG-3 gene is apparent in Ha-ras transformed CREF cells (11), it would appear that the promoter region of PEG-3 might contain elements that facilitate transcription of PEG-3 in transformed CREF cells. To test this hypothesis and define the region(s) of the PEG-Prom involved in enhanced expression of PEG-3 in Ha-ras and v-raf transformed CREF cells we have analyzed the PEG-Prom (20–24). Expression of oncogenic forms of Ras and Raf in CREF cells activated the classical mitogen-activated protein kinase (MAPK) pathway, which correlated with enhanced colony-forming ability in soft agar growth assays and increased DNA binding of the transcription factor PEA3 to a consensus sequence derived from the PEG-Prom. Furthermore, promoter deletion studies also implicated PEA3 sites within the PEG-Prom as potential targets involved in the induction of PEG-3 expression in oncogene-transformed CREF cells. Collectively, these data argue that signaling through the Ras/Raf/MAPK/PEA3 signaling module enhances PEG-3 expression in CREF cells leading to enhanced proliferative potential.
MATERIALS AND METHODS
Cell cultures and agar growth assays
CREF cells are a specific clone of Fischer F2408 cells (14). CREF-ras is a cloned Ha-ras transformed CREF cell line (18). CREF-ras/Krev-1 (clone B1) cells were obtained by co-transfecting, using previously described techniques (18), CREF-ras cells with 20 µg of plasmid DNA containing the Krev-1 gene (18) and 5 µg of plasmid DNA containing a cloned bacterial hygromycin resistance gene (pRSV1.1) (25,26) and selecting cells resistant to 100 µg/ml hygromycin. CREF-ras/Krev-1 B1TD and B1M are tumor-derived and lung metastasis-derived cell lines, respectively, re-established in culture after subcutaneously injecting the CREF-ras B1 cell line into a nude mouse. CREF cells transformed by v-raf and v-src were obtained by transfecting CREF cells with the v-raf oncogene (27) and isolating morphologically transformed foci. All cell lines were grown at 37°C in a 95:5% air:carbon dioxide humidified incubator in Dulbecco’s modified Eagle’s medium (DMEM) supplemented with 5% fetal bovine serum (DMEM-5). Anchorage-independent growth assays were performed as described previously by seeding a variable number of cells in 0.4% Noble agar-containing medium on a base layer of 0.8% Noble agar-containing medium (6–8,11).
Northern and western blotting assays
Total cellular RNA was isolated by the guanidinium/phenol extraction method and northern blotting was performed as described (11). Fifteen micrograms of RNA were denatured and electrophoresed in 1.2% agarose gels with 3% formaldehyde, transferred to nylon membranes and hybridized with 32P-labeled cDNA probes as described previously (11). Following hybridization, the filters were washed and exposed for autoradiography. Western blotting analyses (20,28) detected PEA3, PEG-3 and actin proteins. Five million cells were seeded into 100 mm plates and incubated for 24 h at 37°C. The medium (DMEM-5) was removed, the cells were washed three times with cold PBS and then lysed in RIPC buffer (0.5 M NaCl, 0.5% NP-40, 20 mM Tris–HCl pH 8, 1 mM PMSF). The protein levels were determined using an ECL kit (Amersham) and the respective antibodies (Santa Cruz). PEA3-Ab (16) (sc-113 and sc-113X) is specific for PEA3-encoded p60 and is non-cross-reactive with other members of the ets gene family. PEA3-Ab reacts with mouse, rat and human PEA3. Actin-Ab (C-11) (sc-1615) reacts with an actin epitope corresponding to an amino acid sequence mapping at the C-terminus of actin of human origin (identical to the corresponding mouse and rat sequence). PEG-3-Ab (S-17) (sc-7243) is a goat polyclonal antibody generated using peptides corresponding to the C-terminus of PEG-3, mouse and rat reactive. Cell lysates were also analyzed using rabbit anti-PEG-3 polyclonal antibodies produced against C-terminal peptides.
Analysis of the full-length and 5′ deletion mutations in the PEG-promoter
Based on the 5′ sequence of the PEG-3 cDNA, a full-length PEG-3 promoter (FL-PEG-Prom) was generated by genomic walking using two nested primers as previously described (20). 5′ Deletion mutations in the FL-PEG-Prom were made with exonuclease III digestion using the Erase-A-Base System (Promega). The putative 2.0 kb FL-PEG-Prom and the various 5′ deletion mutants of the PEG-Prom were cloned into the pGL3-basic Vector (Promega) for promoter activity analysis. To evaluate the activity of the various PEG-Prom-luciferase constructs, cells were seeded at 2 × 10⁵/35 mm tissue culture plate and ∼24 h later transfected with 5 µg of the various PEG-Prom-luciferase constructs plus 1 µg of SV40-β-gal vector (Promega) mixed with 10 µl of lipofectamine reagent (Gibco) in 200 µl of serum-free medium. After 20 min at room temperature, 800 µl of serum-free medium was added, resulting in a final volume of 1 ml. The transfection mixture was removed after 6 h and the cells were washed three times with serum-free medium and incubated at 37°C for an additional 48 h in complete growth medium. Cells were harvested and lysed to make extracts (29) utilized in β-gal and luciferase reporter assays. Luminometric determinations of luciferase to β-gal activity were performed using commercial kits (Promega and Tropix, respectively). For luciferase assays, 10 µl of the cell lysate was mixed with 50 µl of luciferase assay substrate (Promega). For the β-gal assay, 10 µl of the cell lysate was mixed with 100 µl of diluted Galecton-Plus with 150 µl of Accelerator (Tropix). Promoter analysis data were collected a minimum of three times using triplicate samples for each experimental point and the data were standardized with the β-gal data. Results are presented as fold activation ± SD, with basal promoter activity (5′ deletion mutant at position –42) representing 1.
Electrophoretic mobility shift assay (EMSA) and DNase I footprinting assay
Nuclear extracts were prepared from 2–5 × 10⁸ cells as described by Dignam et al. (30). The probe sequences were as follows: wild-type PEA3, 5′-GTGTTGTTTTCCTCTCTCCA-3′/3′-CACAACAAAAGGAGAGAGGT-5′; mutant PEA3, 5′-GTGTTGTTCCCATCTCTCCA-3′/3′-CACAACAAGGGTAGAGAGGT-5′; wild-type Sp1, 5′-GGGGATGGGGCGGCCTTTGG-3′/3′-CCAAAGGCCGCCCCATCCCC-5′. The double-stranded oligonucleotides were labeled with [γ-32P]ATP (Amersham) and T4 polynucleotide kinase. The labeled probes were then incubated with nuclear extract at room temperature for 30 min. The reaction mixture consisted of 32P-labeled deoxyoligonucleotides (≥50 000 c.p.m.), 2 µg of poly(dI–dC) and 10 µg of nuclear protein extract with 10 mM HEPES pH 7.5, 50 mM KCl, 5 mM MgCl2, 0.5 mM EDTA, 1 mM DTT and 12.5% glycerol. After incubation for 30 min at room temperature, the reaction mixtures were electrophoresed on a 5% non-denaturing polyacrylamide gel with 0.5× TBE (160 V for 3 h). The gel was dried and autoradiographed. Nuclear extracts were also incubated with a 100-fold molar excess of cold Sp1 competitor and 5-, 25- and 125-fold molar excess of cold PEA3 competitor together with the 32P-labeled probe. Supershift assays were performed by incubating nuclear extracts with PEA3 (sc-113X) or actin (sc-1615) antibody (2 or 10 µg) together with 32P-labeled probe for 30 min at room temperature. The reaction mixtures were then electrophoresed and processed as described above.
For DNase I footprinting, a 297 bp DNA fragment (+137 to –160) of the PEG-3 promoter was obtained by PCR using the primers (–160) 5′-GGAAGCCACGGTGACCTC-3′ and 3′-GTCGGACTCGAGCTGTACTTG-5′ (+137). This fragment was labeled with T4 DNA kinase and [γ-32P]ATP (6000 Ci/mmol; Amersham). To produce a single end-labeled probe, the 297 bp fragment was digested with SacI and purified from an agarose gel. The final probe consisted of a fragment of 287 bp (+127 to –160) with position –160 32P-end-labeled (the PEA3 DNA element was located at –100 to –105) and was used for footprinting assays as described (31). A DNA marker was prepared by the dideoxy sequencing method using the PEA3 promoter as a template and the primer (–180) 5′-TTGAGCCAAGGACACGCCTG-3′ (–161). Reaction products were resolved on a 6% acrylamide sequencing gel and detected by autoradiography after drying.
Cell homogenization for MAPK assays
Cells were cultured, in the presence of serum, as above. Media was aspirated and cells snap frozen on dry ice and stored at –70°C. Cells were homogenized in 1 ml ice-cold buffer A [25 mM HEPES pH 7.4 at 4°C, 5 mM EDTA, 5 mM EGTA, 5 mM benzamidine, 1 mM PMSF, 1 mg/ml soybean trypsin inhibitor, 40 µg/ml pepstatin A, 1 µM Microcystin-LR, 0.5 mM sodium orthovanadate, 0.5 mM sodium pyrophosphate, 0.05% (w/v) sodium deoxycholate, 1% (v/v) Triton X-100, 0.1% (v/v) 2-mercaptoethanol], with trituration using a P1000 pipette to lyse the cells. Homogenates were stored on ice prior to clarification by centrifugation (4°C).
Immune complex MAPK activity assays
Agarose pre-conjugated anti-MAPK antibodies (Santa Cruz SC-154AC), 10 µl of slurry (4 µg antibody) was used to immunoprecipitate MAPK. Clarified equal aliquots of lysates (0.25 ml, ∼100 µg total protein) were mixed with antibodies in duplicate using gentle agitation (2.5 h, 4°C). Agarose–antibody–antigen complexes were recovered by centrifugation, the supernatant discarded, and the recovered fraction was washed for 10 min with 0.5 ml buffer A (twice), PBS and buffer B [25 mM HEPES pH 7.4, 0.1 mM Na3VO4]. To perform activity assays, immunoprecipitates were incubated (final volume 50 µl) with 50 µl of buffer B containing 0.2 mM [γ-32P]ATP (5000 c.p.m./pmol), 1 µM Microcystin-LR, 0.5 mg/ml myelin basic protein (MBP), which initiated reactions at time = 0. After 20 min, 40 µl of the reaction mixtures were spotted onto a 2 cm circle of P81 paper (Whatman, Maidstone, UK) and immediately placed into 180 mM phosphoric acid. Papers were washed four times (10 min each) with phosphoric acid and once with acetone, and 32P-incorporation into MBP was quantified by liquid scintillation spectroscopy.
Generation of a recombinant adenovirus and infection protocol
A plasmid containing ΔB-Raf:ER was kindly provided by Dr M.McMahon (University of California, San Francisco). The ΔB-Raf:ER recombinant adenovirus was generated using a novel methodology in bacteria. In this procedure, the full-length recombinant adenovirus genome is cloned in a plasmid, flanked by a rare cutter (PacI) restriction site and is generated using a recombination proficient Escherichia coli strain (BJ5183) with the genotype recBC sbcBC. ΔB-Raf:ER was excised from its original construct and transferred into a shuttle vector used to generate the recombinant adenovirus, as described in Auer et al. (32). Plaques were isolated, the virus from each expanded and protein expression of ΔB-Raf:ER determined by western blotting. The concentration of the recombinant adenovirus was assessed on the basis of the absorbency at 260 nm and on a limiting dilution plaque assay. Recombinant adenoviruses are stored in small portions (∼1 ml) at –80°C. A reduction in titer is observed after more than one freeze–thaw cycle. Prior to infection, cell number was determined. For infection, cells were incubated in a minimal volume of serum-free medium for the plate size, e.g. 3 ml for a 100 mm dish. To this medium, the appropriate amount of recombinant adenovirus was added to give the required multiplicity of infection. Cells were gently rocked for 4 h at 37°C in an incubator. At this time, the medium can either be replaced with serum-containing medium, or the original medium diluted with medium containing 2× serum.
RESULTS
Activation of MAPK in rat embryo cells by oncogenes
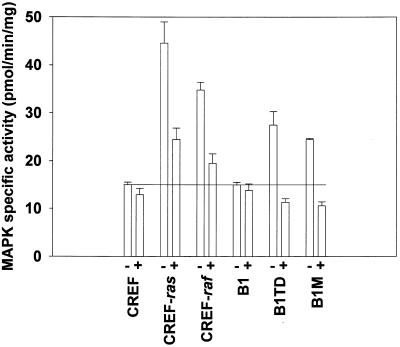
Transformation of cells with either v-ras or v-raf has been shown to activate the classical MAPK pathway in many cell types (33,34). Experiments were performed to determine MAPK-specific activity in CREF and the oncogene-transformed cell lines (Fig. 1). Expression of either v-ras or v-raf increased MAPK specific activity ∼3- and ∼2-fold, respectively, in CREF cells. The ability of v-ras to enhance MAPK activity was abolished in B1 cells, which express the negative regulator of Ha-ras, Krev-1 (18). Of note, in the tumorigenic revertant CREF cells expressing Krev-1, B1TD and B1M cells, basal MAPK activity was elevated compared to either parental CREF or B1 cells. Collectively, this data demonstrates that expression of either v-ras or v-raf enhances MAPK activity in CREF cells.
Figure 1.
Treatment of CREF cells with PD98059 reduces MAPK activity in CREF and various transformed CREF cells. Cells were treated with either vehicle control (VEH, DMSO) or 50 µM PD98059 for 6 h, washed with PBS and frozen. Cultures were lysed and prepared for immune complex kinase assays to determine MAPK activity, as described in Materials and Methods. Data are the means of three separate experiments ± SEM. Cell types: CREF, untransformed cloned rat embryo fibroblast cell line; CREF-raf, v-raf transformed CREF clonal cell line; CREF-ras, Ha-ras transformed CREF clonal cell line; B1, Ha-ras + Krev-1 transformed CREF clone; B1TD, nude mouse tumor-derived Ha-ras + Krev-1 transformed B1 CREF subclone; B1M, nude mouse metastasis-derived Ha-ras + Krev-1 transformed B1 CREF subclone.
Expression of PEG-3 and PEA3 is elevated as a consequence of oncogenic transformation of CREF cells
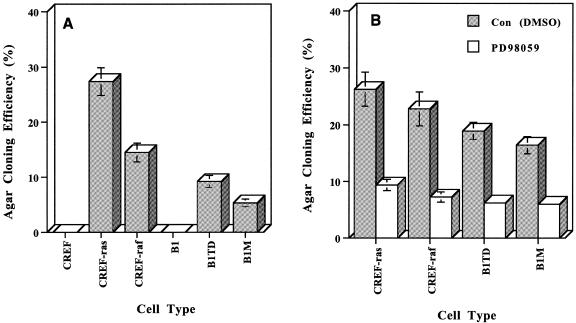
In addition to activating the MAPK pathway, transformation of CREF cells with the Ha-ras or v-raf oncogene results in morphological changes and acquisition of anchorage-independent growth and tumorigenic competence in nude mice (Fig. 2A) (16–19). Of particular note, the relative colony forming ability of each cell line is approximately proportional to the degree of MAPK activation above basal levels (compare Figs 1 and 2A), suggesting that MAPK signaling may play an important role in this process. In general agreement with this concept, inhibition of MAPK signaling was found to reduce anchorage-independent growth (Fig. 2B).
Figure 2.
2. Anchorage-independent growth and inhibition of anchorage-independent growth by inhibiting MAPK of CREF and various Ha-ras and v-raf transformed CREF cells. (A) Cells were seeded at densities ranging from 1 × 10⁴ to 1 × 10⁵ in 0.4% Noble agar on a 0.8% Noble agar base layer prepared in complete growth medium, fed with 0.4% Noble agar containing medium every 5 to 7 days and colonies >0.1 mm were enumerated after 21 days. (B) Cells were seeded as above in the presence of 0.05% DMSO (control) or 50 µM PD98059, added to the base and overlay layers and added every 5 to 7 days with complete growth medium to the overlay layer. Results represent the averages ± SD for triplicate plates, duplicate assays varied by ≤15%.
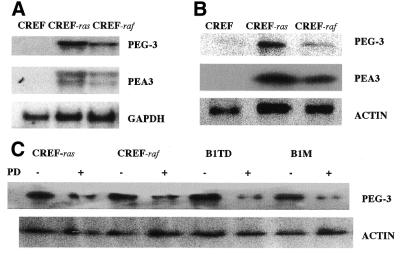
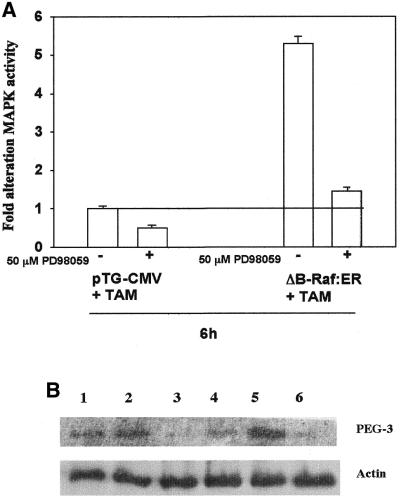
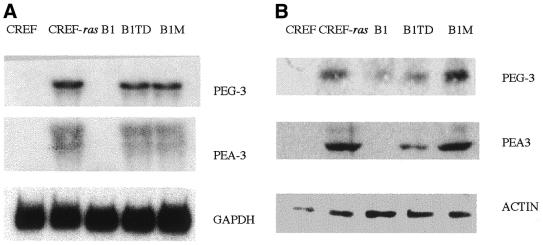
The oncogene-induced modifications in cellular phenotype correlated with an induction of PEG-3, as reflected by increases in mRNA and protein (Fig. 3A and B). In agreement with oncogenes activating MAPK (Fig. 1), inhibition of MAPK signaling reduced PEG-3 expression within 6 h (Fig. 3C). B1TD cells, expressing low levels of PEG-3, were infected with either a recombinant adenovirus to express a conditionally active form of B-Raf (ΔB-Raf:ER) or a control virus. Treatment of ΔB-Raf:ER infected B1TD cells with 4-hydroxytamoxifen (200 nM) enhanced MAPK activity within 6 h (Fig. 4A). MAPK activation increased PEG-3 protein levels, which was blocked by the MEK1/2 inhibitor PD98059 (Fig. 4B). These results indicate a correlation between MAPK activity and elevated expression of PEG-3 in oncogenically transformed CREF cells.
Figure 3.
PEG-3 and PEA3 mRNA and protein expression and the effect of inhibiting MAPK on PEG-3 protein in CREF, Ha-ras and v-raf transformed CREF cells. (A) PEG-3 mRNA levels were determined by electrophoresing 15 µg of total cellular RNA in a 1.2% agarose gel. RNA was transferred to nylon membranes and hybridized with a 32P-labeled PEG-3 cDNA probe, the blot was stripped and then rehybridized with a 32P-labeled PEA3 and then a GAPDH probe. The size of PEA3 mRNA is 2.4 kb, PEG-3 mRNA is 2.2 kb and GAPDH mRNA is 1.4 kb. (B) PEG-3, PEA3 and actin protein levels were determined by western blotting. Ten micrograms of protein from each cell type was loaded onto a 10% denatured polyacrylamide gel and electrophoresed for 3 h, followed by transfer onto a nitrocellulose membrane. Appropriately sized proteins, based on a prestained protein ladder (Ca. 10748-010; Gibco BRL), were detected using the respective antibodies, i.e. anti-PEG-3, anti-PEA3 or anti-actin. The sizes of the various proteins were 50 kDa for PEG-3, 60 kDa for PEA3 and 42 kDa for actin. (C) The effects of MAPK inhibition on PEG-3 and actin protein levels were determined by western blotting. Cells were treated with DMSO (–) (0.05% solvent control) or PD98059 (50 µM) for 6 h, harvested and prepared as above and evaluated by western blotting.
Figure 4.
Specific activation of MAPK by ΔB-Raf:ER increases expression of PEG-3. B1TD cells were infected with either a control recombinant adenovirus (CMV) or a recombinant adenovirus to express ΔB-Raf:ER. Twenty-four hours after infection, cells were treated with 200 nM 4-hydroxytamoxifen (TAM) and either vehicle control (VEH, DMSO) or 50 µM PD98059. Six hours after treatment, cells were washed with PBS and frozen. (A) Cells were lysed and prepared for immune complex kinase assays to determine MAPK activity, as described in Materials and Methods. Data are the means of three separate experiments ± SEM. (B) Cells were lysed in preparation for SDS–PAGE, followed by immunoblotting to determine PEG-3 protein expression levels. A representative experiment is shown n = 3. Lane 1, Ad.vec; lane 2, Ad.vec + TAM; lane 3, Ad.vec + TAM + PD98059; lane 4, Ad.ΔB-Raf:ER; lane 5, Ad.ΔB-Raf:ER + TAM; lane 6, Ad.ΔB-Raf:ER + TAM + PD98059.
Transformation of CREF cells by Ha-ras and v-raf also resulted in elevated expression of the transcription factor PEA3 (Fig. 3A and B). Experiments were performed to determine whether a direct relationship exists between the transformed state, PEG-3 expression and PEA3 expression. To achieve this objective we have used the Ha-ras/Krev-1 transformation progression model (18,19). In this model system, Ha-ras can convert CREF cells, which are contact inhibited, anchorage-dependent and non-tumorigenic, into morphologically transformed cells displaying anchorage independence and an aggressive oncogenic phenotype in vivo, characterized by both tumor formation and metastatic potential in athymic nude mice and syngeneic rats (18,19). Transformation of CREF cells with Ha-ras results in profound changes in the pattern of gene expression, including a decrease in expression of genes that normally suppress oncogenesis and an increase in the expression of genes that promote the cancer state (18,19). In Ha-ras transformed CREF cells, the ras-specific suppressor gene, Krev-1, causes a reversion in phenotype to that of parental CREF cells, which occurs at a post-translational level without altering Ha-ras transcription, steady-state mRNA or protein levels (18). Although suppression of the transformed phenotype by Krev-1 is stable when cells are maintained in vitro, subcutaneous injection of Ha-ras/Krev-1 clones into athymic nude mice results in the development of both tumors and lung metastases, albeit with greatly extended time frames versus parental Ha-ras transformed CREF cells (18). Tumors and lung metastases re-established in cell culture are morphologically transformed, grow in agar and form tumors more rapidly when re-injected into animals (Fig. 2) (18,19). In this system, the levels of PEG-3 and PEA3 mRNA and protein are reduced in transformation suppressed Ha-ras/Krev-1 transformed CREF cells, whereas expression is elevated in tumor- and metastasis-derived subclones (Fig. 5A and B). These studies demonstrate a direct correlation between PEG-3 and PEA3 expression and the transformed and oncogenic phenotype in CREF cells.
Figure 5.
PEG-3 and PEA3 mRNA and protein expression in CREF, CREF-ras, B1, B1TD and B1M cells. Experimental procedures were as described in the legend to Figure 3.
The PEG-3 promoter displays elevated expression in oncogenically transformed CREF cells
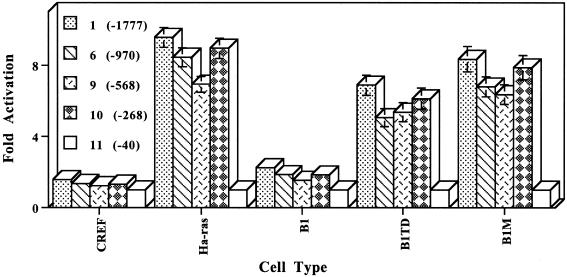
Nuclear run-on assays demonstrate that the PEG-3 gene is transcriptionally active in Ha-ras-transformed CREF cells, suggesting that a primary level of regulation of this gene may involve transcriptional activation (11). To explore this possibility we have analyzed the promoter region of PEG-3 to define potential elements involved in differential expression in oncogenically transformed versus normal CREF cells. Using a genomic walking approach from the 5′ region of the PEG-3 cDNA a 2.0 kb rat genomic fragment corresponding to the 5′ flanking region of the PEG-3 gene was isolated (Fig. 6) (20). Transfection of a full-length PEG-3 promoter luciferase construct (FL-PEG-Prom) into CREF and v-raf and Ha-ras transformed CREF cells demonstrated activity in the transformed cells, but minimal activity in the normal cells (Figs 6 and 7). A direct relationship between expression of the transformed and oncogenic phenotype and PEG-3 promoter activity was confirmed by analyzing the CREF-ras/Krev-1 series of transformed cells. The FL-PEG-Prom was transcriptionally active in CREF-ras, B1TD and B1M cells, with reduced activity in CREF and B1 cells (Fig. 7). These experiments indicate that oncogenic transformation of CREF, by the Ha-ras and v-raf oncogenes, correlates with transcriptional activation of the PEG-Prom.
Figure 6.
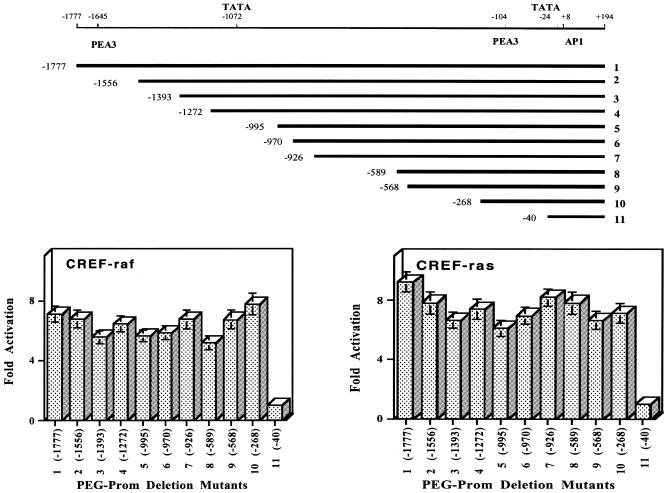
Mapping the regions of the PEG-3 promoter necessary for elevated PEG-Prom activity in Ha-ras and v-raf transformed CREF cells. Top, schematic representation of 5′ deletion mutants of the PEG-Prom. Mutants were constructed as described in Materials and Methods. Fold activation of the FL-PEG-Prom and various 5′ deletion mutants of PEG-Prom in v-raf (bottom left) and Ha-ras (bottom right) transformed CREF cells. The PEG-Prom deletion construct 11 (at position –40) containing the TATA box and AP1 element and displaying basal promoter activity was given the arbitrary value of 1.
Figure 7.
Expression of FL-PEG-Prom and various 5′ deletion Prom-Luc constructs in CREF, CREF-ras, B1, B1TD and B1M cells. Experimental details are as described in the legend to Figure 6. The various deletion mutants correspond to the numbers in the schematic presented in Figure 6: 1, FL-PEG-Prom; 6, 5′ deletion at position –970; 9, 5′ deletion at position –569; 10, 5′ deletion at position –268; and 11, 5′ deletion at position –40. Fold activation is in comparison with the number 11 deletion mutant (at position –40), which has minimal basal promoter activity.
Mapping the regions of the PEG-Prom involved in transcriptional activation of the PEG-3 gene in v-raf and Ha-ras transformed CREF cells
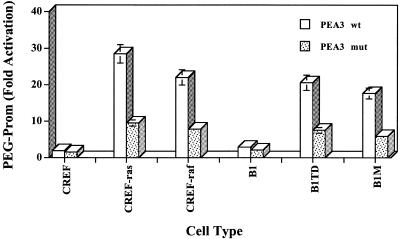
To determine which regions of the PEG-Prom are involved in the differential expression of PEG-3 in oncogenically transformed CREF cells, a series of PEG-Prom deletion constructs was prepared, cloned in front of the luciferase gene and evaluated for promoter activity (Figs 6 and 7). In the case of CREF-raf and CREF-ras cells a comparable pattern of expression of the various promoter deletion mutants was apparent (Fig. 6). Major deletions in the PEG-Prom, from positions –1777 to –268, only marginally affected promoter activity in CREF-raf [∼9% increase (mutant –268) to a maximum ∼27% decrease (mutant –589) in promoter activity] and CREF-ras cells [∼12 (mutant –926) to ∼34% (mutant –995) reduction in promoter activity]. In contrast, a major impact on promoter expression was apparent in CREF-raf and CREF-ras cells using a deletion mutant, at position –40, which retained the TATA (position –24) and an AP1 (position +8) binding sites (Figs 6 and 7). This construct displayed basal promoter activity, which was reduced in comparison with the FL-PEG-Prom by >6-fold in CREF-raf and >8-fold in CREF-ras cells. This deletion mutant (at map position –40) is missing the PEA3 transcription factor binding site that is present at position –104. Specific point mutations of the PEA3 site at positions –104 (T to C), –103 (T to C) and –101 (C to A) significantly blunted the impact of oncogenic transformation on the activity of the PEG-3 promoter (Fig. 8). Collectively, the findings in Figures 1–8 argue that MAPK signaling via PEA3 plays a major role in the control of PEG-3 promoter function and protein expression by oncogenes.
Figure 8.
Effect of mutating the PEA3 site at positions –104, –103 and –101 in the PEG-Prom on activity in CREF and various CREF transformed cells. Fold activation is in comparison with activity in CREF cells. The wild-type sequence in the PEA3 site of the PEG-3 promoter located between nucleotides –100 and –105 is 5′-TTTCCT-3′ and in the mutated sequence in the PEA3 site of PEG-3 is 5′-TCCCAT-5′. Experimental details are as described in the legend to Figure 6.
Oncogenically transformed CREF cells display enhanced PEA3 nuclear transcription factor binding
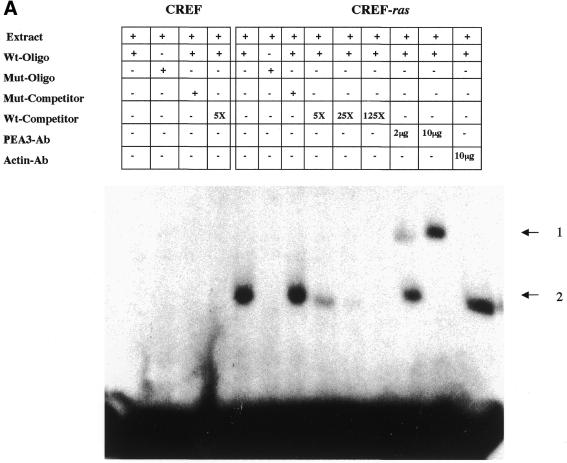
Western blotting data documented an induction in PEA3 protein expression in v-raf and Ha-ras transformed CREF cells (Figs 3 and 5). Electrophoretic mobility shift assays (EMSAs) were performed to determine the DNA binding potential of PEA3 proteins in transformed cells (Fig. 9). Using a wild-type PEA3 oligonucleotide, PEA3 binding was apparent in CREF-ras and CREF-raf transformed CREF cells, but not in untransformed CREF cells (Fig. 9A and data not shown). The specificity of the PEA3 binding in Ha-ras transformed CREF was demonstrated by concentration-dependent competition with a 5-, 25- and 125-molar excess of unlabeled wild-type competitor and the absence of a competition effect or a DNA–protein complex when using a mutant PEA3 oligonucleotide (Fig. 9A). Direct confirmation of binding of nuclear extracts to PEA3 was indicated by supershift assays using PEA3 antibody. In contrast, no supershifted DNA–protein complexes were evident when an anti-actin antibody was used in place of the PEA3 antibody. Similar results were obtained using nuclear extracts from CREF-raf transformed cells (data not shown). In contrast, an identical pattern of binding of nuclear extracts to an Sp1 oligonucleotide was apparent in CREF and CREF-ras and CREF-raf transformed cells (data not shown).
Figure 9.
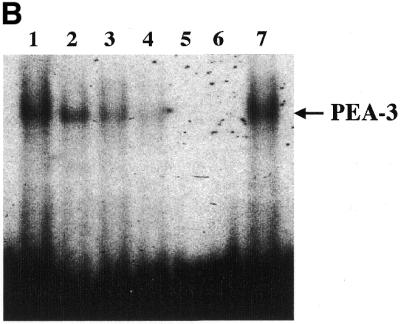
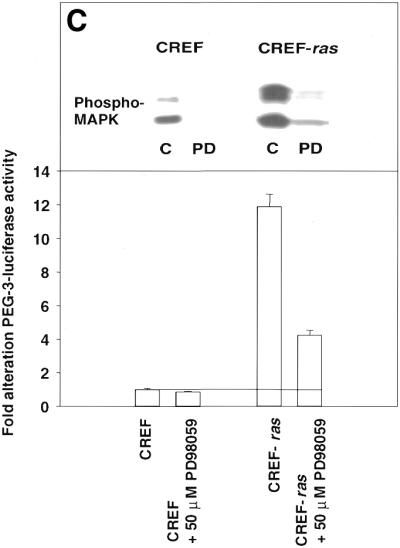
Analysis of nuclear protein binding to PEA3 elements by EMSA and inhibition of binding and PEG-Prom activity by MAPK inhibition. (A) PEA3 nucleoprotein complexes in CREF and CREF-ras cells were identified using EMSA. Nuclear extracts were prepared from the two cell types and incubated with a PEA3 probe with the sequence 5′-GTGTTGTTTTCCTCTCTCCA-3′/3′-CACAACAAAAGGAGAGAGGT-5′ (extending from nucleotides –112 to –93) labeled using [γ-32P]ATP and T4 DNA kinase. The reaction mixture was electrophoresed in a 5% non-denatured polyacrylamide gel as described in Materials and Methods. Arrow 1 indicates the supershifted PEA3 DNA–protein complex in CREF-ras cells. All of the samples contain nuclear extracts from either CREF or CREF-ras cells. Mut-oligo samples contain a mutated PEA3 oligonucleotide with the sequence 5′-GTGTTGTTCCCATCTCTCCA-3′/3′-CACAACAAGGGTAGAGAGGT-5′. Wt-oligo sample contains a wild-type PEA3 oligonucleotide. Mut-Competitor refers to the presence of a 125-fold molar excess of unlabeled mutant oligonucleotide. Wt-Competitor refers to the presence of a 5-, 25- or 125-fold molar excess of unlabeled wild-type competitor. PEA3-Ab samples contain 2 or 10 µg of anti-PEA3-Ab. Actin-Ab sample contains 10 µg of anti-actin antibody. (B) Effect of MAPK inhibition on PEA3 binding in CREF-ras cells. Nuclear extracts were prepared from cells either untreated or treated for 6 h with PD98059 (50 µM) and EMSA performed as described in (A). Lane 1, DMSO (0.05%) (control); lane 2, 50 µM PD98059; lane 3, 100 µM PD98059; lane 4, 150 µM PD98059; lane 5, control lacking nuclear protein, only containing labeled probe; lane 6, competition sample containing nuclear protein, labeled probe and 100× unlabeled PEA3 competitor probe; lane 7, positive sample containing nuclear protein and labeled probe. (C) Inhibition of MAPK reduces PEG-3 promoter function in CREF and CREF-ras cells. CREF and CREF-ras cells were transfected with a FL-PEG-Prom. Twenty-four hours after transfection, cells were treated with either vehicle control (VEH) or the MEK1/2 inhibitor PD98059 (50 µM). Two hours after treatment, cells were harvested and, in parallel, the activity of the FL-PEG-Prom was determined as in Materials and Methods, and MAPK activity was determined by use of a phospho-specific antibody (inset panel).
Since inhibition of MAPK reduced PEG-3 expression, and since Ets transcription factors, such as PEA3, are regulated by MAPK signaling, we next determined whether MAPK signaling modulated PEA3 DNA bindings and the function of the PEG-Prom. Inhibition of MAPK function by PD98059 reduced PEA3 DNA binding (Fig. 9B). MAPK signaling is enhanced in CREF-ras cells, which have elevated PEG-Prom activity (Fig. 9C). In addition, inhibition of MEK1/2 by PD98059 reduced both PEG-Prom activity and basal MAPK activity in both CREF and CREF-ras cells by 60–80% within 2 h (Fig. 9C). This data strongly argues that MAPK signaling, via PEA3, plays a key role in the ras-dependent increase in PEG-prom activity in CREF-ras cells.
Finally, to confirm an in vivo interaction between nuclear proteins and a PEA3 site within the PEG-Prom, adjacent to the TATA box, DNase I footprinting assays were performed. As shown in Figure 10, a region of the PEG-3 promoter is protected by PEA3 in Ha-ras and v-raf transformed CREF cells, but not in untransformed CREF cells. These experiments demonstrate that Ha-ras and v-raf transformed CREF cells contain elevated levels of PEA3 with the capacity to bind to sites within the promoter of PEG-3.
Figure 10.
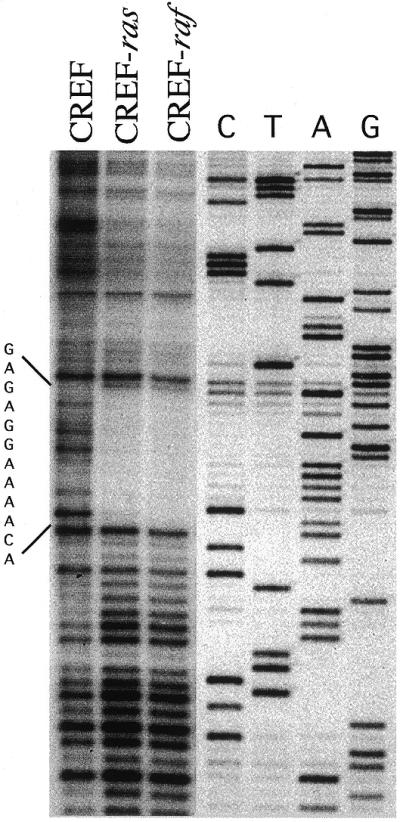
DNase I footprinting of the PEG-3 promoter with CREF, CREF-ras and CREF-raf nuclear extracts demonstrates binding to PEA3 sites in oncogenically transformed CREF cells. For this assay a 297 bp DNA fragment (+137 to –160) of the PEG-3 promoter was labeled with T4 DNA kinase and [γ-32P]ATP, digested with SacI resulting in a 287 bp (+127 to –160) fragment with position 1622 end-labeled with 32P (the PEA3 element was located at –100 to –105, near the TATA box region). A sequencing reaction performed on this 287 bp fragment (Maxam and Gilbert) was run in parallel. The protected sequence corresponding to the PEA3 element, GAGAGGAAAACA, in CREF-ras and CREF-raf is indicated to the left of the figure.
DISCUSSION
Cancer is a progressive disease that can culminate in acquisition of metastatic potential by tumor cells and patient mortality (1–5). An understanding of the genetic elements involved in this process offers promise for defining potentially relevant and useful targets for improving cancer therapy (1). Frequent genomic changes associated with cancer progression include the activation of dominantly acting oncogenes and the inhibition in expression of genes that normally function to inhibit the cancer process, i.e. tumor suppressor genes (1–5). An additional component of the cancer paradigm may involve the enhanced or reduced expression of genes that directly modulate cancer aggressiveness, i.e. progression enhancing (PEGen) and progression suppressing (PSGen) genes (9,11,12). To identify candidate genes involved in cancer development and evolution we are using a number of approaches, including subtraction hybridization (10,11) and reciprocal subtraction differential RNA display (12). Subtraction hybridization identified a progression-enhancing gene, PEG-3, which induces an aggressive cancer phenotype in tumor cells but which lacks the ability to elicit a tumor phenotype in normal cells (11,13). When the rodent PEG-3 gene is overexpressed in rodent or human tumor cells it elicits an increase in anchorage independence in vitro (13). Moreover, forced expression of PEG-3 also results in an oncogenic phenotype in human tumors not displaying tumorigenic potential in nude mice and a more aggressive cancer phenotype in human tumor cells with pre-existing oncogenic potential (13). A potential mechanism by which PEG-3 elicits an aggressive in vivo tumor phenotype in transformed rodent and human cancer cells may involve modulation of VEGF and the process of angiogenesis (13). In contrast, based on the agar cloning data, it appears that PEG-3 may also regulate the expression of genes that can directly facilitate cancer progression. Identification of these target genes will be important and may provide new avenues for therapeutic intervention in the cancer process.
A potential mechanism by which PEG-3 expression is regulated as a function of oncogenic transformation of CREF cells has been addressed in the present studies. CREF-ras cells displayed increased activity within the ‘classical’ MAPK pathway, which was blocked by specific inhibition of MEK1/2 by PD98059. Reduced MAPK function in these cells reduced both growth in soft agar and expression of PEG-3. Specific induction of MAPK activity using ΔB-Raf:ER also increased PEG-3 expression in a MAPK-dependent fashion. Emphasis then was placed on defining the region of the PEG-Prom that is responsible for elevated PEG-3 expression in Ha-ras and v-raf transformed CREF cells. A particularly useful system for this analysis involves CREF cells doubly transformed by Ha-ras and Krev-1 (16–18,28). The patterns of gene expression of CREF cells versus Ha-ras transformed CREF cells are dramatically different (18,28). CREF-ras cells display reduced levels of nm23-H1 and TIMP-1 (tissue inhibitor of metalloproteinase) transcription and steady-state mRNA and elevated levels of cripto, 94 kDa gelatinase/type IV collagenase (94 kDa GEL), osteopontin and transin/stromelysin transcripts and mRNA compared with CREF cells (18). Co-expression of the Ha-ras suppressor gene Krev-1 in Ha-ras transformed CREF cells results in a reversion of gene expression and phenotype to a CREF-like state (18,19), i.e. morphology is returned to normal, anchorage independence is essentially extinguished and tumorigenicity is initially inhibited when cells are subcutaneously injected into athymic nude mice or syngeneic rats. In addition, the pattern of gene expression of B1 returns to that observed in CREF cells (18). These findings correlated with a reduction in MAPK activity in B1 cells to a level similar to that found in parental CREF cells. However, with extended times in nude mice, tumors and metastases both develop indicating that suppression of the oncogenic state by Krev-1 is transient in vivo. Re-expression of the oncogenic phenotype does not correlate with a loss of expression of Krev-1 or an increase in expression of the Ha-ras oncogene (18). In these revertant cells, the pattern of gene expression again returns to that observed in Ha-ras transformed CREF cells. Furthermore, in the revertant cells, MAPK activity was also increased. Collectively, our data argue that oncogenic ras transformation and PEG-3 expression in CREF cells correlates closely with increased activity within the MAPK pathway. Based on northern and western blotting, promoter deletion analysis, EMSA and in vivo footprinting evidence, a relationship between the transcription factor PEA3 and PEG-3 expression in the process of Ha-ras and v-raf transformation of CREF cells was observed.
The PEA3 transcription factor is a member of the ets gene family, implicated in several diverse processes, including cell transformation, oncogenesis and sensory-motor development in the spinal cord (31,35,36). PEA3 proteins modulate gene transcription by binding to specific, ∼10 bp, DNA sequences within the promoters of target genes (37–39). This binding can result in transcriptional activation as well as transcriptional suppression (38–44). A number of putative PEA3 target genes have been identified, including serine urokinase-type plasminogen activator, matrix metalloproteinases gelatinase B, interstitial collagenase, stomelysin-3, matrilysin, stromelysin, collagenase and HER-2/neu (38–45). Expression of oncogenes such as v-ras and v-raf in CREF cells increased MAPK activity, and increased MAPK activity enhanced PEA3 binding to DNA. In addition, PEA3 sites within the promoters of non-nuclear oncogenes, including Ha-ras and v-raf, represent targets for transcriptional activation (39,46). In the case of Ha-ras and v-raf oncogenically transformed CREF cells, the present data implicates a PEA3 site at position –100 to –105 within the PEG-3 promoter as a potential modulator of PEG-3 transcriptional activation. It is worth noting that this PEA3 site is also important in regulating basal and enhanced PEG-3 transcription in E11 and E11-NMT cells, respectively, which are RE cells transformed by the nuclear acting Ad5 E1A and E1B oncogenes. These results suggest that transformation by diverse acting oncogenes may elicit changes in MAPK activity, PEA3 DNA binding and PEG-3 expression. In addition, the activity of the MAPK pathway as well as the level of PEA3 and PEG-3 expression can also be regulated as a consequence of cancer progression, with and without altered expression of the oncogene initially eliciting transformation.
Some controversy currently exists as to the role of PEA3 in human cancer development and progression (23,44,47–49). Trimble et al. (47) observed elevated expression of PEA3 in metastatic mammary adenocarcinomas developing in transgenic mice bearing the rat neu proto-oncogene under the transcriptional control of the mouse mammary tumor virus promoter. Based on this observation it was suggested that enhanced expression of PEA3 might be required to facilitate mammary tumor progression and metastasis. This same group also provided data indicating that 93% of HER-2/neu overexpressing human breast cancer tumor samples contain elevated PEA3 transcripts (49). Accordingly, it was suggested that HER-2/neu was inducing an increase in PEA3 transcriptional activity and the transcriptionally activated PEA3 was capable of stimulating both HER-2/neu and PEA3 gene transcription by binding to sites in the promoters of these genes (49). In contrast, Baert et al. (48) compared the levels of PEA3 in a series of normal and cancerous human breast epithelial cells and found high levels of expression in normal as well as specific breast cancer cell lines. In addition, a recent report by Xing et al. (44) indicates that PEA3 can bind to sites within the promoter of the HER-2/neu oncogene in breast cancer cells and suppress both expression of this gene and inhibit tumorigenesis. These conflicting results suggest that elevated PEA3 expression may be restricted to a subset of human breast cancer cells and its precise role in breast cancer progression remains to be determined.
PEG-3 represents a new and consequential element in the cancer paradigm. Based on current data it appears that PEG-3 can potentiate the cancerous process in two ways, i.e. by inducing angiogenesis and by facilitating the expression of genes regulating cancer aggressiveness. In these contexts, PEG-3 provides a valuable tool that will permit the identification of the relevant genes that associate with and cause cancer progression. Obtaining this objective will not only increase our understanding of the oncogenic process but it also offers promise for elucidating target genes and pathways that can be exploited for improving cancer detection and therapy.
Acknowledgments
ACKNOWLEDGEMENTS
We thank Drs Rahul V.Gopalkrishnan and Dong-chul Kang for critical comments on this manuscript. We are grateful to Dr John Hassel for providing a PEA3 cDNA. This research was supported in part by National Institutes of Health grants CA35675, CA74468 and DK52825, Department of Defense grant BC98-0148, the Chernow Endowment and the Samuel Waxman Cancer Research Foundation. P.B.F. is the Michael and Stella Chernow Urological Cancer Research Scientist. D.H. is the recipient of the VJAS ACS Award year 2000.
References
- 1.Fisher P.B. (1984) Enhancement of viral transformation and expression of the transformed phenotype by tumor promoters. In Slaga,T.J. (ed.), Mechanisms of Tumor Promotion. III. Tumor Promotion and Carcinogenesis In Vitro. CRC Press, Boca Raton, FL, pp. 57–123.
- 2.Bishop J.M. (1991) Molecular themes in oncogenesis. Cell, 64, 235–248. [DOI] [PubMed] [Google Scholar]
- 3.Knudson A.G. (1993) Antioncogenes and human cancer. Proc. Natl Acad. Sci. USA, 90, 10914–10921. [DOI] [PMC free article] [PubMed] [Google Scholar]
- 4.Hartwell L.H. and Kastan,M.B. (1994) Cell cycle control and cancer. Science, 266, 1821–1828. [DOI] [PubMed] [Google Scholar]
- 5.Lengauer C., Kinzler,K.W. and Vogelstein,B. (1998) Genetic instabilities in human cancers. Nature, 396, 643–649. [DOI] [PubMed] [Google Scholar]
- 6.Fisher P.B., Goldstein,N.I. and Weinstein,I.B. (1979) Phenotypic properties and tumor promoter induced alterations in rat embryo cells transformed by adenovirus. Cancer Res., 39, 3051–3057. [PubMed] [Google Scholar]
- 7.Fisher P.B., Dorsch-Hasler,K., Weinstein,I.B. and Ginsberg,H.S. (1979) Tumor promoters enhance anchorage-independent growth of adenovirus-transformed cells without altering the integration pattern of viral sequences. Nature, 281, 591–594. [DOI] [PubMed] [Google Scholar]
- 8.Fisher P.B., Bozzone,J.H. and Weinstein,I.B. (1979) Tumor promoters and epidermal growth factor stimulate anchorage-independent growth of adenovirus transformed rat embryo cells. Cell, 18, 695–705. [DOI] [PubMed] [Google Scholar]
- 9.Babiss L.E., Zimmer,S.G. and Fisher,P.B. (1985) Reversibility of progression of the transformed phenotype in Ad5-transformed rat embryo cells. Science, 228, 1099–1011. [DOI] [PubMed] [Google Scholar]
- 10.Reddy P.G., Su,Z. and Fisher,P.B. (1993) Identification and cloning of genes involved in progression of transformed phenotype. In Adolph,K.W. (ed.), Chromosome and Genetic Analysis, Methods in Molecular Genetics. Academic Press, Orlando, FL, pp. 68–102.
- 11.Su Z., Shi,Y. and Fisher,P.B. (1997) Subtraction hybridization identifies a progression elevated gene PEG-3 with sequence homology to a growth arrest and DNA damage inducible gene. Proc. Natl Acad. Sci. USA, 94, 9125–9130. [DOI] [PMC free article] [PubMed] [Google Scholar]
- 12.Kang D., LaFrance,R., Su,Z. and Fisher,P.B. (1998) Reciprocal subtraction differential RNA display (RSDD): an efficient and rapid procedure for isolating differentially expressed gene sequences. Proc. Natl Acad. Sci. USA, 95, 13788–13793. [DOI] [PMC free article] [PubMed] [Google Scholar]
- 13.Su Z., Goldstein,N.I., Jiang,H., Wang,M.-N., Duigou,G.J., Young,C.S.H. and Fisher,P.B. (1999) PEG-3, a non-transforming progression gene, is a positive regulator of cancer aggressiveness and angiogenesis. Proc. Natl Acad. Sci. USA, 96, 15115–15120. [DOI] [PMC free article] [PubMed] [Google Scholar]
- 14.Fisher P.B., Babiss,L.E., Weinstein,I.B. and Ginsberg,H.S. (1982) Analysis of type 5 adenovirus transformation with a cloned rat embryo cell line (CREF). Proc. Natl Acad. Sci. USA, 79, 3527–3531. [DOI] [PMC free article] [PubMed] [Google Scholar]
- 15.Babiss L.E., Ginsberg,H.S. and Fisher,P.B. (1983) Cold sensitive expression of transformation by a host-range mutant of type 5 adenovirus. Proc. Natl Acad. Sci. USA, 80, 1352–1356. [DOI] [PMC free article] [PubMed] [Google Scholar]
- 16.Boylan J.F., Jackson,J., Steiner,M., Shih,T.Y., Duigou,G.J., Roszman,T., Fisher,P.B. and Zimmer,S.G. (1990) Role of the Ha-ras (rasH) oncogene in mediating progression of the tumor cell phenotype (Review). Anticancer Res., 10, 717–724. [PubMed] [Google Scholar]
- 17.Boylan J.F., Shih,T.Y., Fisher,P.B. and Zimmer,S.G. (1992) Induction and progression of the transformed phenotype in cloned rat embryo fibroblast cells: studies employing type 5 adenovirus and wild-type and mutant Ha-ras oncogenes. Mol. Carcinog., 3, 309–318. [DOI] [PubMed] [Google Scholar]
- 18.Su Z., Austin,V.N., Zimmer,S.G. and Fisher,P.B. (1993) Defining the critical gene expression changes associated with expression and suppression of the tumorigenic and metastatic phenotype in Ha-ras-transformed cloned rat embryo fibroblast cells. Oncogene, 8, 1211–1219. [PubMed] [Google Scholar]
- 19.Lin J., Su,Z., Grunberger,D., Zimmer,S.G. and Fisher,P.B. (1994) Expression of the transformed phenotype induced by diverse acting viral oncogenes mediates sensitivity to growth suppression induced by caffeic acid phenethyl ester (CAPE). Int. J. Oncology, 5, 5–15. [DOI] [PubMed] [Google Scholar]
- 20.Su Z., Shi,Y. and Fisher,P.B. (2000) Cooperation between AP1 and PEA3 sites within the progression elevated gene-3 (PEG-3) promoter regulate basal and differential expression of PEG-3 during progression of the oncogenic phenotype in transformed rat embryo cells. Oncogene, 19, 3411–3421. [DOI] [PubMed] [Google Scholar]
- 21.Janknecht R., Monte,D., Baert,J.L. and de Launoit,Y. (1996) The ETS-related transcription factor ERM is a nuclear target of signaling cascades involving MAPK and PKA. Oncogene, 13, 1745–1754. [PubMed] [Google Scholar]
- 22.Silberman S., Janulis,M. and Schultz,R.M. (1997) Characterization of downstream Ras signals that induce alternative protease-dependent invasive phenotypes. J. Biol. Chem., 272, 5927–5935. [DOI] [PubMed] [Google Scholar]
- 23.O’Hagan R.C. and Hassell,J.A. (1998) The PEA3 Ets transcription factor is a downstream target of the HER2/Neu receptor tyrosine kinase. Oncogene, 16, 301–310. [DOI] [PubMed] [Google Scholar]
- 24.Brown L.A., Amores,A., Schilling,T,F., Jowett,T., Baert,J.L., de Launoit,Y. and Sharrocks,A.D. (1998) Molecular characterization of the zebrafish PEA3 ETS-domain transcription factor. Oncogene, 17, 93–104. [DOI] [PubMed] [Google Scholar]
- 25.Su Z., Zhang,P. and Fisher,P.B. (1990) Enhancement of virus and oncogene-mediated transformation of cloned rat embryo fibroblast cells by 3-aminobenzamide. Mol. Carcinog., 3, 309–318. [DOI] [PubMed] [Google Scholar]
- 26.Su Z., Duigou,G.J. and Fisher,P.B. (1991) Low level β1 protein kinase C expression in cloned rat embryo fibroblast cells enhances transformation induced by the adenovirus type 5 E1A gene. Mol. Carcinog., 4, 328–337. [DOI] [PubMed] [Google Scholar]
- 27.Rapp U.R., Goldsborough,M.D., Mark,G.E., Bonner,T.I., Groffen,J., Reynolds,F.H., Jr and Stephenson,J.R. (1983) Structure and biological activity of v-raf, a unique oncogene transduced by a retrovirus. Proc. Natl Acad. Sci. USA, 80, 4218–4222. [DOI] [PMC free article] [PubMed] [Google Scholar]
- 28.Su Z., Yemul,S., Estabrook,A., Zimmer,S.G., Friedman,R.M. and Fisher,P.B. (1995) Transcriptional switching model for the regulation of tumorigenesis and metastasis by the Ha-ras oncogene: transcriptional changes in the Ha-ras tumor suppressor gene lysyl oxidase. Int. J. Oncology, 7, 1279–1284. [DOI] [PubMed] [Google Scholar]
- 29.Gopalkrishnan R.V., Christiansen,K.A., Goldstein,N.I., DePinho,R.A. and Fisher,P.B. (1999) EF-1α promoter for expression can significantly increase success in establishing stable cell lines with consistent expression: a study using the tetracycline inducible system in human cancer cells. Nucleic Acids Res., 27, 4775–4782. [DOI] [PMC free article] [PubMed] [Google Scholar]
- 30.Dignam J.D., Lebovitz,R.M. and Roeder,R.G. (1983) Accurate transcription initiation by RNA polymerase II in a soluble extract from isolated mammalian nuclei. Nucleic Acids Res., 11, 1475–1489. [DOI] [PMC free article] [PubMed] [Google Scholar]
- 31.Brown T.A. and McKnight,S.L. (1992) Specificities of protein–protein and protein–DNA interaction of GABP α and two newly defined ets-related proteins. Genes Dev., 6, 2502–2512. [DOI] [PubMed] [Google Scholar]
- 32.Auer K.L., Contessa,J., Brenz-Verca,S., Pirola,L., Rusconi,S., Cooper,G., Abo,A., Wymann,M.P., Davis,R.J., Birrer,M. and Dent,P. (1998) The Ras/Rac1/Cdc42/SEK/JNK/c-Jun cascade is a key pathway by which agonists stimulate DNA synthesis in primary cultures of rat hepatocytes. Mol. Biol. Cell, 9, 561–573. [DOI] [PMC free article] [PubMed] [Google Scholar]
- 33.Dent P., Haser,W., Haystead,T.A.J., Vincent,L.A., Roberts,T.M. and Sturgill,T.W. (1992) Activation of mitogen-activated protein kinase by v-Raf in NIH 3T3 cells and in vitro. Science, 257, 1404–1407. [DOI] [PubMed] [Google Scholar]
- 34.Dent P. and Sturgill,T.W. (1994) Activation of (His)6-Raf-1 in vitro by partially purified plasma membranes from v-Ras-transformed and serum-stimulated fibroblasts. Proc. Natl Acad. Sci. USA, 91, 9544–9548. [DOI] [PMC free article] [PubMed] [Google Scholar]
- 35.Ghosh A. and Kolodkin,A.L. (1998) Specification of neuronal connectivity: ETS marks the spot. Cell, 95, 303–306. [DOI] [PubMed] [Google Scholar]
- 36.Lin J.H., Saito,T., Anderson,D.J., Lance-Jones,C., Jessel,T.M. and Arber,S. (1998) Functionally related motor neuron pool and muscle sensory afferent subtypes defined by coordinate ETS gene expression. Cell, 95, 393–407. [DOI] [PubMed] [Google Scholar]
- 37.Macleod K., Leprince,D. and Stehelin,D. (1992) The ets gene family. Trends Biochem. Sci., 17, 251–256. [DOI] [PubMed] [Google Scholar]
- 38.Seth A., Ascione,R., Fisher,R.J., Mavrothalassitis,G.J., Bhat,N.K. and Papas,T.S. (1992) The ets gene family. Cell Growth Differ., 3, 327–334. [PubMed] [Google Scholar]
- 39.Wasylyk B., Hahn,S.L. and Giovane,A. (1993) The Ets family of transcription factors. Eur. J. Biochem., 211, 7–18. [DOI] [PubMed] [Google Scholar]
- 40.Matrisian L.M. and Bowden,G.T. (1990) Stromelysin/transin and tumor progression. Semin. Cancer Biol., 1, 107–115. [PubMed] [Google Scholar]
- 41.Nerlov C., De Cesare,D., Pergola,F., Caracciolo,A., Blasi,F., Johnsen,M. and Verde,P. (1992) A regulatory element that mediates co-operation between a PEA3-AP-1 element and an AP-1 site is required for phorbol ester induction of urokinase enhancer activity in HepG2 hepatoma cells. EMBO J., 11, 4573–4582. [DOI] [PMC free article] [PubMed] [Google Scholar]
- 42.Matrisian L.M. (1994) Matrix metalloproteinase gene expression. Ann. N. Y. Acad. Sci., 91, 10129–10133. [DOI] [PubMed] [Google Scholar]
- 43.Higashino F., Yoshida,K., Noumi,T., Seiki,M. and Fujinaga,K. (1995) Ets-related protein E1A-F can activate three different matrix metalloproteinase gene promoters. Oncogene, 10, 1461–1463. [PubMed] [Google Scholar]
- 44.Xing X., Wang,S.-C., Xia,W., Zou,Y., Shao,R., Kwong,K.Y., Yu,Z., Miller,S., Huang,L. and Hung,M.C. (2000) The ets protein PEA3 suppresses HER-2/neu overexpression and inhibits tumorigenesis. Nat. Med., 6, 189–195. [DOI] [PubMed] [Google Scholar]
- 45.Gutman A. and Wasylyk,B. (1990) The collagenase gene promoter contains a TPA and oncogene-responsive unit encompassing the PEA3 and AP-1 binding sites. EMBO J., 9, 2241–2246. [DOI] [PMC free article] [PubMed] [Google Scholar]
- 46.Wasylyk C., Flores,P., Gutman,A. and Wasylyk,B. (1989) PEA3 is a nuclear target for transcription activation by non-nuclear oncogenes. EMBO J., 8, 3371–3378. [DOI] [PMC free article] [PubMed] [Google Scholar]
- 47.Trimble M.S., Xin,J.-H., Guy,C.T., Muller,W.J. and Hassell,J.A. (1993) PEA3 is overexpressed in mouse metastatic mammary adenocarcinomas. Oncogene, 8, 3037–3042. [PubMed] [Google Scholar]
- 48.Baert J.-L., Monte,D., Musgrove,E.A., Albagli,O., Sutherland,R.L. and de Launoit,Y. (1997) Expression of the PEA3 group of ETS-related transcription factors in human breast-cancer cells. Int. J. Cancer, 70, 590–597. [DOI] [PubMed] [Google Scholar]
- 49.Benz C.C., O’Hagan,R.C., Richter,B., Scott,G.K., Chang,C.-H., Xiong,X., Chew,K., Ljung,B.-M., Edgerton,S., Thor,A. and Hassell,J.A. (1997) HER2/Neu and the Ets transcription activator PEA3 are coordinately upregulated in human breast cancer. Oncogene, 15, 1513–1525. [DOI] [PubMed] [Google Scholar]


