

Abstract
Background
Tumor metabolism is an essential contributor to disease progression and response to treatment. An understanding of the metabolic phenotype of head and neck squamous cell carcinoma (HNSCC) will allow development of appropriate anti-metabolic strategies for this tumor type.
Methods
A panel of 15 HNSCC cell lines was assayed for glucose and glutamine dependence and sensitivity to metabolic inhibitors. Additionally, broad-spectrum metabolomic analysis using mass spectrometry/liquid chromatography was combined with individual measurements of reducing potential, adenosine triphosphate (ATP) and lactate production to characterize cellular metabolic phenotypes.
Results
HNSCC energy and reducing potential levels closely mirrored extra-cellular glucose concentrations. Glucose starvation induced cell death despite activation of secondary energetic pathways. Conversely, glutamine was not required for HNSCC survival and did not serve as a significant source of energy. 2-deoxyglucose (2-DG) and its fluorinated derivative decreased glycolytic and Krebs cycle activity, cellular energy and reducing potential and inhibited HNSCC cell proliferation. 2-DG effects were potentiated by the addition of metformin, but not inhibitors of the pentose phosphate pathway or glutaminolysis. Despite dependence on glucose catabolism, we identified a subset of cell lines relatively resistant to starvation. Exploration of one such cell line (HN30) suggests that the presence of wild-type p53 can partially protect tumor cells from glucose starvation.
Conclusions
HNSCC tumor cells are dependent on glucose, not glutamine for energy production and survival, providing a rationale for treatment strategies targeting glucose catabolism. However, anti-metabolic strategies may need to be tailored to the tumor background, more specifically, p53 status.
Keywords: glycolysis, glutamine, reducing potential, 2-deoxyglucose, metabolism
Introduction
The propensity of tumor cells to utilize glycolysis under both anaerobic and aerobic conditions (Warburg effect) was described more than 80 years ago 1. Since then, it has been demonstrated that tumor cells also utilize secondary metabolic pathways such as glutaminolysis as an alternate source of energy and anabolic carbon 2–4. It remains unclear whether this adaptation to nutrient deprivation can be generalized to all forms of cancer, or if it is specific to cancer site and histology. The relative importance of glucose and secondary nutrients such as glutamine may be tumor type specific, and will require detailed study in multiple experimental systems.
More than 40,000 new cases of head and neck squamous cell carcinoma (HNSCC) are diagnosed in the United States annually. Despite the use of multi-modality treatment, the prognosis for this aggressive solid tumor remains poor 5. Data from other solid tumor models suggests that pharmacologic inhibition of either glucose or glutamine metabolism can impair tumor cell survival and proliferation 6–8. What remains unclear is which metabolic pathway represents the most appropriate target for metabolic inhibition in HNSCC. Although over-expression of glucose transporters (GLUTs), particularly in poorly-differentiated, aggressive tumors has been described, a more mechanistic understanding of HNSCC metabolism is lacking 9–12. Reports of TP53 mutations, myc and ras over-expression and alterations in phosphatidylinositol-3-kinase (PI3K) signaling in HNSCC suggest that either glucose or glutamine metabolism may be altered in HNSCC 13–17.
Metabolic targeting has been employed in pre-clinical models with varied success 18–20. Hexokinase inhibitors (2-deoxyglucose (2-DG)) exhibit anti-tumorigenic activity when combined with conventional chemotherapeutic agents 7, 19, 21, 22. In recent years, studies have shown that 2-DG derivatives have improved cytotoxic and/or cytostatic effects and pharmacokinetics, prompting continued interest in this drug class 23, 24. The study of anti-metabolic agents in a limited number of HNSCC cell lines has focused on 2-DG and a reactive oxygen species mechanism of toxicity rather than a more global understanding of its anti-metabolic effects 25, 26. Since the available HNSCC cell lines have a heterogeneous genetic background and display wide variation in in vitro growth characteristics and tumorigenic potential, we believe a more comprehensive analysis is warranted 27.
To evaluate the potential of metabolic targeting in HNSCC we sought to answer several questions essential to subsequent preclinical and drug development studies. First, what is the primary energetic pathway in HNSCC? Second, can this pathway be specifically targeted to reduce energy production and induce a cytostatic or cytotoxic effect in HNSCC cells? Third, what secondary energetic pathways are activated in response to metabolic stress? To answer these questions, we performed metabolomic analysis of HNSCC cell lines representing various upper aerodigestive tract subsites and disease stages. Our results demonstrate that: 1) glutamine is needed for maximal proliferation but is not a primary energy source and 2) inhibition of glucose catabolism inhibits cell proliferation and anchorage-independent growth across a range of drug concentrations, treatment modalities, and HNSCC cell lines. We also identified the presence of wild-type p53 as one potential mechanism conferring relative resistance to anti-glycolytic strategies in HNSCC.
Materials and Methods
Chemicals
2-deoxyglucose, 3-bromopyruvate, 6-aminonicotinamide, metformin and amino-oxyacetate were purchased from Sigma-Aldrich, (StLouis, MO). D-glucose was purchased from ICN Biomedical (Irvine, CA). Sodium pyruvate was purchased from Lonza (Walkersville, MD). 2-halogen substituted D-glucose analogues (2-deoxy-2-fluoro-D-glucose, 2-deoxy-2-chloro-D-glucose, 2-deoxy-2-bromo-D-glucose) were provided by Dr. Waldemar Priebe (The University of Texas M. D. Anderson Cancer Center, Houston, TX).
Cells
HNSCC cell lines (Table 1), authenticated by short tandem repeat profiling and free of mycoplasma were maintained in Dulbecco’s modified Eagle’s medium (DMEM), DMEM/F12 medium, or RPMI medium containing fetal bovine serum, penicillin/streptomycin, glutamine, sodium pyruvate, nonessential amino acids, and vitamins. Proliferation and cytotoxicity experiments were carried out for 48–120 h in growth media with or without specific drugs. At the end of the experimental period, media was removed, and the relative cell number was ascertained either by direct counting using Trypan blue as an indicator of viability or by using the total DNA content as a surrogate for cell number 28. Cell cycle analysis was performed using propidium iodide staining and apoptosis was evaluated using Annexin V staining according to published protocols 29, 30.
Table 1.
HNSCC cell line characteristics
| Cell Line | Source | Gender | 1° SITE | Stage | LN MET |
|---|---|---|---|---|---|
| HN4 | University of Colorado Health Science Center | M | L | T2N0M0 | |
| HN5 | University of Michigan Medical Center | M | OC | T2N0M0 | |
| HN30 | Wayne State University | N/A | P | N/A | |
| HN31 | Wayne State University | N/A | P | N/A | Y |
| UMSCC17A | University of Michigan Medical Center | F | L | T1N0M0 | |
| UMSCC17B | University of Michigan Medical Center | F | L | T1N0M0 | Y |
| UMSCC22B | University of Michigan Medical Center | F | HP | T2N1M0 | Y |
| UMSCC25 | University of Michigan Medical Center | M | L | T3N0M0 | |
| PCI-13 | University of Pittsburgh Medical Center | M | OC | T4N1M0 | |
| SCC61 | University of Chicago | M | OC | T4N2b | |
| MDA1586 | New York University | M | L | N/A | |
| Sqccy1 | U.T.M.D. Anderson Cancer Center | N/A | N/A | N/A | |
| OSC-19 | Health Science Research Resource Bank | M | OC | N/A | Y |
| FADU | American Type Culture Collection | M | HP | N/A | |
| Tu138 | U.T.M.D. Anderson Cancer Center | M | OC | T3N0M0 |
Abbreviations: LN MET, cell line established from a cervical lymph node; M, male; F, female; L, larynx; OC, oral cavity; P, pharynx; HP, hypopharynx; N/A, not available.
Metabolic studies
Reducing potential, adenosine triphosphate (ATP) and lactate were evaluated as previously described 31, 32. Two HNSCC cell lines (HN30, HN31) were evaluated for changes in multiple intracellular metabolic pathways. Triplicate sub-confluent cultures were exposed to glucose starvation or treatment with 2-DG [20mM] for 1h, 4h and 8 h and subjected to metabolic analysis (Metabolon Inc, Durham, NC) as previously described 33. Statistical analysis of log-transformed data was performed using “R” (http://cran.r-project.org/), which is a freely available, open-source software package. Welch’s t-tests were performed to compare data between experimental groups. Estimated false discovery rates (q-values) associated with all significant compounds were as follows: starved/control 1h, q=0.39; 4h, q=0.44; 8h, q=0.54; 2-DG/control 1h, q=0.26; 4h, q=0.05; 8h, q=0.10.
Soft agar growth
HNSCC cells were seeded in 0.3% or 0.6% low melt agar. Following acclimatization for 24 h, drugs were added. At the end of the experimental period, colonies were stained with crystal violet, counted and analyzed using Image J 1.42q (National Institutes of Health, Bethesda, MD).
Stable cell line development and p53 analysis
Empty lentivirus vector or vector expressing a short-hairpin RNA against p53 (Addgene Inc., Cambridge, MA) were used to create the HN30 control (HN30-lenti) and p53-knockdown stable cell lines (HN30 shp53) respectively. Validation of p53 knockdown was performed using Western blotting for p53 (DO-1, anti-p53 antibody, Santa Cruz Biotechnology, Santa Cruz, CA) following stimulation with 5-fluorouracil (Sigma-Aldrich, St.Louis, MO) for 24hours.
Results
HNSCC cell lines require glucose for survival and glutamine for maximal proliferation
HNSCC cell lines were grown under metabolic deprivation conditions (Fig. 1). In the absence of glutamine, cell population growth was reduced by 7% to 51% compared with the control conditions at 72hr (Fig. 1B and data not shown). Glucose starvation resulted in a significant reduction in cell population growth in the majority of HNSCC cell lines (7/12) primarily due to cell death (Fig. 1C, Fig. 2). When the period of nutrient starvation was lengthened (120hr), all cell lines exhibited cell death under conditions of glucose but not glutamine starvation (data not shown). No precise correlation was detected between sensitivity to glucose deprivation and glutamine deprivation. In order to further validate these findings, we subjected HNSCC cell lines to cell cycle analysis. Although glucose starvation resulted in a significant increase in the sub G1 fraction (HN30- from 1% to 9%; HN31- from 4% to 14%), glutamine withdrawal had no appreciable effect (data not shown). These results were confirmed using Annexin V PE and 7-AAD staining (Fig. 1E); glucose deprivation (HN 30 cell line) resulted in an increase in early and late apoptosis from 2% and 5% respectively to 6% and 19% respectively; glutamine deprivation resulted in no such change.
Figure 1. HNSCC cell lines require glucose and glutamine for maximal cell population growth.
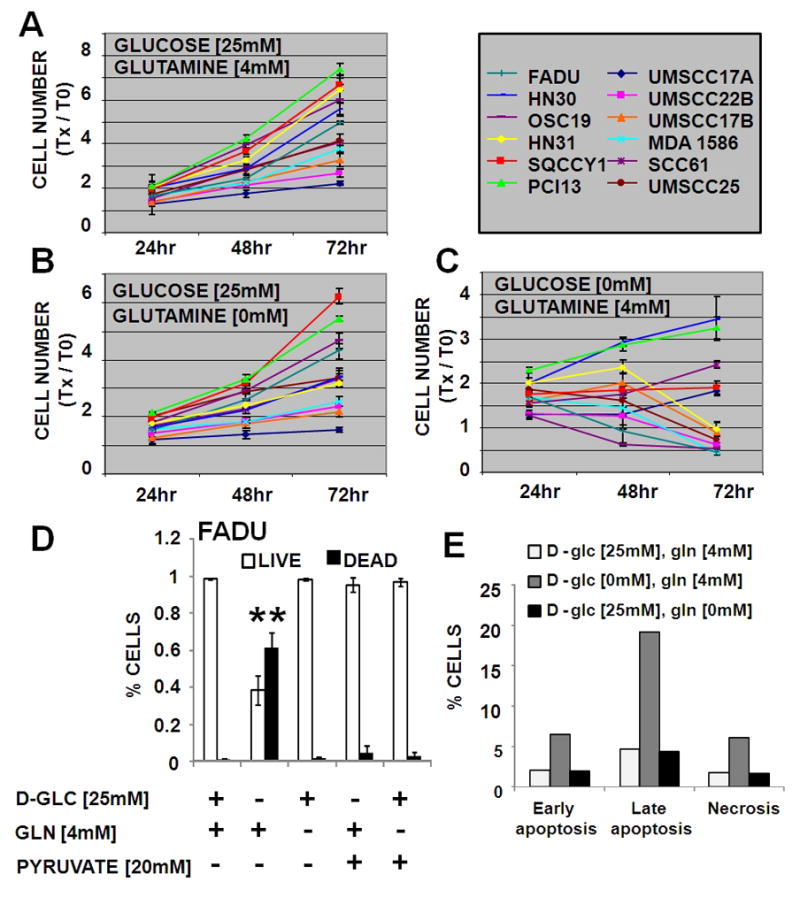
Cells proliferated in normal growth medium (DMEM) (A) or DMEM lacking either glutamine (B) or glucose (C). At indicated times the total DNA content of each well was assayed using a commercially available kit. Y- axis values are expressed as change in cell number at T= Xhr compared to T= 0hr. D) Cells were grown for 72hr in media lacking glucose or glutamine, supplemented with pyruvate. Live/dead cells were evaluated using Trypan blue exclusion. * indicates p<0.05. E) Cells were grown for 48hr in media lacking glucose or glutamine. Cells were collected and subjected to Annexin V PE/7AAD analysis in order to determine the early and late apoptotic as well as the necrotic fraction. Data are representative of multiple independent experiments.
Figure 2. HNSCC cell lines require glucose for survival.
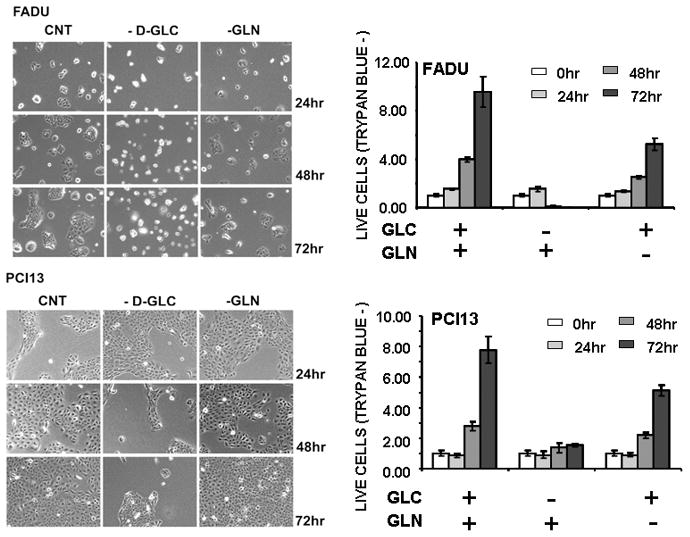
Cells were allowed to proliferate for 0–72hr in the presence or absence of glucose [25mM] and glutamine [4mM]. Cells were counted at each time point using Trypan blue to exclude non-viable cells. GLC = D-glucose [20mM], GLN = glutamine [4mM]. Representative images and cell counts are presented for FADU, a cell line sensitive to glucose withdrawal and PCI13, a cell line relatively resistant to glucose withdrawal.
In cell lines sensitive to glucose deprivation, supplementation with excess pyruvate partially reversed effects on cell population growth (Fig. 1D). Pyruvate “rescue” of glucose starvation was found to result from an inhibition of the cytotoxic effects of glucose deprivation (Fig. 1D). Although excess pyruvate can temporarily blunt the cytotoxic effects of glucose withdrawal, it does not completely or permanently reverse the effects of glucose on cell growth. Together these data suggest that glucose catabolism through glycolysis as well as down-stream pathways is a primary metabolic driver of HNSCC cell proliferation and survival. Although experiments detailed below were performed using the cell line panel detailed in Table 1, selected data were chosen from graphical representation in order to improve clarity. Data for selected cell lines were chosen so as to encompass the variability present in the larger data set, and illustrate maximal and minimal responses.
Pharmacologic inhibition decreases glycolytic flux and triggers global metabolic perturbations in HNSCC cells
Since reducing potential is an essential component of biomass synthesis, energy generation, and free radical inactivation we evaluated the impact of glutamine and/or glucose on intra-cellular reducing potential in HNSCC cell lines 34. A modified MTT reaction was used as an aggregate measure of intra-cellular reducing potential. As shown in Fig. 3, the majority of the cell lines we tested exhibited substantial glucose (Figs. 3A [selected representative data] and 3C) and minimal glutamine (Fig. 3B [selected representative data]) dependence for generation of reducing potential and production of ATP (Fig. 3D). To further confirm the dependence of generation of reducing potential on glycolysis, we exposed HNSCC cell lines to the anti-glycolytic compound 2-DG, which inhibits hexokinase in the first rate-limiting step of glycolysis. 2-DG caused a dose-dependent decrease in reducing potential (Fig. 4A [selected representative data]). This phenomenon was conserved in the case of 3-BP, another hexokinase inhibitor, but not AOA (an inhibitor of glutamate-dependent transaminases) (Fig. 4B). Consistent with its putative anti-glycolytic effects, 2-DG treatment led to reduced intracellular lactate production by HNSCC cells (Fig. 4C). Since hexokinase inhibition is largely a function of the underlying chemical structure, we further tested three halogenated variants of 2-DG. As predicted by their structure, 2-DG and 2-FG exhibited the most potent inhibitory effects, with 2-CG and 2-BG exhibiting more moderate inhibition of intra-cellular energy and reducing potential stores (Fig. 4D). Supplementation with excess pyruvate partially rescued the energetic effects of 2-DG, suggesting that both glycolytic and non-glycolytic glucose catabolism is important for maintenance of the cellular energy state (Fig. 4D). Together with results of our initial proliferation experiments, these data indicate that although glutamine is required for optimal growth of HNSCC cells, it does not appear to contribute significantly to the cells’ energetic state or to be required for survival over the short term.
Figure 3. Glucose is the primary source of reducing potential and ATP production in HNSCC cell lines.
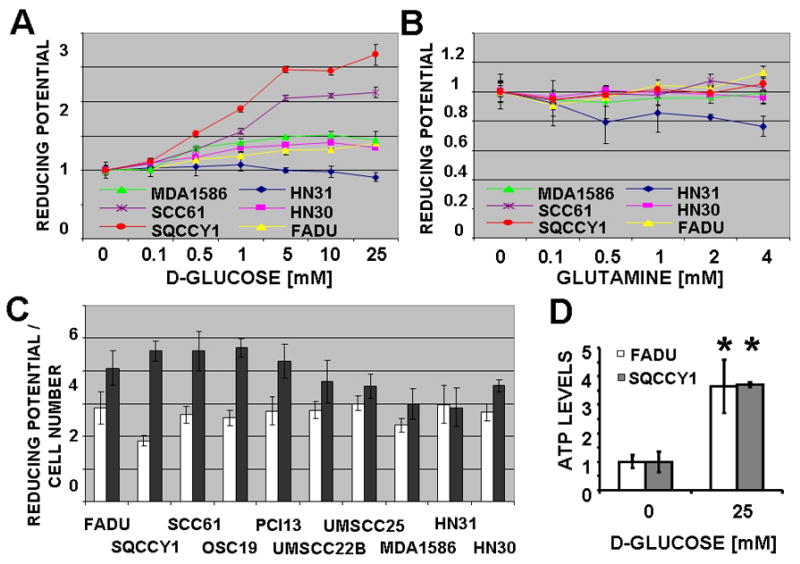
Cells were incubated in a salt solution containing increasing D-glucose (A) or glutamine (B) concentrations for 2hr, followed by a 2hr MTT reaction. C, Baseline reducing potential in 0mM and 25mM D-glucose (GLC) was normalized to total DNA content. D, ATP levels were measured and standardized to cell number.
Figure 4. Inhibition of glycolysis decreases HNSCC reducing potential, ATP levels and lactate production.
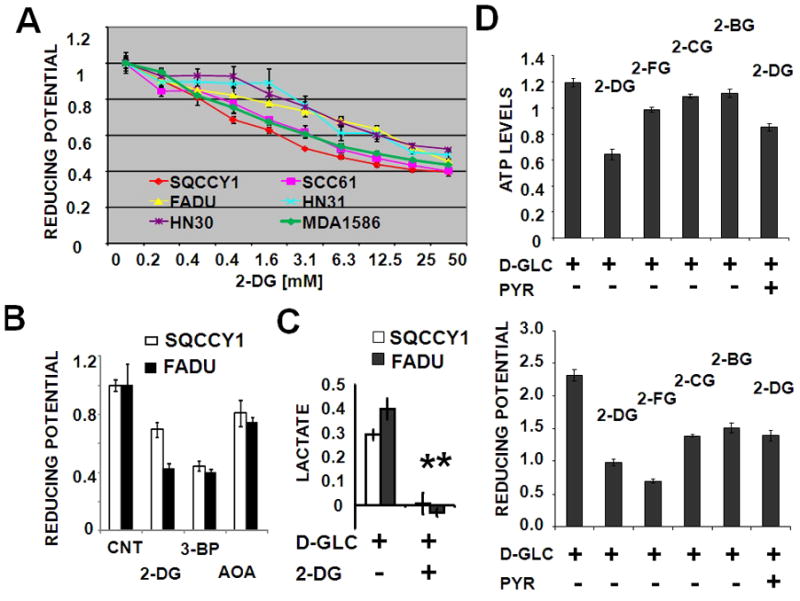
(A) Cells were exposed to increasing concentrations of 2-DG or (B) 2-DG [12.5mM], 3-BP [50μM] and AOA [500μM] in the presence of 5mM D-glucose for 2hr (A), followed by a 2hr MTT reaction. (C) Cells were incubated in D-glucose [1mM] in the presence or absence of 2-DG [10mM] for 6hr followed by measurement of intra-cellular lactate levels (* represents p-value <0.05). (D) Intra-cellular ATP and reducing potential were measured following treatment of cells with 2-DG, 2-FG, 2-CG, 2-BG [25mM] in the presence of D-glucose [10mM] and pyruvate [20mM] for 2hr.
To better understand the effects of glycolytic inhibition on HNSCC metabolism, we used a quantitative, broad-based mass spectrometry platform to analyze changes in intracellular metabolite level in response to glucose starvation or treatment with 2-DG. Glucose starvation and 2-DG treatment caused substantial time-dependent changes in the levels of metabolites involved in multiple intracellular pathways (Fig. 5). The effects of 2-DG were more pronounced than those of glucose starvation with respect to time and extent and were statistically significant with respect to multiple compounds. For this analysis, trends in metabolite levels were ascertained using a high throughput metabolic screen (Fig. 5) and statistical significance determined based on a false discovery rate (q-value) cutoff of 0.1. Metabolites were grouped according to general metabolic pathways (http://www.genome.ad.jp/kegg/; listed in Fig. 5) 35. Evaluation of the metabolite levels indicated decreased glycolytic flux, reduced lactate production, and reduced levels of Krebs cycle intermediates in the absence of glucose or presence of 2-DG. Intracellular 2-DG levels increased over time consistent with a regulated uptake mechanism dependent on glucose transporter activity, and appeared to shunt into the sorbitol/fructose pathway. 2-DG treatment (and, to a lesser extent, glucose starvation) triggered a substantial decrease in UDP-glucuronate levels and accumulation of intermediates in the pentose phosphate pathway along with alterations in purine nucleotide intermediates. Similar trends were observed in the HN31 cell line (derived from a cervical metastasis from the same patient from which HN30 tumor was derived), though the magnitude of changes in oxidative stress and shunting into sorbitol pathways was greater, and that of changes in the pentose phosphate pathway and the Krebs cycle smaller (data not shown).
Figure 5. 2-DG triggers global metabolic changes.

HN30 cells were deprived of glucose or treated with 2-DG [20mM] (in the presence of 25mM D-glucose containing DMEM) for 1, 4 or 8hours and analyzed for intra-cellular metabolite levels. (A) Data are expressed as ratios with the control condition as the denominator. Statistical significance (p-value < 0.05) is indicated by yellow text. Trends in metabolite levels are indicated by color (green= decrease, red= increase compared to control condition). General pathways are indicated to the right of the table. Inset graph illustrates intra-cellular 2-DG levels over time. Error bars indicate standard deviation. (B) Global pathway integration is illustrated in the accompanying diagram. Effects of treatment with 2-DG are indicated by green (decrease) and red (increase) arrows.
HNSCC proliferation and soft agar growth are inhibited by glycolytic inhibitors
The apparent dependence of HNSCC cells on glucose catabolism suggests that pharmacological inhibition of glycolysis could significantly inhibit HNSCC proliferation and survival. We examined the relative cytostatic and/or cytotoxic effects of 3 compounds in HNSCC cells using a high-throughput 96-well assay with continuous drug exposure for 72 h. As shown in Fig. 6A, the hexokinase inhibitors 3-BP and 2-DG exhibited potent anti-proliferative activity in a biologically relevant concentration range. In comparison, AOA exhibited minimal inhibitory effects (<20%), consistent with its minimal effects on intracellular reducing potential. Because of the dual activity of 3-BP as a glycolytic inhibitor and alkylating agent, we focused our attention on 2-DG to focus on the effects of inhibition of glycolysis. We observed variable 2-DG sensitivity in two well-characterized HNSCC cell lines (Fig. 6B) that was maintained across panel of halogenated 2-DG derivatives. Only 2-fluoro-deoxy-D-glucose (2-FG) exhibited an anti-proliferative effect which compared favorably with that of the parent compound 2-DG (Fig. 6D). In contrast, 2-BG and 2-CG exhibited substantially higher half-maximal inhibitory concentrations (data not shown). With the exception of FADU, all tested HNSCC cell lines exhibited low IC50 values that compared favorably with those in cell lines of divergent histogenetic origins (Fig. 6C) 36. Treatment of HNSCC cells with 2-DG also resulted in a dramatic reduction in HNSCC-cell soft agar colony formation (an in vitro surrogate of tumorigenicity) (Fig. 6E and data not shown). The addition of a pentose phosphate pathway inhibitor (6-aminonicotinamide) or a glutaminolysis inhibitor (amino oxyacetate) failed to significantly augment the effects of 2-DG. In contrast, the addition of a glucose sensitizer, metformin, resulted in substantial potentiation of 2-DG effects in multiple cell lines, independent of p53 mutation status (Fig. 7 and data not shown).
Figure 6. Inhibition of glycolysis reduces HNSCC proliferation and soft agar growth.
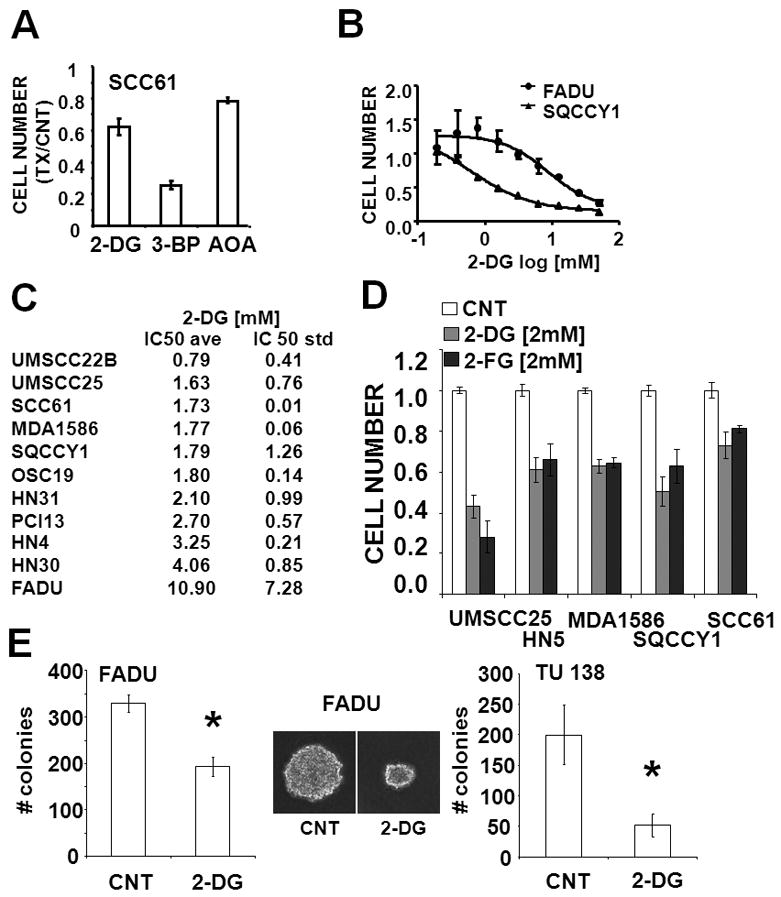
(A) Cells were exposed to 2-DG [12.5mM], 3-BP [62.5μM] and AOA [500μM] for 72hr. Cell number was ascertained and presented relative to the control (media only) condition. (B–D) Following attachment, cells were exposed to increasing concentrations of 2-DG or 2-DG or 2-FG for 72hr. Cell number at the end of the experimental period was ascertained. IC50 values for at least 2 independent experiments were averaged. (E) Cells were seeded in 0.3% soft agar, incubated in either regular media (CNT) or media containing 2-DG [5mM] for 6 days, stained with crystal violet and counted. Representative images are presented in the inset. * represents p-value <0.05.
Figure 7. Metformin potentiates 2-DG effects on HNSCC proliferation.
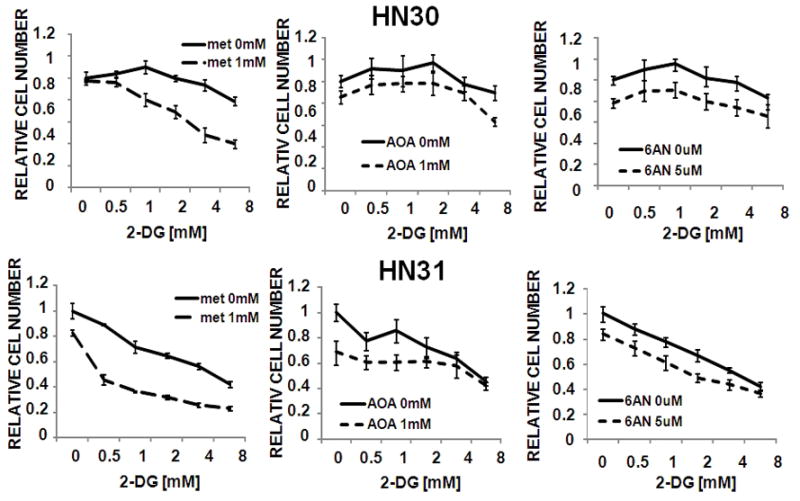
Cells were exposed to 2-DG in the presence or absence of metformin (met), aminooxyacetate (AOA) or 6-aminonicotinamide (6AN) for 72hr. Cell number was ascertained and presented relative to the control (media only) condition.
Loss of wild type p53 partially accounts for resistance to glucose starvation in a subset of HNSCC cells
Three cells lines were identified which consistently exhibited relative resistance to glucose withdrawal. Of these we focused our analysis on HN30, one half of an isogenic pair of cell lines derived from an HNSCC primary tumor (HN30) and its associated cervical metastasis (HN31). Despite their common origin, these two cell lines were found to exhibit differential sensitivity to glucose withdrawal or treatment with 2-DG and its derivatives (Fig. 1 and data not shown). Sequencing of exons 2–11 of the TP53 gene identified wild-type (WT) p53 in HN30 and two point missense mutations of TP53 in HN31 (data not shown). Previous studies have demonstrated a prominent role for WTp53 in tumor cell metabolism 37–39. In this cell line system, reduced expression of WTp53 with shpRNA resulted in a partial ablation of the HN30 resistance to glucose deprivation (Fig. 8B) and 2-DG treatment (Fig. 8C). Cell cycle analysis suggests that cells containing WTp53 initially arrested in G1 following glucose starvation, whereas cells lacking WTp53 began to die at an earlier time point without first accumulating in G1 phase (Fig. 8D and data not shown). Our data exemplifies a resistance mechanism that is linked to a key tumor suppressor pathway in HNSCC, suggesting that susceptibility to anti-glycolytic agents may be dependent on the mutation spectrum found among various tumors.
Figure 8. Loss of WTp53 abrogates glucose starvation induced G1 arrest and sensitizes HN30 cells.
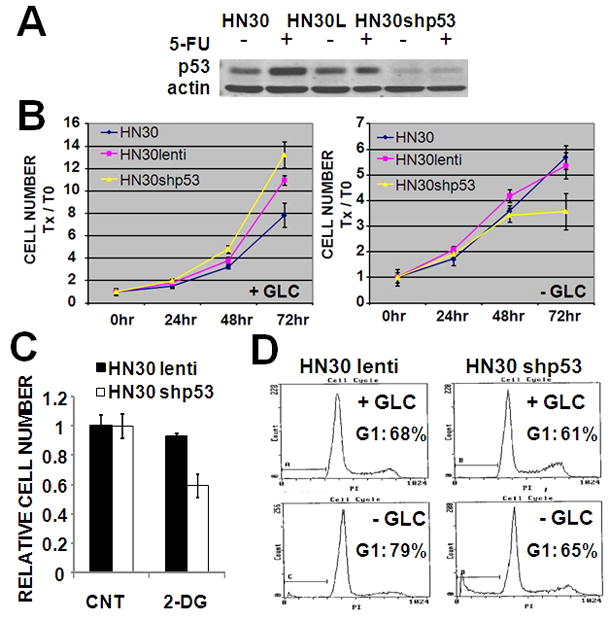
(A) Stable knockdown of WT (HN30shp53) was created. Stimulation with 5-FU (5ng/ml) for 24hr up-regulated expression of WTp53 in HN30 parental and HN30 lentivirus (HN30L) transfected cells. (B) Cells were grown in the presence or absence of glucose for 72hr. Total cell number was assayed at the end of the experimental period. (C) Cells were exposed to 2-DG [5mM] for 72hr. Total cell number was assayed at the end of the experimental period. (D) Cells were glucose starved for 36hr prior to cell cycle analysis using propidium iodide.
Discussion
The role of altered metabolism in the pathogenesis, progression, and resistance of tumors to different treatments has received increasing attention in recent years. Although GLUT expression and 2-fluorodeoxyglucose uptake ([18F]fluorodeoxyglucose-positron emission tomography) correlate with poorly differentiated disease, data on the flux of specific nutrients within HNSCC tumors remain mixed 9, 11, 12, 18 9, 10, 40. In this study, we clarify some of the metabolic underpinnings of HNSCC tumorigenesis and evaluate the potential of anti-metabolic strategies in inhibiting HNSCC-cell proliferation and survival in a cell line panel which represents multiple disease sites and degrees of differentiation.
Under aerobic conditions, the majority of the tested HNSCC cell lines rely on glucose and not glutamine metabolism for primary generation of ATP and reducing potential. Although glutamine may play an important role as an essential amino acid and protein building block, its catabolism does not appear to have significant implications for either direct generation of energy or production of reducing potential in HNSCC cells in contrast to results reported for some glioma cell lines 2. Of note, excess pyruvate only partially rescues HNSCC cells from glucose starvation suggesting that catabolic steps both upstream (glycolysis, pentose phosphate pathway) and down-stream (conversion to lactate, tricarboxylic acid (TCA) cycle) of this intermediate are important for energy generation and survival.
Although all tested HNSCC cell lines displayed a preference for glucose, we identified three cell lines which consistently exhibited prolonged survival in response to glucose deprivation. Of these cell lines, SQCCY1 has routinely been maintained in low glucose media and may represent an adaptation to specific in vitro growth conditions. Interestingly, HN30 represents one half of an isogenic pair (HN30 and HN31) of cell lines derived from a patient’s primary tumor and associated cervical metastasis. The divergent metabolic phenotype of these 2 cell lines prompted additional analysis of the underlying mechanism of resistance to starvation. Our data suggest that loss of WTp53 in HN30 results in increased susceptibility to glucose withdrawal or treatment with glycolytic inhibitors. The failure of HN30 cells lacking WTp53 to enter G1 arrest prior to death may be responsible for the delay observed in time to death following glucose withdrawal. A wide variety of mechanisms have been described in the literature by which p53 can impact tumor cell metabolism 37–39. The importance of p53 alteration in the progression of HNSCC and the implication of p53 in HNSCC cell metabolism warrants deeper exploration, however the precise mechanism by which loss of WTp53 may drive the metabolic phenotype of HN30 cells is beyond the scope of this paper. It is important to note however, that loss of WTp53 cannot explain all observed relative resistance to glucose starvation in HNSCC cell lines, as PCI13 and SQCCY1 both express mutant p53 (data not shown). Undoubtedly, factors in the cell background other than p53 status affect sensitiviy to glucose starvation. Nonetheless, it appears from our study and others that p53 can play an important role in the response to glucose deprivation. The fact that p53 tumor suppressor loss is a often a vital step in tumorigenesis, yet can render cells highly susceptible to glucose starvation, provides support for consideration of anti-glycolytic treatment in the management of these tumors.
The apparent glucose addiction of HNSCC cells suggests that anti-glycolytic agents may represent a promising therapeutic option in this tumor type 41. Because 3-BP is thought to possess alkylating activity, we focused our attention on 2-DG, a drug first identified more than 50 years ago. Our data indicate that 2-DG induces rapid, dose-dependent decreases in intracellular reducing potential and ATP in HNSCC cell lines. In addition to effects on lactate production, the specificity of the anti-glycolytic effects of 2-DG was further confirmed by the differential activity of its halogenated analogs 23, 42. By decreasing intra-cellular reducing potential and ATP levels, 2-DG can potentially inhibit both new biomass generation and DNA damage repair 1. These effects have important therapeutic implications for cisplatin and external beam radiation, the mainstays of HNSCC treatment 8, 25. Broad-based metabolomic analysis was used to evaluate 2-DG inhibition of glycolysis and compensatory energetic pathways activated in response to loss of glycolytic flux. Several alternate mechanisms were activated in response to glycolytic stress, including glutaminolysis and shunting into the sorbitol-fructose and pentose phosphate pathways 43. Decreases in TCA cycle intermediates and glutamate levels (combined with earlier experiments) suggest that although glutamine can be catabolized to fulfill some of the cellular energetic requirements, it is not sufficient to balance glycolytic losses in the cell lines we tested. The accumulation of pentose phosphate pathway intermediates may reflect cell cycle arrest, which would be consistent with decreased intra-cellular reducing potential required for nucleotide synthesis. Changes in glutathione levels are consistent with increased intracellular oxidative stress, confirming our findings regarding intracellular reducing potential along with previous studies 25, 26. Although this effect can potentiate traditional chemotherapeutic drug and radiation toxicity, it clearly is only one aspect of the dramatic global metabolic perturbations induced by 2-DG.
Tumor-cell sensitivity to D-glucose analogues is dependent on tumor type, environmental oxygen tension, and specific cellular characteristics possibly related to tumor subtype 36, 42, 44. With one exception (FADU), the HNSCC cell lines we tested displayed low (single-digit) D-glucose IC50 values. In the context of normal glucose homeostasis and 2-DG pharmacokinetics, these values are therapeutically promising. The sensitivity of HNSCC cell lines to halogenated 2-DG analogues was consistent with the underlying chemical structure, more specifically, the halogen group size. Tested HNSCC cell lines displayed comparable sensitivity to 2-DG and 2-FG, further suggesting that on-target anti-glycolytic effects are likely the primary mechanisms that drive toxicity 23, 45. These data led us to conclude that HNSCC cells are sensitive to non-metabolizable D-glucose analogues under normoxic conditions. We expect that hypoxia, normally associated with HNSCC tumors will further potentiate the effects of antiglycolytic agents 23. It has been suggested that targeting multiple metabolic pathways may be more effective than single pathway inhibition. Our data suggest that pharmacologic inhibition of pentose phosphate pathway or glutaminolysis provides little benefit over 2-DG alone. In contrast, the addition of metformin greatly potentiates the effects of glycolytic inhibition irrespective of p53 status. This is consistent with published reports in other tumor types and suggests a potent metabolic synergy which should be further investigated in the in vivo setting 39. The relative resistance of FADU to 2-DG is somewhat puzzling, as it does not precisely correlate with resistance to glucose starvation. This dichotomy may indicate an alteration in either glucose transporter or hexokinase activity. A low affinity transporter or an inneficient hexokinase variant could account for an inability to survive low glucose conditions, while at the same time preventing significant metabolic inhibition by 2-DG. Preliminary data from a parallel study in our laboratory indicates that in this cell line, p53 status is heterozygous for a R248L mutation along with a possible splice site mutation. At the protein level, p53 is constitutively overexpressed (data not shown). Ongoing experiments are aimed at elucidating the role of this mutation, the mutations present in HN31 and our remaining cell lines in regulating HNSCC metabolism.
We conclude that: 1) inhibition of glucose catabolism represents a reasonable pharmacologic and nearly universal approach to HNSCC based on our evaluation of a wide array of HNSCC cell lines, 2) glycolytic inhibition has profound global metabolic consequences, each with important potential implications for therapeutic targeting and 3) glycolytic targeting in HNSCC may be generalizable to an entire class of non-metabolizable D-glucose analogs and pro-drugs. We established that HNSCC is highly dependent on glucose and anti-glycolytic therapy appears to be a valid option in treating this disease. Anti-glycolytic agents could be an important adjuvant to current chemotherapeutics and radiotherapy and warrant further evaluation. Crucial to the development of this drug class as a therapeutic option is an understanding of the potential mechanisms of innate or acquired HNSCC resistance to metabolic stress. Our characterization of a wide array of HNSCC cell lines and initial observations in resistance patterns of HNSCC to anti-glycolytic agents has created a foundation from which to further study metabolic targeting in HNSCC.
Acknowledgments
Grant Support: This research is supported in part by the National Institutes of Health through National Research Science Award Research Training Grant (NIDCD) T32DC007367 (VCS), National Research Science Award Research Training Grant (NCI) T32CA060374 (VCS), NIH Specialized Program of Research Excellence Grant P50CA097007, by M.D Anderson through M. D. Anderson’s Cancer Center Support Grant CA016672 and PANTHEON program, and by an American Academy of Otolaryngology- American Head and Neck Society CORE Pilot Grant. The content is solely the responsibility of the authors and does not necessarily represent the official views of the National Cancer Institute or the National Institutes of Health.
Footnotes
Financial disclosure: There are no financial disclosures from any authors.
References
- 1.Vander Heiden MG, Cantley LC, Thompson CB. Understanding the Warburg effect: the metabolic requirements of cell proliferation. Science. 2009;324(5930):1029–33. doi: 10.1126/science.1160809. [DOI] [PMC free article] [PubMed] [Google Scholar]
- 2.DeBerardinis RJ, Mancuso A, Daikhin E, Nissim I, Yudkoff M, Wehrli S, et al. Beyond aerobic glycolysis: transformed cells can engage in glutamine metabolism that exceeds the requirement for protein and nucleotide synthesis. Proc Natl Acad Sci U S A. 2007;104(49):19345–50. doi: 10.1073/pnas.0709747104. [DOI] [PMC free article] [PubMed] [Google Scholar]
- 3.Wise DR, DeBerardinis RJ, Mancuso A, Sayed N, Zhang XY, Pfeiffer HK, et al. Myc regulates a transcriptional program that stimulates mitochondrial glutaminolysis and leads to glutamine addiction. Proc Natl Acad Sci U S A. 2008;105(48):18782–7. doi: 10.1073/pnas.0810199105. [DOI] [PMC free article] [PubMed] [Google Scholar]
- 4.Yuneva M, Zamboni N, Oefner P, Sachidanandam R, Lazebnik Y. Deficiency in glutamine but not glucose induces MYC-dependent apoptosis in human cells. J Cell Biol. 2007;178(1):93–105. doi: 10.1083/jcb.200703099. [DOI] [PMC free article] [PubMed] [Google Scholar]
- 5.Pignon JP, le Maitre A, Maillard E, Bourhis J. Meta-analysis of chemotherapy in head and neck cancer (MACH-NC): an update on 93 randomised trials and 17,346 patients. Radiother Oncol. 2009;92(1):4–14. doi: 10.1016/j.radonc.2009.04.014. [DOI] [PubMed] [Google Scholar]
- 6.Yang C, Sudderth J, Dang T, Bachoo RM, McDonald JG, DeBerardinis RJ. Glioblastoma cells require glutamate dehydrogenase to survive impairments of glucose metabolism or Akt signaling. Cancer Res. 2009;69(20):7986–93. doi: 10.1158/0008-5472.CAN-09-2266. [DOI] [PMC free article] [PubMed] [Google Scholar]
- 7.Maschek G, Savaraj N, Priebe W, Braunschweiger P, Hamilton K, Tidmarsh GF, et al. 2-deoxy-D-glucose increases the efficacy of adriamycin and paclitaxel in human osteosarcoma and non-small cell lung cancers in vivo. Cancer Res. 2004;64(1):31–4. doi: 10.1158/0008-5472.can-03-3294. [DOI] [PubMed] [Google Scholar]
- 8.Cepeda V, Fuertes MA, Castilla J, Alonso C, Quevedo C, Perez JM. Biochemical mechanisms of cisplatin cytotoxicity. Anticancer Agents Med Chem. 2007;7(1):3–18. doi: 10.2174/187152007779314044. [DOI] [PubMed] [Google Scholar]
- 9.McFate T, Mohyeldin A, Lu H, Thakar J, Henriques J, Halim ND, et al. Pyruvate dehydrogenase complex activity controls metabolic and malignant phenotype in cancer cells. J Biol Chem. 2008;283(33):22700–8. doi: 10.1074/jbc.M801765200. [DOI] [PMC free article] [PubMed] [Google Scholar]
- 10.Brizel DM, Schroeder T, Scher RL, Walenta S, Clough RW, Dewhirst MW, et al. Elevated tumor lactate concentrations predict for an increased risk of metastases in head-and-neck cancer. Int J Radiat Oncol Biol Phys. 2001;51(2):349–53. doi: 10.1016/s0360-3016(01)01630-3. [DOI] [PubMed] [Google Scholar]
- 11.Estilo CL, Oc P, Talbot S, Socci ND, Carlson DL, Ghossein R, et al. Oral tongue cancer gene expression profiling: Identification of novel potential prognosticators by oligonucleotide microarray analysis. BMC Cancer. 2009;9:11. doi: 10.1186/1471-2407-9-11. [DOI] [PMC free article] [PubMed] [Google Scholar]
- 12.Reisser C, Eichhorn K, Herold-Mende C, Born AI, Bannasch P. Expression of facilitative glucose transport proteins during development of squamous cell carcinomas of the head and neck. Int J Cancer. 1999;80(2):194–8. doi: 10.1002/(sici)1097-0215(19990118)80:2<194::aid-ijc6>3.0.co;2-m. [DOI] [PubMed] [Google Scholar]
- 13.Waitzberg AF, Nonogaki S, Nishimoto IN, Kowalski LP, Miguel RE, Brentani RR, et al. Clinical significance of c-myc and p53 expression in head and neck squamous cell carcinomas. Cancer Detect Prev. 2004;28(3):178–86. doi: 10.1016/j.cdp.2004.02.003. [DOI] [PubMed] [Google Scholar]
- 14.Bhattacharya N, Roy A, Roy B, Roychoudhury S, Panda CK. MYC gene amplification reveals clinical association with head and neck squamous cell carcinoma in Indian patients. J Oral Pathol Med. 2009;38(10):759–63. doi: 10.1111/j.1600-0714.2009.00781.x. [DOI] [PubMed] [Google Scholar]
- 15.Freier K, Joos S, Flechtenmacher C, Devens F, Benner A, Bosch FX, et al. Tissue microarray analysis reveals site-specific prevalence of oncogene amplifications in head and neck squamous cell carcinoma. Cancer Res. 2003;63(6):1179–82. [PubMed] [Google Scholar]
- 16.Osthus RC, Shim H, Kim S, Li Q, Reddy R, Mukherjee M, et al. Deregulation of glucose transporter 1 and glycolytic gene expression by c-Myc. J Biol Chem. 2000;275(29):21797–800. doi: 10.1074/jbc.C000023200. [DOI] [PubMed] [Google Scholar]
- 17.Murugan AK, Hong NT, Fukui Y, Munirajan AK, Tsuchida N. Oncogenic mutations of the PIK3CA gene in head and neck squamous cell carcinomas. Int J Oncol. 2008;32(1):101–11. [PubMed] [Google Scholar]
- 18.Stokkel MP, ten Broek FW, van Rijk PP. The role of FDG PET in the clinical management of head and neck cancer. Oral Oncol. 1998;34(6):466–71. doi: 10.1016/s1368-8375(98)00050-5. [DOI] [PubMed] [Google Scholar]
- 19.Mohanti BK, Rath GK, Anantha N, Kannan V, Das BS, Chandramouli BA, et al. Improving cancer radiotherapy with 2-deoxy-D-glucose: phase I/II clinical trials on human cerebral gliomas. Int J Radiat Oncol Biol Phys. 1996;35(1):103–11. doi: 10.1016/s0360-3016(96)85017-6. [DOI] [PubMed] [Google Scholar]
- 20.Shanmugam M, McBrayer SK, Rosen ST. Targeting the Warburg effect in hematological malignancies: from PET to therapy. Curr Opin Oncol. 2009;21(6):531–6. doi: 10.1097/CCO.0b013e32832f57ec. [DOI] [PMC free article] [PubMed] [Google Scholar]
- 21.Zhu Z, Jiang W, McGinley JN, Thompson HJ. 2-Deoxyglucose as an energy restriction mimetic agent: effects on mammary carcinogenesis and on mammary tumor cell growth in vitro. Cancer Res. 2005;65(15):7023–30. doi: 10.1158/0008-5472.CAN-05-0453. [DOI] [PubMed] [Google Scholar]
- 22.Dwarakanath BS, Singh D, Banerji AK, Sarin R, Venkataramana NK, Jalali R, et al. Clinical studies for improving radiotherapy with 2-deoxy-D-glucose: present status and future prospects. J Cancer Res Ther. 2009;5 (Suppl 1):S21–6. doi: 10.4103/0973-1482.55136. [DOI] [PubMed] [Google Scholar]
- 23.Lampidis TJ, Kurtoglu M, Maher JC, Liu H, Krishan A, Sheft V, et al. Efficacy of 2-halogen substituted D-glucose analogs in blocking glycolysis and killing “hypoxic tumor cells”. Cancer Chemother Pharmacol. 2006;58(6):725–34. doi: 10.1007/s00280-006-0207-8. [DOI] [PubMed] [Google Scholar]
- 24.Priebe WCM, Fokt I, Skora S, Conrad CA, Madden T. Blocking glycolysis with 2-deoxy-D-glucose prodrugs to target brain tumors: a novel concept. Molecular Cancer Therapeutics. 2009;8(12 supplemental) [Google Scholar]
- 25.Simons AL, Ahmad IM, Mattson DM, Dornfeld KJ, Spitz DR. 2-Deoxy-D-glucose combined with cisplatin enhances cytotoxicity via metabolic oxidative stress in human head and neck cancer cells. Cancer Res. 2007;67(7):3364–70. doi: 10.1158/0008-5472.CAN-06-3717. [DOI] [PMC free article] [PubMed] [Google Scholar]
- 26.Simons AL, Fath MA, Mattson DM, Smith BJ, Walsh SA, Graham MM, et al. Enhanced response of human head and neck cancer xenograft tumors to cisplatin combined with 2-deoxy-D-glucose correlates with increased 18F-FDG uptake as determined by PET imaging. Int J Radiat Oncol Biol Phys. 2007;69(4):1222–30. doi: 10.1016/j.ijrobp.2007.07.2343. [DOI] [PMC free article] [PubMed] [Google Scholar]
- 27.Lin CJ, Grandis JR, Carey TE, Gollin SM, Whiteside TL, Koch WM, et al. Head and neck squamous cell carcinoma cell lines: established models and rationale for selection. Head Neck. 2007;29(2):163–88. doi: 10.1002/hed.20478. [DOI] [PubMed] [Google Scholar]
- 28.Rago R, Mitchen J, Wilding G. DNA fluorometric assay in 96-well tissue culture plates using Hoechst 33258 after cell lysis by freezing in distilled water. Anal Biochem. 1990;191(1):31–4. doi: 10.1016/0003-2697(90)90382-j. [DOI] [PubMed] [Google Scholar]
- 29.Riccardi C, Nicoletti I. Analysis of apoptosis by propidium iodide staining and flow cytometry. Nat Protoc. 2006;1(3):1458–61. doi: 10.1038/nprot.2006.238. [DOI] [PubMed] [Google Scholar]
- 30.van Genderen H, Kenis H, Lux P, Ungeth L, Maassen C, Deckers N, et al. In vitro measurement of cell death with the annexin A5 affinity assay. Nat Protoc. 2006;1(1):363–7. doi: 10.1038/nprot.2006.55. [DOI] [PubMed] [Google Scholar]
- 31.Ihrlund LS, Hernlund E, Khan O, Shoshan MC. 3-Bromopyruvate as inhibitor of tumour cell energy metabolism and chemopotentiator of platinum drugs. Mol Oncol. 2008;2(1):94–101. doi: 10.1016/j.molonc.2008.01.003. [DOI] [PMC free article] [PubMed] [Google Scholar]
- 32.Hamel P, Abed E, Brissette L, Moreau R. Characterization of oxidized low-density lipoprotein-induced hormesis-like effects in osteoblastic cells. Am J Physiol Cell Physiol. 2008;294(4):C1021–33. doi: 10.1152/ajpcell.00361.2007. [DOI] [PubMed] [Google Scholar]
- 33.Sreekumar A, Poisson LM, Rajendiran TM, Khan AP, Cao Q, Yu J, et al. Metabolomic profiles delineate potential role for sarcosine in prostate cancer progression. Nature. 2009;457(7231):910–4. doi: 10.1038/nature07762. [DOI] [PMC free article] [PubMed] [Google Scholar] [Research Misconduct Found]
- 34.Tong X, Zhao F, Thompson CB. The molecular determinants of de novo nucleotide biosynthesis in cancer cells. Curr Opin Genet Dev. 2009;19(1):32–7. doi: 10.1016/j.gde.2009.01.002. [DOI] [PMC free article] [PubMed] [Google Scholar]
- 35.Kanehisa M, Goto S, Furumichi M, Tanabe M, Hirakawa M. KEGG for representation and analysis of molecular networks involving diseases and drugs. Nucleic Acids Res. 38(Database issue):D355–60. doi: 10.1093/nar/gkp896. [DOI] [PMC free article] [PubMed] [Google Scholar]
- 36.Hernlund E, Hjerpe E, Avall-Lundqvist E, Shoshan M. Ovarian carcinoma cells with low levels of beta-F1-ATPase are sensitive to combined platinum and 2-deoxy-D-glucose treatment. Mol Cancer Ther. 2009;8(7):1916–23. doi: 10.1158/1535-7163.MCT-09-0179. [DOI] [PubMed] [Google Scholar]
- 37.Mathupala SP, Heese C, Pedersen PL. Glucose catabolism in cancer cells. The type II hexokinase promoter contains functionally active response elements for the tumor suppressor p53. J Biol Chem. 1997;272(36):22776–80. doi: 10.1074/jbc.272.36.22776. [DOI] [PubMed] [Google Scholar]
- 38.Okoshi R, Ozaki T, Yamamoto H, Ando K, Koida N, Ono S, et al. Activation of AMP-activated protein kinase induces p53-dependent apoptotic cell death in response to energetic stress. J Biol Chem. 2008;283(7):3979–87. doi: 10.1074/jbc.M705232200. [DOI] [PubMed] [Google Scholar]
- 39.Ben Sahra I, Laurent K, Giuliano S, Larbret F, Ponzio G, Gounon P, et al. Targeting cancer cell metabolism: the combination of metformin and 2-deoxyglucose induces p53-dependent apoptosis in prostate cancer cells. Cancer Res. 70(6):2465–75. doi: 10.1158/0008-5472.CAN-09-2782. [DOI] [PubMed] [Google Scholar]
- 40.Ervens J, Fuchs H, Niemann VT, Hoffmeister B. Pyruvate kinase isoenzyme M2 is not of diagnostic relevance as a marker for oral cancer. J Craniomaxillofac Surg. 2008;36(2):89–94. doi: 10.1016/j.jcms.2007.08.006. [DOI] [PubMed] [Google Scholar]
- 41.Pelicano H, Martin DS, Xu RH, Huang P. Glycolysis inhibition for anticancer treatment. Oncogene. 2006;25(34):4633–46. doi: 10.1038/sj.onc.1209597. [DOI] [PubMed] [Google Scholar]
- 42.Maher JC, Savaraj N, Priebe W, Liu H, Lampidis TJ. Differential sensitivity to 2-deoxy-D-glucose between two pancreatic cell lines correlates with GLUT-1 expression. Pancreas. 2005;30(2):e34–9. doi: 10.1097/01.mpa.0000153327.46945.26. [DOI] [PubMed] [Google Scholar]
- 43.Nicholson D. Metabolic Pathways. 22. 2003. [Google Scholar]
- 44.Zhang XD, Deslandes E, Villedieu M, Poulain L, Duval M, Gauduchon P, et al. Effect of 2-deoxy-D-glucose on various malignant cell lines in vitro. Anticancer Res. 2006;26(5A):3561–6. [PubMed] [Google Scholar]
- 45.Kurtoglu M, Gao N, Shang J, Maher JC, Lehrman MA, Wangpaichitr M, et al. Under normoxia, 2-deoxy-D-glucose elicits cell death in select tumor types not by inhibition of glycolysis but by interfering with N-linked glycosylation. Mol Cancer Ther. 2007;6(11):3049–58. doi: 10.1158/1535-7163.MCT-07-0310. [DOI] [PubMed] [Google Scholar]