Abstract
We propose an anisotropic diffusion method to denoise and aid the reconstruction of planar objects in three-dimensional images. The contribution of this paper is the development of a planarity function characterizing plate-like structures using an image Hessian’s eigensystem. We then construct a diffusion tensor for anisotropically smoothing plates and satisfying necessary scale-space properties. Our method finds applications in improving the fidelity of highly noisy cell membrane images from confocal microscopy. In dense cellular regions, cell membranes assume linear shapes (planar) between neighbors. The imaging process makes cell membranes appear as diffuse structures owing to the non-uniform fluorescent marker distribution, point-spread function of the optics, and anisotropic voxel resolution which make automatic cell segmentation difficult. We apply diffusion filtering to identify and enhance membranes. We demonstrate the use of our methods on 3D cell membrane images of a zebrafish embryo acquired using fluorescent microscopy and quantify the improvement in image quality.
Index Terms: Anisotropic diffusion filtering, smoothing, fluorescent microscopy, membranes
1. INTRODUCTION
Developmental biologists and researchers studying tissue morphogenesis and cancer are interested in cellular interactions that occur during development of tissues and organs. Their research relies on using quantitative information collected from microscopic time-lapse images that depict the behavior of cells and their organelles including nuclei and membranes [1]. As a result, there is a widespread effort to develop automated microscopy image analysis techniques focused on identifying cellular structures [2, 3]. While there have been numerous research studies involving automated analysis of nuclei images for cell localization, this has not been the case with using membrane images.
In microscopy, cell organelles are first labeled/stained with a marker and imaged using a high-resolution microscope. For example, in Fig. 1, we consider a confocal image wherein fluorescent markers are first tagged to proteins in the nuclei and membranes and then excited by a laser. The fluorescent marker-labeled structures emit signals that are then localized in 3D using suitable optics to form images. Objects such as the nuclei contain a volumetric source of fluorescent protein that can be sufficiently sampled (in a Nyquist-sense) on an imaging grid and reconstructed. Hence, they appear well-resolved with high-fidelity gradients at their boundaries, thereby making their extraction a relatively easy process.
Fig. 1.
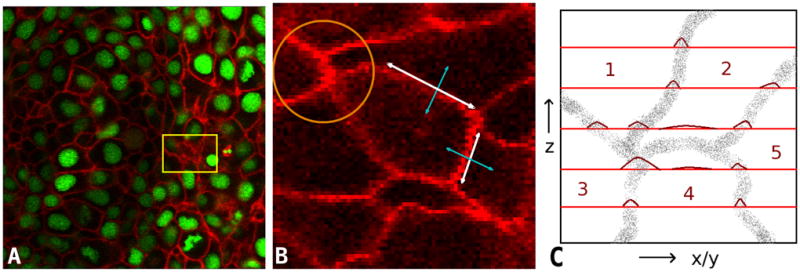
Two channel fluorescence microscopy images of a zebrafish embryo. (a) Linear membranes filaments shown in the red channel and spherical nuclei in the green channel. The yellow rectangle shows a membrane coincident on the x-y optical plane. (b) A zoomed version of a single cell. Planar directions of the membrane are shown by the white double arrow. Orthogonal directions are indicated by the blue arrows. The orange circle shows a membrane vertex which is intensely stained. (c) An illustration of the optical sampling process of membrane point clouds. The x-y planes are shown in red and the intensity profiles on the plane are marked by curves in dark red. Cell membranes imaged ”en face” such as the interface between cells 2 and 4 are poorly reconstructed.
In contrast, membranes may be likened to a thin shell of thickness much smaller than the point spread function; hence, the resolution afforded by current microscopes1. Fluorescent markers sample the shell surface at discrete points. Please refer to Fig. 1(c). Imaging planes (in red) optically slice this shell at large regular intervals. The point spread function of the optics smoothly interpolates light from neighboring markers and creates a diffuse thin wispy membrane structure visible in images. The intensity at a voxel is therefore a function of the number of fluorescent markers in a small neighborhood region of the tissue. It depends on its proximity to membrane junctions, adjacent cell membranes, and marker aggregations. Note that membrane junctions are generally more intense as a result of higher spatial concentration of fluorescent protein markers due to multiple membrane co-localization (orange circle in Fig. 1(b)). Artifacts caused by marker aggregations occur when the fluorescent protein molecules stick together in clumps. Nevertheless, these factors make the membrane intensity highly inhomogeneous thereby affect its suitability to automated image analysis systems.
Goals
The membrane channel provides important quantitative information on cell size, shape and localization outside the nucleus region and the surface area of cell boundaries and also helps in resolving the separation of cells in some instances [3]. Therefore, the goal of this work is to eliminate membrane intensity inhomogeneities and improve the fidelity of the observed signal as much as possible. An important observation that we make in this regard is the linearity of the membranes as tessellations in dense cell regions [4]. We use this fact to design filters to first identify and then enhance membrane signals in planar directions while suppressing noise orthogonal to it.
Contributions
Our main contribution is the development of a planarity function that is selectively maximized at the medial plane for a plate-like structure with some thickness. We design the function to deliberately suppress point and tube-like structures in the images. For a given application, this function can be fine-tuned for robustness to noise by selecting an appropriate scale. An example of this function is shown in Figure 5.
Fig. 5.

Planarity maps
 at σ = (Left) 0.2; (Mid) 0.5; (Right) 1 μm
Our second contribution is the application of the planarity function to develop an anisotropic diffusion process in plate-like structures. We operate on the premise that filtering operations need to be cognizant of interpolating in-plane intensities and smoothing out-of-plane intensities. We design a diffusion tensor whose eigen values are guided by the planarity function response and whose orientation is provided by a local neighborhood Hessian operator. We develop an anisotropic diffusion filter for membrane images in clumped cellular regions.
Related Work
Our methods are inspired by work on vessel-detection in which diffusion filters were designed to detect vessels [5, 6]. They used the fact that eigenvectors of the Hessian point in the directions of principle curvature. At vessel boundaries, the eigenvector with largest eigenvalue is almost normal to the boundary, and the one corresponding to the smallest eigenvalue points along the vessel axis. In the case of membranes, however, the structure of the Hessian changes and filter described above needs to be modified to account for this.
There has not much work devoted to the identification of membrane structures. Tasdizen et al [7] proposed diffusion based method enhancing cell boundaries using the Hessian in 2D only. It relies on using absolute differences of eigen values to design the diffusion tensor. The drawback of this method is that it fails to use the 3D structure of membranes to guide the diffusion process and results in enhancing structures other than membranes.
2. METHODS
Diffusion filtering [8] was first proposed to remove high-frequency noise while avoiding the blurring and localization problems of linear Gaussian smoothing [9]. It is a non-uniform process that has reduced diffusivity at locations having a larger likelihood to being edges. Classical anisotropic diffusion based on image gradients, is unsuitable for differentiating between the different types of surfaces present in the image, which are characterized by their principle curvatures. Therefore, we use a version of anisotropic diffusion [10], where the diffusion tensor is determined by the Hessian ( ) of the image function u, as:
| (1) |
with u: Ω × [0, T] → R, u(x, 0) = f (x) and Neumann boundary conditions.
The regularized Hessian and gradient ∇σ are computed by convolving u(x) with the appropriate derivatives of a Gaussian having bandwidth σ. The diffusion tensor D: ℝ3×3 → ℝ3×3 is a matrix that enforces the directional preference of the diffusion process along the principal directions. Also, in order for the diffusion equation to generate a scale-space of solutions that a) are unique, b) vary continuously with respect to the initial conditions, c) are smooth and d) are information reducing (i.e. do not create new extrema), the diffusion tensor must satisfy the following conditions: i) D is C∞ continuous (i.e. smooth), ii) D is symmetric, and iii) for all g: Ω → ℝ such that |g(x)| < K there exists a positive lower bound ν (K) on the eigenvalues of (i.e. uniform positive definiteness).
We now discuss the design of the planarity function for selectively extracting plate-like structures, which is the core idea of this work and then get back to the design of .
2.1. Planarity Function Design
Let |λ1(x)| < |λ2(x)| < |λ3(x)| be the eigenvalues of
with corresponding eigenvectors v1(x), v2(x), v3(x). The eigen system of the Hessian specifies the principal directions of second-derivatives of the intensity function. We define the planarity of a voxel x (the similarity of the neighborhood
 x to a plate-like structure), as:
 |
(2) |
| (3) |
Here, 0 <
 σ < 1 with larger values indicating more similarity at regularization scale σ. Since, the membrane is brighter than the background, we always have λi ≤ 0 and hence, we set
 σ = 0 when the minimum eigen value λ3 > 0. Here, (α, β, γ, c) are user-tunable scale parameters that depend on the specifics of the imaging modality. A plot of the function
 with all parameters set to 1 is shown in Fig. 2.
Fig. 2.
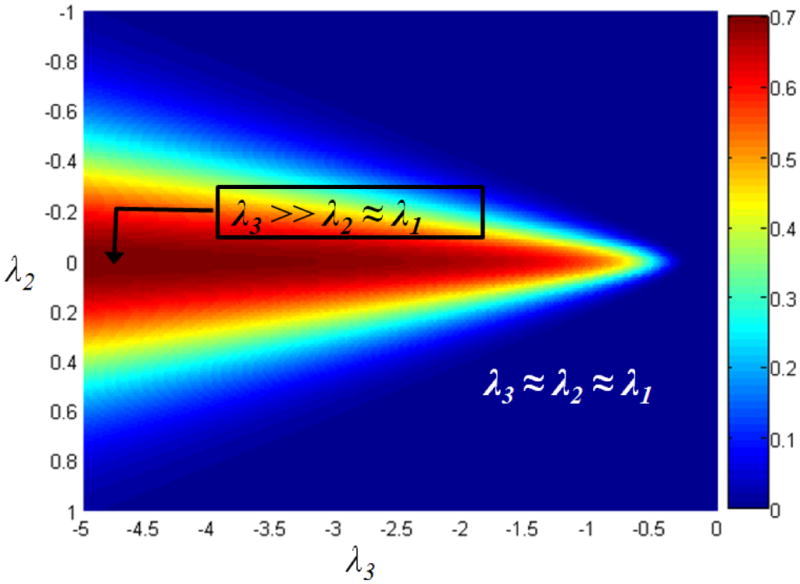
Plot of
 with λ1 = λ2 vs. λ3 and all parameters set to 1.
Foreground vs. background
If λ→ ≈ 0, it indicates image background with minor variations due to noise. This case is quantified by T2, and γ controls the smallest acceptable scale. T0 evaluates to 1 in foreground regions showing intensity variation and is close to 0 in constant intensity regions. Given that membranes have a small thickness, they have large S values and hence qualify as foreground.
When 0 ≈ |λ1| ≈ | λ2| ≪ |λ3|,
 x is similar to a plate of very small thickness. This corresponds to the point indicated in the left half of Fig. 2. So the following cases arise:
1. Plate vs tube
The term A measures the ratio of the largest pair of eigen-values. It is close to 0 for a plate and 1 for a tube. Note that for a tube, 0 ≈ λ1 ≪ λ2 ≈ λ3. Therefore, the term T1 selectively eliminates a tube structure.
2. Plate vs blob
The term B measures the ratio of the smaller pair of eigen-values with the largest one. It is close to 0 and in turn, T2 has values closer to 1. Note that for a blob, λ1 ≈ λ2 ≈ λ3 and T2 ≪ 1 as indicated by the right point in Fig. 2.
Figure 2 shows the values of ρ plotted against λ3 for different values of λ1, λ2, with μ0 = 15, μ1 = 0.1, μ2 = 0.2 and μ3 = 1. It is beyond the scope of this paper, but the planarity function
 σ is smooth. The interested reader is directed to [6] for a proof.
2.2. Diffusion Tensor Design
In order to direct the diffusion along the plane of the membrane and inhibit it in the perpendicular direction, the diffusion tensor is defined as , where V(x) = [v1(x), v2(x), v3(x)]. The diffuseness along the eigen-directions is given by where:
 |
(4) |
where 0 < ε < 1 ≪ ω and s > 1 is a sensitivity factor.
The Λ̃ (x) represents the extent of diffusivity along the principal directions. For large values of
 ,
and
attain high values leading to anisotropic tensor. The effect of this diffusion tensor on ∇σu from eqn. 1 is to stretch it along the principle semi-axis of the disc while contracting it along the perpendicular direction, thereby enhancing diffusion along the membrane. In the converse case of low values of
 , all λ̃i are approximately equal to 1 leading to local isotropic Gaussian smoothing from eqn. 1.
As can be readily seen, the diffusion tensor is C∞ continuous, symmetric, and positive definite, thereby exhibiting the necessary scale-space properties of being well-posed and information reducing.
The numerical implementation of the diffusion equation in its un-regularized form has been shown to be ill-posed. In addition to numerical stability, regularization confers infinite differentiability and robustness to noise [11]. However, selecting the right value of this scale parameter σ vis à vis the size of the membrane in the local neighborhood
 x is essential. Please refer to Fig. 5 where
 has been plotted for different σ for the membrane image of Fig. 4(a). The size of a membrane is smaller than 0.2 μm. When σ is too small as in Fig. 5(a), then small variations due to noise will have relatively large effects. However, when σ > γ3 as in Fig. 5(c), then
 σ (x) (eqn. 2) becomes increasingly insensitive to γ3, adversely impacting the membrane enhancement of the filter. In the next section, we elaborate on setting the appropriate value of σ in our application.
Fig. 4.
(a) The middle slice of a 3D confocal dataset of cell membranes; (b) Perona-Malik; (c) Coherence-enhancing; (d) Our method.
3. RESULTS
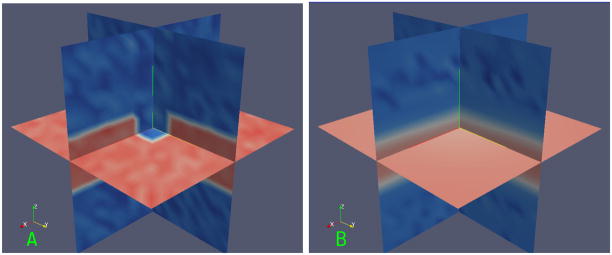
In order to validate our methods, we first created phantom datasets. An example is shown in Figure 3(a). The function f (x, y, z) = 100δ(z−10)+90δ (z−9)+90δ (z−11)+40δ (z−8)+40δ (z−12) is sampled on a grid of pixel dimensions 20 × 20 × 20. A hole of pixel dimensions 4 × 4 × 4 is then placed in the center of the plane. The images are degraded with Gaussian noise (μ = 0, σ = 10). The planar topology is then recovered by our methods with (α, β, γ, s, w, ε, t) = (0.5, 0.5, 5, 1.5, 0.01, 50). We observe (i) the smooth interpolation of planar intensities across the hole; (ii) there is no diffusion of intensities out of the plane and (iii) reduction of Gaussian white noise in the background. In the phantom image, the average foreground/background value was μ = (100.16, −0.887) intensity units with a standard deviation of σ = (10.03, 10.075) respectively, as expected. After smoothing, the mean was at μ = (73.43, 5.73) while the standard deviation dropped to (7.10, 4.91) respectively. Note that the foreground intensity now covers the hole and its mean value decreases. By smoothing out the background noise, its mean increases and the standard deviation reduces. This process was conducted for a geometric series of Gaussian σ in the range [5, 30] and the system was found to be very robust even at (σ = 30). We always found the same data trends as explained above with progressive degradation in quality.
Fig. 3.
(a) Phantom image containing a plane with a through hole. (b) After anisotropic smoothing.
Figs. 4 and 6(a) shows a portion of a confocal image of zebrafish spinal precursor neuron cells. The enhancement of cell membranes requires: (i) closing of gaps in the membranes due to non-uniform staining and (ii) removal of noise and enhancement of background due to light scattering. Filtering with a Gaussian kernel removes noise; however, it also blurs membranes, Figs. 4 and 6(b). Using parameters (C = 5, t = 15) the P-M PDE [8] moves the input image toward a piecewise constant image, Figure 1(c). The continuity of membranes is not enhanced; in fact, it is even disrupted in certain places and feeble membranes are smoothed. The results of the coherence enhancing diffusion PDE [12] is shown in Figs. 4 and 6(c). This filter creates ringing artifacts and as a result closely located noise pixels sometimes get connected. We experimented with the parameters to obtain the best qualitative results (α = 0.001; σ = 1.0; C = 5.0; ρ = 3.0; t = 15). While the membranes are enhanced, they are not necessarily improving the contrast from noisy structures as shown by the red arrows. In Figs. 4 and 6(d), we show the result from our proposed PDE with (α, β, γ, s, w, ε, t) = (0.5, 0.5, 5, 1.5, 0.01, 50). The contrast of the membranes and their continuity are enhanced while feeble membranes are relatively better preserved although the localization of smoothing occurs in a band surrounding the membrane. This is because our filter computes the Hessian requiring second-order derivatives as compared to Weickert’s first-order methods.
Fig. 6.
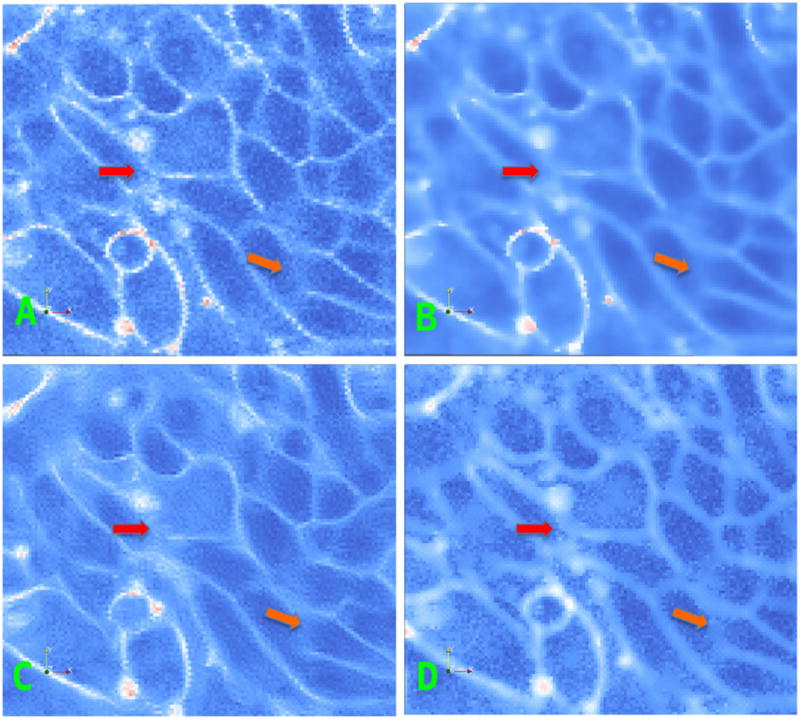
(a) Another field of view; (b) Perona-Malik diffusion; (c) Coherence-enhancing; (d) Our method.
An important contribution of the paper has been the introduction of the planarity function selective to membranes. In Fig. 5, we show images of
 for different scales of σ. While the localization is excellent at high scales, a lot of noise is introduced. Lower scales are marked by missing membrane segments. Therefore, this shows that it is necessary to operate at the right scale. In Fig. 7, we compute a membrane mask from the response at σ = 0.5 and apply it to the response at σ = 0.2. We observe a good localization of the membrane (even feeble ones). A simple global threshold applied at this stages yields a high quality segmentation. Therefore, other sophisticated algorithms can easily be used to get a fine segmentation.
Fig. 7.
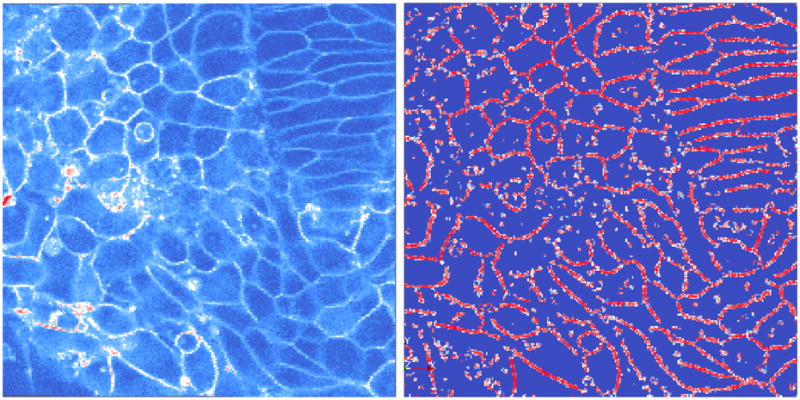
Left: Original image slice of membranes. Right: Output of the planarity function at σ = 0.2 masked by the response at σ = 0.5.
As part of our future work, we plan to explore mathematical processes of backward diffusion to recover intensities diffused orthogonal to the membranes due to the point-spread function of the optics.
Footnotes
The x-y planar resolution is different from the axial resolution in a ratio of 0.2:0.2:1μ m
References
- 1.Megason SG, Fraser SE. Imaging in systems biology. Cell. 2007;130(5):784–795. doi: 10.1016/j.cell.2007.08.031. [DOI] [PubMed] [Google Scholar]
- 2.Keller P, Stelzer E, et al. Reconstruction of zebrafish early embryonic development by scanned light sheet microscopy. Science (New York, NY) 2008 October;322:1065–1069. doi: 10.1126/science.1162493. [DOI] [PubMed] [Google Scholar]
- 3.Megason SG. In toto imaging of embryogenesis with confocal time-lapse microscopy. Methods in Molecular Biology. 2009;546:317–332. doi: 10.1007/978-1-60327-977-2_19. [DOI] [PMC free article] [PubMed] [Google Scholar]
- 4.Luengo-Oroz M, Santos A, et al. Can voronoi diagram model cell geometries in early sea-urchin embryogenesis? ISBI. 2008:504–507. [Google Scholar]
- 5.Canero C, Radeva P. Vesselness enhancement diffusion. Pattern Recogn Lett. 2003;24(16):3141–3151. [Google Scholar]
- 6.Manniesing R, Niessen W. Multiscale vessel enhancing diffusion in ct angiography noise filtering. Inf Process Med Imaging. 2005;19:138–149. doi: 10.1007/11505730_12. [DOI] [PubMed] [Google Scholar]
- 7.Tasdizen T, Whitaker R, Marc R, Jones B. Enhancement of cell boundaries in transmission electron microscopy images. 2005;2:II–129–32 . doi: 10.1109/ICIP.2005.1530008. [DOI] [PMC free article] [PubMed] [Google Scholar]
- 8.Perona P, Malik J. Scale-space and edge detection using anisotropic diffusion. IEEE Trans on Patt Anal and Machine Intell. 1990;12(7):629–639. [Google Scholar]
- 9.Witkin A. Intl Joint Conf on Artificial Intell. Karlsiuhe; West Germany: 1983. Scale-space filtering; pp. 1019–1021. [Google Scholar]
- 10.Frangi A, Viergever M, et al. Multiscale vessel enhancement filtering. MICCAI. 1998:130–137. [Google Scholar]
- 11.Catté F, Lions P, Morel J, Coll T. Image selective smoothing and edge detection by nonlinear diffusion. SIAM Journal of Num Anal. 1992;29(1):182–193. [Google Scholar]
- 12.Weickert J. PhD thesis. Universität Kaiserslautern; 1996. Anisotropic Diffusion in Image Processing. [Google Scholar]


