Abstract
Iron deficiency is one of the major agricultural problems, as 30% of the arable land of the world is too alkaline for optimal crop production, rendering plants short of available iron despite its abundance. To take up apoplasmic precipitated iron, plants secrete phenolics such as protocatechuic acid (PCA) and caffeic acid. The molecular pathways and genes of iron uptake strategies are already characterized, whereas the molecular mechanisms of phenolics synthesis and secretion have not been clarified, and no phenolics efflux transporters have been identified in plants yet.
Here we describe the identification of a phenolics efflux transporter in rice. We identified a cadmium-accumulating rice mutant in which the amount of PCA and caffeic acid in the xylem sap was dramatically reduced and hence named it phenolics efflux zero 1 (pez1). PEZ1 localized to the plasma membrane and transported PCA when expressed in Xenopus laevis oocytes. PEZ1 localized mainly in the stele of roots. In the roots of pez1, precipitated apoplasmic iron increased. The growth of PEZ1 overexpression lines was severely restricted, and these lines accumulated more iron as a result of the high solubilization of precipitated apoplasmic iron in the stele. We show that PEZ1 is responsible for an increase of PCA concentration in the xylem sap and is essential for the utilization of apoplasmic precipitated iron in the stele.
Keywords: Iron Metabolism, Plant, Plasma Membrane, Transgenic, Transport Drugs
Introduction
Increasing crop production is an important strategy to meet the increased demand for food resulting from the rapid population increase (1). Agricultural productivity is severely affected by high soil pH, causing metal ions, especially iron (Fe), to become sparingly soluble and not available to plants (2). Plants growing in high-pH soils develop Fe deficiency symptoms that are manifested as chlorosis (yellowing from partial failure to develop and stabilize chlorophyll), even though mineral soils contain >6% Fe (3).
To take up apoplasmic precipitated Fe, non-graminaceous plants use Strategy I. They release protons, secrete phenolics, reduce Fe(III), and finally take up Fe(II) (4–6). Protons are released via H+-ATPases to increase the solubility of Fe from the root plasma membrane. After solubilization, Fe(III) is reduced to Fe(II) by a membrane-bound Fe(III) reductase oxidase. Then Fe(II) is transported into the root by an iron-regulated transporter (IRT1).3 On the other hand, graminaceous plants take up Fe using the Strategy II system, which relies on a Fe(III) chelation system through the secretion of mugineic acid family phytosiderophores (4, 7). These mugineic acids are secreted to the rhizosphere to chelate Fe(III), and the resulting complex is transported by the Yellow Stripe family transporters (5). Besides using Strategy II, rice plants possess a direct ferrous Fe uptake system that uses the ferrous Fe transporter OsIRT1 but does not include functional Fe(III) chelate reductases (8). In rice, H+-ATPase in roots is not induced under Fe deficiency (5).
In plants, Fe uptake from the apoplasm is well documented at the molecular level, with the exception of phenolics synthesis and efflux. Recently, it has been reported that removal of the secreted phenolics from hydroponic culture solution significantly enhances Fe accumulation and Fe deficiency responses in roots by inhibiting the solubilization and utilization of apoplasmic Fe (9). Moreover, phenolics such as PCA are reported to chelate Fe(III), and solubilizing and reducing it to Fe(II) in vitro (10). In this manner, phenolics can play a significant role for Fe solubilization, and understanding the molecular mechanism of phenolics efflux transport is crucial for developing strategies to reduce Fe deficiency.
Here we show that a rice phenolic efflux transporter controls the concentration of PCA in the xylem sap and is essential for the utilization of apoplasmic precipitated Fe in stele.
EXPERIMENTAL PROCEDURES
Plant Material
For the analysis of knockout or knockdown mutants, Oryza sativa cv. Hwayoung was grown in a 20-liter plastic container containing a nutrient solution of the following composition: 0.7 mm K2SO4, 0.1 mm KCl, 0.1 mm KH2PO4, 2.0 mm Ca(NO3)2, 0.5 mm MgSO4, 10 μm H3BO3, 0.5 μm MnSO4, 0.2 μm CuSO4, 0.5 μm ZnSO4, 0.05 μm Na2MoO4, and 0.1 mm Fe-EDTA. The pH of the nutrient solution was adjusted daily to 5.5 with 1 m HCl (11). For cadmium (Cd) treatments, 4-week-old plants were transferred to a nutrient solution as described above with 10 μm Cd (CdCl2) and grown for 3 days. Seeds from overexpression lines were grown in a pot in a glasshouse under natural light conditions (12).
For Fe deficiency experiments, 4-week-old plants were grown with or without 100 μm Fe for 1 week. In the excess Fe experiment, overexpression lines were grown on Fe-deficient Murashige and Skoog (MS) media for 2 weeks and then transferred to the media containing 1.0 mm Fe-EDTA for 1 week. For calcareous soil experiment, seeds from overexpression lines were grown under Fe-deficient conditions for a week, transferred to a pot containing 900 g of calcareous soil, and grown in a glasshouse under natural light conditions (12).
Genomic PCR
The PEZ1 internal primers 5′-GAAGCAAAAACTGAATCGGAAAA-3′ and 5′-GAGAGGAGGAGAGGCAGAGAGA-3′, located outside the transfer DNA (T-DNA) integration site, were used to confirm the T-DNA integration site and homozygous status of pez1-1. For pez1-2, the PEZ1 internal primers 5′-TTGTTTATCTCGTGTGCTCGTGT-3′ and 5′-GTGGCCCTCAGTGTTATGTTTG-3′ were used. The α-tubulin primers used for PCR were as follows: α-tubulin forward, 5′-TCTTCCACCCTGAGCAGCTC-3′ and α-tubulin reverse, 5′-AACCTTGGAGACCAGTGCAG-3′. PCR was performed with polymerase KOD plus (Toyobo, Osaka, Japan). The annealing temperature was set to 66 °C for all PCR reactions.
Acquisition of PEZ1 cDNA
The full-length rice cDNA clone (1563 bp) of PEZ1 (Os03t0571900-01) was acquired from the rice full-length cDNA database Knowledge-based Oryza Molecular biological Encyclopedia (KOME), subcloned into pENTR/D-TOPO using the pENTRtm/D-TOPO® cloning kit (Invitrogen), and the sequence was confirmed. The information on the genomic structure of this clone was collected from the rice annotation project database (RAP-DB).
Quantitative RT-PCR
Total RNA was isolated from pez1-1, pez1-2, and WT plants grown with or without Cd. Total RNA was treated with RNase-free DNase I (Takara Bio, Otsu, Japan) to remove contaminating genomic DNA. First-strand cDNA was synthesized from 2 μg of RNA using SuperScript II reverse transcriptase (Toyobo) by priming with oligo-d(T)30, the final volume was adjusted to 100 μl, and 2 μl from each sample was used for subsequent reactions. Fragments were amplified by PCR in a SmartCycler (Takara Bio) with SYBR Green I and ExTaqtm real-time PCR version (Takara Bio). The PEZ1 primers used for RT-PCR were as follows: PEZ1 forward, 5′-GCTGTCGTTCTTTCTGTCGGTGGTAATCTC-3′ and PEZ1 reverse, 5′-CCCATTTCTTCTAGGCATGTAGGCTCTCAG-3′. For PEZ1 RT-PCR, the annealing temperature was set to 65 °C (20 s). The α-tubulin primers used for RT-PCR were as follows: α-tubulin forward, 5′-TCTTCCACCCTGAGCAGCTC-3′ and α-tubulin reverse, 5′-AACCTTGGAGACCAGTGCAG-3′. PCR was performed at an annealing temperature of 55 °C (30 s). The size and specificity of the amplified fragments were confirmed by agarose gel electrophoresis and sequencing, respectively.
Metal Concentrations
Leaf or root samples were digested with 3 ml of 13 m HNO3 at 220 °C for 20 min using a MARS XPRESS microwave reaction system (CEM, Matthews, NC) in triplicate. For xylem sap collection, rice plants were detopped at a height of 3 cm from the root. The surface of the excised leaf sheath was wiped gently, and a tube filled with cellulose was placed on the cut end. The entire length of the tube was covered with aluminum foil, and the xylem sap was collected for 30 min. For Cd treatments, 4-week-old plants were transferred to a nutrient solution as described above with 10 μm Cd (CdCl2) and grown for 3 days. Forty-five rice plants were used for xylem sap collection. The xylem sap was collected in cellulose and filtered with a 0.65-μm filtering column (Millipore). The extracted xylem sap was stored at −20 °C until further analysis. Because the amount of xylem sap differed, 36 samples with median values of these xylem sap amounts were selected, and 12 individual samples each were pooled at random into three tubes for further analysis. Xylem samples were digested with 3 ml of 13 m HNO3 at 80 °C for 60 min. After digestion, samples were collected, diluted to 5 ml, and analyzed by inductively coupled plasma atomic emission spectroscopy (ICP-AES) (SPS1200VR, Seiko, Tokyo, Japan) as described previously (12).
LC/MS Data Collection and Analysis
5 μl of xylem sap was added to 5 μl of water or 5 μl of 1 mm PCA (Tokyo Kasei, Tokyo, Japan) as described previously (13). LC/MS analyses were performed using a JSM-T100LC “AccuTOF” (JEOL, Tokyo, Japan) in electrospray ionization mode with a Synergi 4-μm Hydro RP 80A column (4 μm, 80 A, 150 × 2.0 mm; Phenomenex, Torrance, CA). Then, 0.5% formic acid in water and 0.5% formic acid in methanol were used as mobile phases A and B, respectively. The flow rate was constant at 0.300 ml/min, and the mobile phase composition was as follows: 100% A for 3 min, linear increase over 8 min to 35% B, linear increase over 8 min to 100% B, 100% B for 10 min before returning linearly to 100% A over 1 min. Electrospray ionization was used with a desolvent chamber temperature of 300 °C, orifice 1 temperature of 120 °C, electrospray ionization needle voltage of 4000 V, ring lens voltage of 10 V, orifice 1 voltage of 35 V, and orifice 2 voltage of 8 V in negative-ion mode.
PCA Efflux Experiments
The full-length open reading frame of PEZ1 was amplified from pENTR/D-TOPO-PEZ1 with forward and reverse primers as follows: PEZ1, 5′-GGGGGGGAATTCATGGGAAGCTCCGTCAAGGACGC-3′ and 5′-GGGGGGGGATCCTTATTCTGACAACAGAGGTGTCT-3′. The DNA containing PEZ1 was swapped in the modified pYES2 vector (Invitrogen) using EcoRI and BamHI under the control of the T7 promoter (14).
Oocytes of Xenopus laevis frogs were injected with either capped complementary RNA encoding PEZ1 or water and then incubated at 17 °C (14). After 1-day incubation, eight oocytes were each injected with 23 nl of 500 μm 14C-labeled PCA (American Radiolabeled Chemicals, Inc., St. Louis, MO) in an Na Barth's buffer. After 60 min, 650 μl of the buffer was sampled to measure radioactivity. Radioactivity of the sampled external solutions and oocytes was measured using full-spectrum dpm counting in a liquid scintillation analyzer. PCA efflux was expressed as a percentage of the total PCA injected.
Subcellular Localization of PEZ1
The full-length open reading frame of PEZ1 (1563 bp) was amplified with forward and reverse primers as follows: PEZ1, 5′-CACCATGGGAAGCTCCGTCAAGGACGC-3′ and 5′-TTCTGACAACAGAGGTGTCTTAT-3′. The full-length PEZ1 ORF was cloned into pENTR/D-TOPO (Invitrogen) and then subcloned into pH7WGF2 (15) under the control of CaMV35S promoter using the LR recombination reaction (Invitrogen) (16). Onion epidermal cells were transformed using a Biolistic PDS-1000/He particle delivery system (Bio-Rad), and rice transformation was performed using the Agrobacterium method (16). Transgenic plants were grown as described under “Plant Materials.” The GFP fluorescence was monitored as described previously (16).
Yeast Growth Conditions
The PEZ1 ORF was subcloned into the expression vector pDR195 (17) using LR recombinant reaction (Invitrogen) and then introduced by the Li acetate yeast transformation method as described previously (18) into a yeast strain defective in yeast Cd factor (ycf1, unable to sequester Cd to vacuole (19)) and selected for uracil on synthetic defined medium containing agar. Yeast ycf1 cells transformed with the empty pDR195 were used as a control. The transformed yeast cells were grown in liquid synthetic defined medium at 30 °C to an A600 of 1.0 and spotted onto synthetic defined agar medium containing 10 μm CdCl2.
Histochemical Analysis
The 1-kb 5′ upstream region of the PEZ1 gene was amplified using KOD plus polymerase at an annealing temperature of 60 °C by the forward primer 5′-GGGGGGAAGCTTTTTTTTACGGAAACCTTG-3′ and the reverse primer 5′-GGGGGGTCTAGAGTGTGTCGTATGCGTGTC-3′, which contain HindIII and XbaI restriction sites, respectively. The amplified fragment was fused into the pBluescript II SK+ vector, and its sequence was confirmed. The PEZ1 promoter was digested with XbaI and HindIII, and the digested 1-kb fragment was subcloned upstream of the uidA ORF, which encodes β-glucuronidase, in the pIG121Hm vector. Oryza sativa L. cv. Tsukinohikari was transformed (8). Rice plants were grown in a greenhouse for 6 weeks after germination on +Fe MS medium, and the histochemical localization was observed in three independent T2 plants. Roots and stems of transgenic plants were cut with a scalpel into ∼1-cm sections. The sections were embedded in 4% agar and then cut into sections of 80–130 μm using a DTK-100 vibrating microtome (Dosaka EM Co. Ltd, Kyoto, Japan). The sections were incubated at 37 °C for 30 min in GUS reaction buffer (1 mm 5-bromo-4-chloro-3-indolyl-b-d-glucuronide, 3 mm K4[Fe(CN)6], 0.5 mm K3[Fe(CN)6], 50 mm sodium phosphate (pH 7.0), and 20% (v/v) methanol). Following staining, the sections were washed in 70% ethanol for 2 days to remove the chlorophyll and held in 70% ethanol until observation. GUS staining was observed using an Axiophoto microscope (Carl Zeiss), following the manufacturer's instructions.
RESULTS
We focused on genes potentially related to Cd transport in rice. Cd uptake and translocation is partly mediated by the Fe uptake system (20–23). Microarray analysis revealed that several genes potentially related to Cd transport were up- or down-regulated in response to Cd (23). We obtained ∼50 independent T-DNA mutants available from the Rice T-DNA Insertion Sequence Database, grew them in Cd-contaminated soil, and measured the Cd concentration in leaves and seeds. In this process, we isolated two Cd-accumulating mutants that were related to phenolic secretion and named them phenolics efflux zero1 (pez1) 1 and 2. When grown in soil, these mutants accumulated higher Cd amounts in leaves and seeds (Fig. 1, A and B), whereas no difference was observed for leaf dry weight per plant, soil-plant analysis development value (C and D), the concentration of other metals in seed (supplemental Fig. S1, A–D), as well as yield (supplemental Fig. S1E).
FIGURE 1.
The pez1 mutants accumulated Cd. Cd concentration in the leaves (A) and seeds (B) of WT, pez1-1 (1-1), and pez1-2 (1-2) grown in soil. Leaf dry weight (DW) (C) and SPAD value (D) of WT, pez1-1, and pez1-2 grown in soil. Cd concentration in the leaves (E) and roots (F) of WT, pez1-1, and pez1-2 grown in hydroponic culture solution. Columns (means ± S.D.) with different letters are significantly different from each other according to a one-way analysis of variance followed by a Student-Newman-Keuls test. p < 0.05, n = 5 each.
PEZ1 belongs to the multidrug and toxic compound extrusion (MatE) transporter family, a group of proteins with 12–14 transmembrane domains transporting small organic compounds (24). In the WT and in the pez mutants, PEZ1 was up-regulated in leaves and roots under 10 μm Cd conditions (supplemental Fig. S2, A and B). When pez1-1 and pez1-2 plants were grown in the presence of 10 μm Cd, the expression was low in both roots and leaves compared with the WT (supplemental Fig. S2, A and B). In pez1-1, T-DNA was integrated at 449 bp upstream from the ATG start codon of PEZ1 (supplemental Fig. S2C), and under control conditions a decreased expression was detected only in the roots (supplemental Fig. S2B). In pez1-2, T-DNA was integrated into the first intron of PEZ1 (supplemental Fig. S2C), and expression was decreased both in roots and leaves in the presence and absence of Cd (supplemental Fig. S2, A and B). The integration of T-DNA in pez1-1 and pez1-2 was confirmed by using gene-specific primers (supplemental Fig. S2, D and E). When grown in hydroponic solution, pez1-1 and pez1-2 also showed higher Cd concentrations in roots and leaves compared with the WT (Fig. 1, E and F).
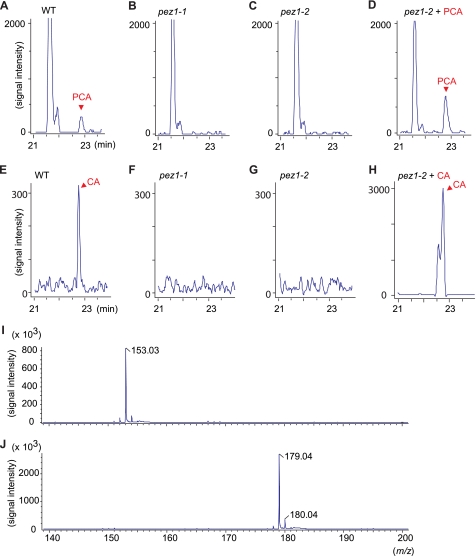
To identify the substrates of PEZ1, LC/MS data profiles of the xylem sap of pez1-1 and pez1-2 mutants were compared with that of the WT. In pez1-1 and pez1-2, a peak at 22.8 min with m/z 153.03 was not detected in the xylem sap of the mutants (Fig. 2, A–D). We searched KNApSAcK, a comprehensive species-metabolite relationship database, and found that this peak corresponds to PCA. In addition to this peak, a peak at 22.7 min with m/z 179.04 was not detected in the xylem sap of both mutants, and a database search suggested that this corresponds to CA (Fig. 2, E–H). Spiking the xylem of pez1-2 with purified PCA and CA confirmed that these peaks correspond to PCA and CA (Fig. 2, I and J).
FIGURE 2.
PCA was decreased in the xylem sap of pez1 mutants. Mass chromatograms [PCA-H]− m/z 152.5–153.5 of the xylem sap of WT (A), pez1-1 (B), pez1-2 (C), and pez1-2 + 500 μm PCA (D). A peak in PCA appeared at 22.8 min. Mass chromatograms [CA-H]− m/z 178.5–179.5 of the xylem sap of WT (E), pez1-1 (F), pez1-2 (G) and pez1-2 + 500 μm CA (H). Also shown are mass spectrometry of PCA (I) and CA (J).
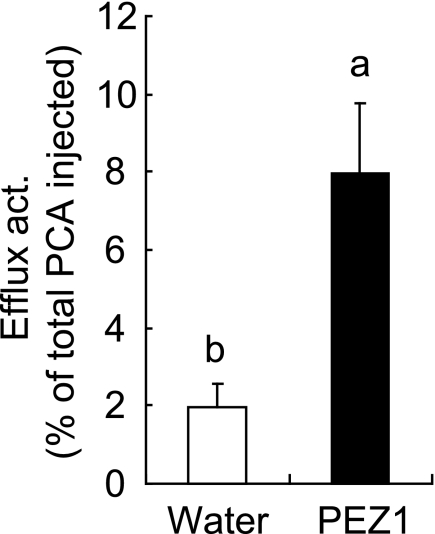
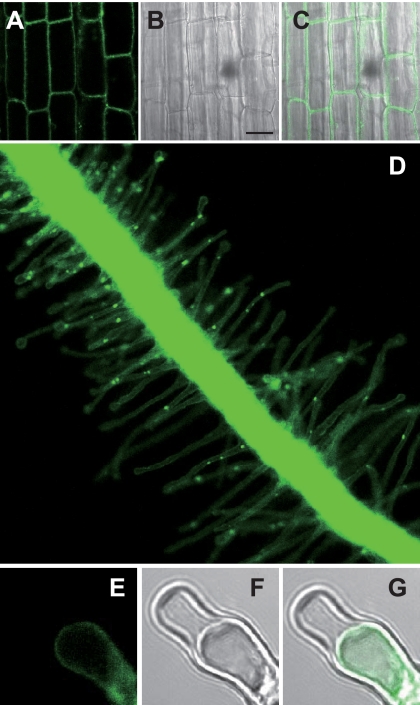
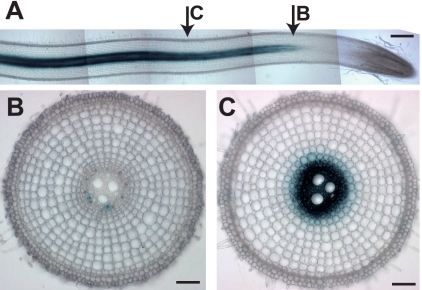
The PCA efflux activity of PEZ1 was investigated in X. laevis oocytes with radiolabeled PCA as a substrate. Results confirmed that PEZ1 transports PCA (Fig. 3). PEZ1 was localized to the plasma membrane in rice root cells, rice root hairs, and onion epidermal cells (Fig. 4, A–G and supplemental Fig. S3, A and B). PEZ1 did not rescue the growth defect of a Cd-sensitive yeast mutant, confirming that PEZ1 does not transport Cd (supplemental Fig. S3, C and D). To further understand its role, the PEZ1 promoter was used to drive the expression of GUS in rice. Histochemical analysis revealed that PEZ1 was expressed in the stele at the base of roots (Fig. 5A). In root transverse sections taken from around 2.5 mm from the root tip, the expression was observed around the xylem vessels, whereas in transverse sections taken at a distance of 5 mm from the root tip, the expression was mainly observed in stele (Fig. 5, B and C).
FIGURE 3.
PCA efflux activity of PEZ1. Oocytes injected with water or PEZ1 cRNA were loaded with 1.0 mm 14C-labeled PCA. Columns (means ± S.D.) with different letters are significantly different from each other according to a one-way analysis of variance followed by a Student-Newman-Keuls test. p < 0.01, n = 8 each.
FIGURE 4.
Subcellular localization of 35Sp-PEZ1-GFP in the rice root. Shown are fluorescence (A), differential interference contrast (B), and overlay (C) images of rice root epidermal cells. Scale bars = 20 μm. D, fluorescence image of a rice root. Also shown are fluorescence (E), differential interference contrast (F), and overlay (G) images of rice root hair cells during plasmolysis when the samples were flooded with 20% sucrose.
FIGURE 5.
Histochemical observation of GUS activity in PEZ1 promoter GUS-transgenic plants. A, longitudinal section. B, transverse section from the base of the root (∼2.5 mm from the root tip). C, transverse section of the root (∼5 mm from the root tip). Scale bars = 500 μm (A) and 100 μm (B and C). Rice plants were grown for 6 weeks after germination on +Fe MS medium.
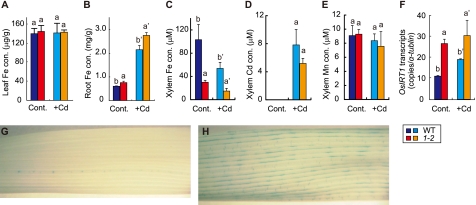
In the pez1-2 mutant, Fe accumulation was observed in the roots and not in leaf, and the differences were higher in the presence of Cd (Fig. 6, A and B). There was no significant difference in Zn, Mn, and Cu concentration between the WT and pez1-2, both in roots and shoots, with or without Cd (supplemental Fig. S4, A–F). On the other hand, Fe concentration in the xylem sap was lower than in the WT, both with and without Cd, whereas there was no significant difference in xylem Cd and Mn concentration (Fig. 6, C–E). Moreover, the expression of OsIRT1 was up-regulated in the mutant roots compared with the control when grown with or without Cd (Fig. 6F). Leaf samples were stained with Perl's solution to check the localization of Fe, and significant differences were found between WT and the pez1-2 mutant for the localization of insoluble Fe(III) (Fig. 6, G and H).
FIGURE 6.
PEZ1 is essential for solubilizing apoplasmic Fe. Fe concentrations in the leaf (A) and the root (B) of WT and pez1-2 grown with or without Cd. Shown are Fe (C), Cd (D), and Mn (E) concentrations in xylem sap. Also shown is expression of OsIRT1 in WT and pez1-2 (F) and Perl's staining of WT (G) and pez1-2 (H). Columns (means ± S.D.) with different letters are significantly different from each other according to a one-way analysis of variance followed by a Student-Newman-Keuls test. p < 0.05, n = 3.
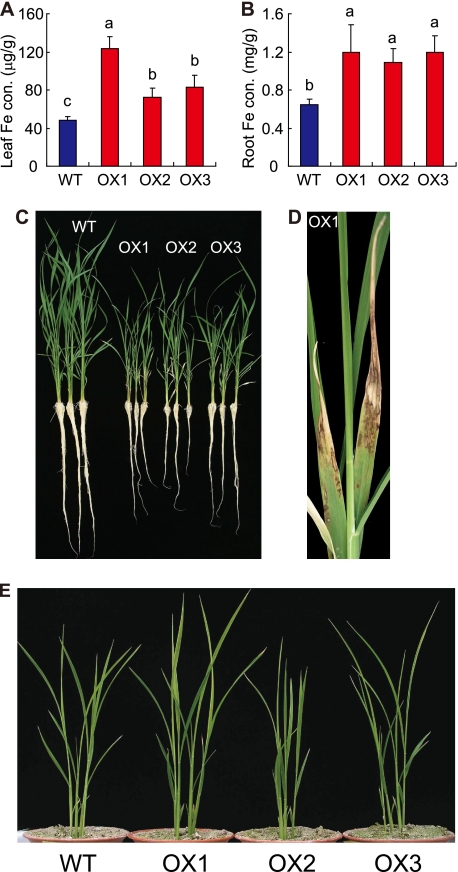
To further understand the role of PEZ1, the PEZ1 overexpression lines were developed and characterized for phenotype and metal concentration. Real-time RT-PCR analysis confirmed that the expression of PEZ1 was significantly high in the PEZ1 overexpression lines, both in roots and shoots (supplemental Fig. S5, A and B). In PEZ1 overexpression lines, the Fe concentration in roots and leaves was higher compared with WT plants under normal nutrient conditions (Fig. 7, A and B). The growth of overexpression lines was severely restricted in terms of plant height and root length, and many necrotic, dark brown spots were observed on old leaves (Fig. 7, C and D). Root and shoot dry weight was significantly reduced in PEZ1 overexpression lines (supplemental Fig. S5, C and D). Moreover, significant differences were observed for root Zn and leaf Mn concentrations, whereas there was no difference for the accumulation of other metals in roots and leaves (supplemental Fig. S5, E–J). Differences were also observed for the SPAD value between PEZ1 overexpression lines and the WT (supplemental Fig. S5K). In a medium containing higher concentrations of Fe, precipitated Fe(III) was not observed in PEZ1 overexpression lines, whereas Fe was precipitated at the WT root surface (supplemental Fig. S6). In a calcareous soil, where plants cannot absorb enough Fe from the rhizosphere because of high pH, PEZ1 overexpression lines grew better in terms of plant height and leaf chlorophyll content than the WT plants, and dark brown spots were not observed in PEZ1 overexpression lines (Fig. 7E and supplemental Fig. S7, A and B).
FIGURE 7.
PEZ1 overexpression lines accumulated more Fe. Fe concentrations in leaves (A) and roots (B) of WT, overexpression (OX) 1, OX2, and OX3 plants under normal nutrient conditions. Columns (means ± S.D.) with different letters are significantly different from each other according to a one-way analysis of variance followed by a Student-Newman-Keuls test. p < 0.05, n = 3. C and D, phenotype of WT and OX1, OX2, and OX3 plants under normal nutrient conditions. E, WT and OX1, OX2, and OX3 plants grown in calcareous soil.
DISCUSSION
We identified two pez1 mutants in which the amount of PCA and CA in the xylem sap were dramatically reduced and Cd accumulation in leaves and seeds was higher (Figs. 1 and 2). PEZ1 localized to the plasma membrane and transported PCA in X. laevis oocytes (Figs. 3 and 4). PEZ1 was mainly localized to the stele in roots (Fig. 5). Fe concentrations increased in the roots of pez1 plants, whereas it decreased in the xylem sap, suggesting that the defect in PCA secretion increases precipitated apoplasmic Fe in the stele and reduces soluble Fe in the xylem (Fig. 6). Thus, rice seems to transport PCA through PEZ1 for the solubilization of precipitated apoplasmic Fe in the root xylem, which may contribute to the long-distance transport of Fe.
Moreover, the PEZ1 overexpression lines accumulated more Fe in roots and leaves because of the high solubilization of precipitated apoplasmic stele Fe, and as a result, the growth of these lines was severely restricted (Fig. 7, A–D). Excess PCA secretion would strongly solubilize Fe precipitated in the stele, leading to the symptoms of Fe excess. On the other hand, the PEZ1 overexpression lines grew better than the WT in calcareous soil, showing that in these lines solubilized Fe by PCA would be available under Fe-limiting conditions (Fig. 7E).
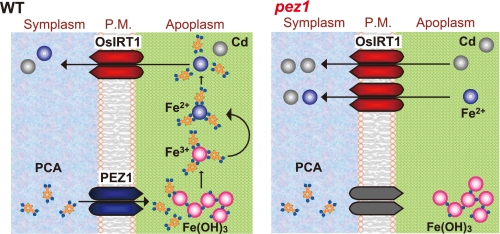
Furthermore, these data indicate that phenolics secretion affects Fe acquisition in rice. Reduced secretion of PCA in the pez1-2 mutant would impair the solubilization of precipitated apoplasmic Fe in the stele, and thereby, the low availability of Fe would lead to the induction of OsIRT1 (Fig. 6E). Moreover, both PEZ1 and OsIRT1 colocalize in stele under control conditions and are induced by Fe deficiency in rice roots (supplemental Fig. S8 (8, 15). The PCA secretion by PEZ1 may complement Fe(II) uptake by OsIRT1 under Fe deficiency and seems to be an integral part of the Fe(II) uptake system in rice (Fig. 8). In red clover, removal of the secreted phenolics significantly enhances root Fe accumulation and triggers Fe deficiency responses because the solubilization and utilization of apoplasmic Fe is inhibited (9). Therefore, the homologues of PEZ1 might also play an important role in PCA efflux and Fe solubilization in red clover.
FIGURE 8.
Models of Fe and Cd uptake mechanisms in WT or pez1. P.M., plasma membrane.
The reason why pez1 accumulate Cd is still unclear. A titration assay indicated that PCA has a much lower affinity for Cd compared with glutathione, suggesting that the amount of PCA·Cd complex is almost negligible in root cells and in the apoplasm (supplemental Fig. S9, A–C). A yeast complementation assay revealed that PEZ1 was not involved in Cd uptake (supplemental Fig. S3, C and D). In the pez1 mutant, Fe concentration in xylem sap was lower, but that in the leaf was not changed (Fig. 6, A and B). In the case of Cd concentration, there was no difference in the xylem, but a higher accumulation was observed in the leaf (Figs. 1C and 6D). These results may suggest that besides xylem transport, Fe and Cd in the mutant may also be transported through symplasmic pathways. OsIRT1 transports Cd in addition to Fe(II) (22). OsIRT1 localization in phloem, its substrate specificity, and increased expression in the pez1 mutant suggests that Fe and Cd uptake and translocation through OsIRT1 could be enhanced in pez1 mutants (Fig. 8) and that increased Cd accumulation in pez1 mutants may be due to the increase in IRT activity in a decreased Fe environment where Cd will have reduced competition.
A study recently reported that plasma membrane-localized maize ZmMATE2, which shares 85% amino acid identity with PEZ1, seems to be involved in Al tolerance, although the substrate is not yet clarified (25). Al was also suggested to activate the release of flavonoid-type phenolic compounds from maize roots, and phenolics were suggested to be effective chelators of Al (26, 27). Therefore, PEZ1 might also play a major role in Al tolerance.
Phenolics may have other roles apart from metal homeostasis. PCA and other phenolics act as antioxidants; free radical scavengers; and inhibitors of nitric oxide synthase, cyclooxygenase, and lipoxygenase in various biological systems (28–30). Moreover, phenolics also serve as allelochemicals and precursors of lignin for microorganisms and plants (31). Therefore, the characterization of PEZ1 would also greatly increase our understanding of phenolic transport in other biological systems.
The present results confirmed that PEZ1 transports PCA and possibly CA for the utilization of apoplasmic precipitated Fe in rice in stele. To our knowledge, this is the first identification of a phenolics efflux transporter in a biological system and provides a molecular basis for understanding the solubilization of precipitated apoplasmic Fe in higher plants.
Supplementary Material
Acknowledgments
We thank Dr. E. Yoshimura for calculating the apparent binding constant of PCA to Cd, Dr. G. An for providing the T-DNA mutants, Dr. Y. Nagamura for supporting our time course analysis, Mr. I. Ogawa for assistance with metal concentration, and other laboratory members for valuable discussion.
This work was supported by the Programme for Promotion of Basic Research Activities for Innovative Biosciences (PROBRAIN) and Grant GMB0001 from the Ministry of Agriculture, Forestry and Fisheries of Japan (Genomics for Agricultural Innovation).

The on-line version of this article (available at http://www.jbc.org) contains supplemental Figs. S1–S9.
- IRT
- iron-regulated transporter
- PCA
- protocatechuic acid
- GUS
- β-glucuronidase
- CA
- caffeic acid
- OsIRT
- Oryza sativa IRT
- T-DNA
- transfer DNA.
REFERENCES
- 1. Tester M., Langridge P. (2010) Science 327, 818–822 [DOI] [PubMed] [Google Scholar]
- 2. Marschner H. (1995) in Mineral Nutrition of Higher Plants, pp. 313–324, Academic Press [Google Scholar]
- 3. Guerinot M. L., Yi Y. (1994) Plant Physiol. 104, 815–820 [DOI] [PMC free article] [PubMed] [Google Scholar]
- 4. Römheld V., Marschner H. (1983) Plant Physiol. 71, 949–954 [DOI] [PMC free article] [PubMed] [Google Scholar]
- 5. Jeong J., Guerinot M. L. (2009) Trends Plant Sci. 14, 280–285 [DOI] [PubMed] [Google Scholar]
- 6. Cesco S., Neumann G., Tomasi N., Pinton R., Weisskopf L. (2010) Plant Soil 329, 1–25 [Google Scholar]
- 7. Bashir K., Inoue H., Nagasaka S., Takahashi M., Nakanishi H., Mori S., Nishizawa N. K. (2006) J. Biol. Chem. 281, 32395–32402 [DOI] [PubMed] [Google Scholar]
- 8. Ishimaru Y., Suzuki M., Tsukamoto T., Suzuki K., Nakazono M., Kobayashi T., Wada Y., Watanabe S., Matsuhashi S., Takahashi M., Nakanishi H., Mori S., Nishizawa N. K. (2006) Plant J. 45, 335–346 [DOI] [PubMed] [Google Scholar]
- 9. Jin C. W., You G. Y., He Y. F., Tang C., Wu P., Zheng S. J. (2007) Plant Physiol. 144, 278–285 [DOI] [PMC free article] [PubMed] [Google Scholar]
- 10. Yoshino M., Murakami K. (1998) Anal. Biochem. 257, 40–44 [DOI] [PubMed] [Google Scholar]
- 11. Ishimaru Y., Suzuki M., Kobayashi T., Takahashi M., Nakanishi. H., Mori S., Nishizawa N. K. (2005) J. Exp. Bot. 56, 3207–3214 [DOI] [PubMed] [Google Scholar]
- 12. Ishimaru Y., Kim S., Tsukamoto T., Oki H., Kobayashi T., Watanabe S., Matsuhashi S., Takahashi M., Nakanishi H., Mori S., Nishizawa N. K. (2007) Proc. Natl. Acad. Sci. U.S.A. 104, 7373–7378 [DOI] [PMC free article] [PubMed] [Google Scholar]
- 13. Kakei Y., Yamaguchi I., Kobayashi T., Takahashi M., Nakanishi H., Yamakawa T., Nishizawa N. K. (2009) Plant Cell Physiol. 50, 1988–1993 [DOI] [PMC free article] [PubMed] [Google Scholar]
- 14. Kato Y., Sakaguchi M., Mori Y., Saito K., Nakamura T., Bakker E. P., Sato Y., Goshima S., Uozumi N. (2001) Proc. Natl. Acad. Sci. U.S.A. 98, 6488–6493 [DOI] [PMC free article] [PubMed] [Google Scholar]
- 15. Karimi M., Inzé D., Depicker A. (2002) Trends Plant Sci. 7, 193–195 [DOI] [PubMed] [Google Scholar]
- 16. Ishimaru Y., Bashir K., Fujimoto M., An G., Itai R. N., Tsutsumi N., Nakanishi H., Nishizawa N. K. (2009) Mol. Plant 2, 1059–1066 [DOI] [PubMed] [Google Scholar]
- 17. Rentsch D., Laloi M., Rouhara I., Schmelzer. E., Delrot S., Frommer W. B. (1995) FEBS Letters 370, 264–268 [DOI] [PubMed] [Google Scholar]
- 18. Bashir K., Ishimaru Y., Shimo H., Nagasaka S., Fujimoto M., Takanashi H., Tsutsumi N., An G., Nakanishi H., Nishizawa N. K. (2011) Nat. Commun. 2, 322 [DOI] [PMC free article] [PubMed] [Google Scholar]
- 19. Li Z. S., Lu Y. P., Zhen R. G., Szczypka M., Thiele D. J., Rea P. A. (1997) Proc. Natl. Acad. Sci. U.S.A. 94, 42–47 [DOI] [PMC free article] [PubMed] [Google Scholar]
- 20. Connolly E. L., Fett J. P., Guerinot M. L. (2002) Plant Cell 14, 1347–1357 [DOI] [PMC free article] [PubMed] [Google Scholar]
- 21. Vert G., Grotz N., Dédaldéchamp F., Gaymard F., Guerinot M. L., Briat J. F., Curie C. (2002) Plant Cell 14, 1223–1233 [DOI] [PMC free article] [PubMed] [Google Scholar]
- 22. Nakanishi N., Ogawa I., Ishimaru Y., Mori S., Nishizawa N. K. (2006) Soil Sci. Plant Nutr. 52, 464–469 [Google Scholar]
- 23. Ogawa I., Nakanishi H., Mori S., Nishizawa N. K. (2009) Plant Soil 325, 97–108 [Google Scholar]
- 24. Omote H., Hiasa M., Matsumoto T., Otsuka M., Moriyama Y. (2006) Trends Pharmacol. Sci. 27, 587–593 [DOI] [PubMed] [Google Scholar]
- 25. Maron L. G., Piñeros M. A., Guimarães C. T., Magalhaes J. V., Pleiman J. K., Mao C., Shaff J., Belicuas S. N., Kochian L. V. (2010) Plant J. 61, 728–740 [DOI] [PubMed] [Google Scholar]
- 26. Kidd P. S., Llugany M., Poschenrieder C., Gunsé B., Barceló J. (2001) J. Exp. Bot. 52, 1339–1352 [PubMed] [Google Scholar]
- 27. Barcelo J., Poschenrieder C. (2002) Environ. Exp. Bot. 48, 75–92 [Google Scholar]
- 28. Ríos J. L., Recio M. C., Escandell J. M., Andújar I. (2009) Curr. Pharm. Des. 15, 1212–1237 [DOI] [PubMed] [Google Scholar]
- 29. Perron N. R., Brumaghim J. L. (2009) Cell Biochem. Biophys. 53, 75–100 [DOI] [PubMed] [Google Scholar]
- 30. Chung T. W., Moon S. K., Chang Y. C., Ko J. H., Lee Y. C., Cho G., Kim S. H., Kim J. G., Kim C. H. (2004) FASEB J. 18, 1670–1681 [DOI] [PubMed] [Google Scholar]
- 31. Popa V. I., Mariana D., Irina V., Anghel N. (2008) Indust. Crops Products 27, 144–149 [Google Scholar]
Associated Data
This section collects any data citations, data availability statements, or supplementary materials included in this article.


