Abstract
The genome of Synechocystis PCC 6803 contains a single gene encoding an aquaporin, aqpZ. The AqpZ protein functioned as a water-permeable channel in the plasma membrane. However, the physiological importance of AqpZ in Synechocystis remains unclear. We found that growth in glucose-containing medium inhibited proper division of ΔaqpZ cells and led to cell death. Deletion of a gene encoding a glucose transporter in the ΔaqpZ background alleviated the glucose-mediated growth inhibition of the ΔaqpZ cells. The ΔaqpZ cells swelled more than the wild type after the addition of glucose, suggesting an increase in cytosolic osmolarity. This was accompanied by a down-regulation of the pentose phosphate pathway and concurrent glycogen accumulation. Metabolite profiling by GC/TOF-MS of wild-type and ΔaqpZ cells revealed a relative decrease of intermediates of the tricarboxylic acid cycle and certain amino acids in the mutant. The changed levels of metabolites may have been the cause for the observed decrease in growth rate of the ΔaqpZ cells along with decreased PSII activity at pH values ranging from 7.5 to 8.5. A mutant in sll1961, encoding a putative transcription factor, and a Δhik31 mutant, lacking a putative glucose-sensing kinase, both exhibited higher glucose sensitivity than the ΔaqpZ cells. Examination of protein expression indicated that sll1961 functioned as a positive regulator of aqpZ gene expression but not as the only regulator. Overall, the ΔaqpZ cells showed defects in macronutrient metabolism, pH homeostasis, and cell division under photomixotrophic conditions, consistent with an essential role of AqpZ in glucose metabolism.
Keywords: Cellular Regulation, Chloroplast, Glucose Metabolism, Glycogen, Membrane Proteins, Water Channel, Photomixotrophic Growth
Introduction
Since identification of the first aquaporin from red blood cells (1), genes encoding aquaporins have been found in both prokaryotic and eukaryotic cells. In animals, abundant major intrinsic protein isoforms are involved in a number of diseases and are known to have a role in the regulation of water homeostasis (2). In plants, aquaporins regulate water permeability and transport in response to external changes in water supply (3). The first aquaporin to be isolated from plant cells was the tonoplast intrinsic protein, γ-TIP (4). This finding established that aquaporins reside not only in the plasma membrane but also in endomembranes, presumably to coordinate water transport inside the cell. In Synechocystis sp. PCC 6803 (henceforth referred to as Synechocystis) a single copy gene encoding an aquaporin homolog, aqpZ, is present in the genome. The functional characteristics of AqpZ and its subcellular localization in Synechocystis have not been determined, although microarray experiments have identified a list of genes induced by hyperosmotic stress in both the wild type (WT) and a ΔaqpZ strain (5). Moreover, loss of aquaporins in microorganisms in general does not result in growth defects under a range of environmental conditions (6). Hence, the question as to the physiological role of aquaporins in microbial cells remains open.
In microorganisms, the best studied aquaporin is the AqpZ protein from Escherichia coli. The aqpZ null mutant forms smaller colonies and has reduced viability in medium with low osmolarity compared with the parental wild-type cells (7). However, another study failed to detect any growth defects of an aqpZ disruption mutant under any condition tested (8). Although wild-type E. coli cells have higher water permeability compared with an aqpZ null mutant, it has not been demonstrated that aquaporins are important for proper osmotic adjustment (9). Although the physiological relevance of E. coli AqpZ remains unclear, other functions of aquaporins that are related to specific ecological lifestyles or developmental stages have received increased attention (6, 10). Some aquaporin isoforms mediate permeation of glycerol, H2O2, CO2, silicon, or boron in addition to water (11, 12). The range of specificities of aquaporins implies that they are involved in processes as diverse as nutrient acquisition, control of development, and growth and defense responses against environmental stress.
Cyanobacteria are prokaryotic microorganisms that perform oxygenic photosynthesis and are adapted to a regular cycle of light and dark periods, in which they are different from non-photosynthetic microorganisms. In most species of cyanobacteria, glycogen accumulated during the day serves as the predominant metabolic fuel at night. Glucose derived from glycogen or supplied exogenously is catabolized via the oxidative pentose phosphate pathway, glycolysis, and the tricarboxylic acid (TCA) cycle, leading to the production of ATP and carbon skeletons. A glucose-tolerant strain of the cyanobacterium Synechocystis has been isolated previously (13). These cells grow photoautotrophically under light conditions but are also capable of photomixotrophic growth or light-activated heterotrophic growth in glucose-supplemented media (14).
In the present study, we determined the membrane localization and investigated the physiological role of aquaporin AqpZ in Synechocystis. The addition of glucose to ΔaqpZ cells triggered structural aberrations and morphological abnormalities. Moreover, ΔaqpZ cells growing on medium containing glucose accumulated more glycogen, and their glucose catabolysis was down-regulated. These data suggest that AqpZ plays a crucial role in the regulation of glucose metabolism under photomixotrophic conditions. To our knowledge, this is the first evidence of a physiological role of AqpZ in addition to its role in the osmotic stress response.
EXPERIMENTAL PROCEDURES
Plasmid Construction
The aqpZ coding region of Synechocystis slr2057 was amplified from genomic DNA by PCR using gene-specific primers (sense, 5′-CAGTAGATCTATGAAAAAGTACATTGCTG-3′; antisense, 5′-CAGTGCTAGCTCACTCTGCTTCGGGTTCG-3′). The resulting PCR product was cloned into the BglII and NheI sites of pXβG-ev1 (1). To create Myc-tagged AqpZ, another set of primers (sense, 5′-CATGGAATTCCATGAAAAAGTACATTGCTG-3′; antisense, 5′-CAGTGCTAGCTCACTCTGCTTCGGGTTCG-3′) was used to amplify the coding region of aqpZ from genomic DNA by PCR, and the resulting PCR product was cloned into the EcoRI and NheI sites of pXβG-ev1, placing it in frame with the N-terminal Myc tag contained in the vector. The correct frame was verified by sequencing. Myc-Y69 (AQP-3) from C. elegans and the human aquaporin hAQP1 were used as controls (1).
Expression in Xenopus Oocytes and Measurement of Water Permeability
Capped cRNAs were synthesized in vitro from XbaI-linearized pXβG-ev1 plasmids using the mMESSAGE mMACHINE T3 kit (Ambion, Austin, TX). Defolliculated Xenopus laevis oocytes were injected with 5 or 10 ng of cRNA or diethyl pyrocarbonate-treated water (1, 15). Injected oocytes were incubated for 2–3 days at 18 °C in 200 mosm modified Barth's solution (10 mm Tris-HCl (pH 7.6), 88 mm NaCl, 1 mm KCl, 2.4 mm NaHCO3, 0.3 mm Ca(NO3)2, 0.4 mm CaCl2, 0.8 mm MgSO4). An oocyte swelling assay was used to determine the osmotic water permeability, Pf (1). Oocytes were transferred to modified Barth's solution diluted to 70 mosm with distilled water, and the time course of volume increase was monitored at room temperature by video microscopy with an on-line computer (16, 17). The relative volume (V/V0) was calculated essentially as described by Preston et al. (1). The relative volume (V/V0) was calculated from the area at the initial time (A0) and after a time interval (At): V/V0 = (At/A0). The coefficient of osmotic water permeability (Pf) was determined from the initial slope of the time course (d(V/V0)/dt), initial oocyte volume (V0 = 9 × 10⁻⁴ cm3), initial oocyte surface area (S = 0.045 cm2), and the molar volume of water (Vw = 18 cm3/mol): Pf = (V0 × d(V/V0)/dt)/(S × Vw × (osMin − osMout)).
Oocyte Immunofluorescence and Confocal Microscopy
Oocytes were incubated in fixing solution (80 mm Pipes, pH 6.8, 5 mm EGTA, 1 mm MgCl2, 3.7% formaldehyde, 0.2% Triton X-100) at room temperature for 4 h, transferred to methanol at −20 °C for 24 h, equilibrated in PBS (3.2 mm Na2HPO4, 0.5 mm KH2PO4, 1.3 mm KCl, 135 mm NaCl, pH 7.4) at room temperature for 2 h, incubated in PBS with 100 mm NaBH4 at room temperature for 24 h, and bisected with a razor blade (18). Fixed oocytes were blocked in PBS containing 2% BSA for 1 h at room temperature and then incubated at 4 °C with the anti-AqpZ antibody (see below) for 24 h followed by incubation with Alexa Fluor 488 goat anti-rabbit IgG in PBS containing 2% BSA for 24 h. Samples were mounted in Fluoromount-G (Southern Biotechnology Associates) and visualized with a PerkinElmer UltraView LCI confocal laser-scanning microscope.
Oocyte Membrane Extraction and Immunoblotting
For each sample, 10 oocytes were homogenized together by pipetting up and down in hypotonic lysis buffer (7.5 mm sodium phosphate, 1 mm EDTA, pH 7.5) containing a protease inhibitor mixture (Sigma-Aldrich) (19). The oocyte yolk was removed by discarding the pellet after a centrifugation at 735 × g and 4 °C for 10 min. The supernatant was then centrifuged at 200,000 × g, 4 °C, for 1 h. The pellet containing the oocyte membrane fraction was solubilized in buffer (50 mm Tris-HCl (pH 8.0), 50 mm NaCl, 50 mm EDTA-2Na, 10% (w/v) glycerol, and 2% SDS). Total protein content was determined by the bicinchoninic acid (BCA) assay method (Pierce). Equal amounts of protein were separated by SDS-PAGE on a 12% gel. Proteins were transferred to a polyvinylidene difluoride (PVDF) membrane, probed with either anti-AqpZ antibody (see below) or anti-Myc antibody (Santa Cruz Biotechnology, Inc., Santa Cruz, CA) followed by horseradish peroxidase-conjugated donkey anti-rabbit IgG (Amersham Biosciences). The enhanced chemiluminescence detection system (Amersham Biosciences) was used to visualize the immunoreactive proteins by exposure to x-ray films.
Isolation of Synechocystis Membranes
Thylakoid and plasma membrane fractions were prepared from Synechocystis cells as described previously (20, 21). An anti-AqpZ antibody was raised against two synthetic peptides with the sequences NH2-GSNPLATNGFGDHS-COOH and NH2-VLEDLGRPEPEAE-COOH (Operon, Tokyo, Japan). Polyclonal antibodies raised against the plasma membrane nitrate transporter NrtA (22) or against the thylakoid membrane proteins NdhD3 and NdhF3 (23, 24) were used to identify the Synechocystis plasma membrane, or thylakoid membrane fractions, respectively. Proteins were separated by SDS-PAGE on a 12.5 or 15% gel and then transferred to PVDF membranes. Membranes were incubated for 1 h with the primary antibody (1:2000 in blocking buffer), followed by incubation for 30 min with the secondary antibody (horseradish peroxidase-conjugated goat anti-rabbit IgG (Amersham Biosciences; 1:1000)) and subsequently developed by ECL (Amersham Biosciences).
Immunolabeling and Electron Microscopy
Synechocystis cells grown to an OD730 of about 1.0 in BG11 medium were fixed with 50 mm phosphatase buffer containing 5% glutaraldehyde and 2% osmium tetroxide (pH 7.2). The samples were dehydrated through a graded acetone series and embedded in Spurr's resin and polymerized. Ultrathin sections were first labeled with AqpZ antiserum (1:20) in Tris-buffered saline and then with 12-nm colloidal gold particles coupled to goat anti-rabbit IgG. IgG was purified from the serum using the MelonTM Gel IgG spin purification kit (Pierce). The sections were stained with uranyl acetate followed by lead citrate solution and examined with a transmission electron microscope (H-7500, Hitachi).
Bacterial Strains and Culture Conditions
The GT (glucose tolerance) strain of Synechocystis sp. PCC 6803 and its derivatives were grown at 30 °C in BG11 medium (25) buffered with 20 mm TES2-KOH (pH 8.0) under aerobic conditions. Solid medium consisted of BG11 buffered at pH 8.0, with 1.5% agar, and 0.3% sodium thiosulfate. To test the effects of pH on growth of Synechocystis cells, a range of BG11 media were prepared by replacing TES buffer with MES buffer for pH 6.5, TES buffer for pH 7.0–8.0, Bicine buffer for pH 8.5, and CHES buffer for pH 9.0–10.0. Continuous illumination was provided by white fluorescent lamps (50 μmol of photons m−2 s−1). For growth in the dark, culture vessels were wrapped with aluminum foil. For light-activated heterotrophic growth, BG11 plates supplemented with 5 mm glucose were incubated in the dark with a daily 15-min pulse of white light. Unless otherwise stated, cells were grown in volumes of 30 ml in flasks. In all experiments, cells grown in fresh BG11 media as precultures were transferred to BG11 (photoautotrophic growth condition) or BG11 containing 5 mm glucose (photomixotrophic growth condition) at an OD730 = 0.05.
Construction and Isolation of Mutants
In this study, several mutant strains (ΔglcP (sll0771), Δsll1961, and ΔaqpZ/ΔglcP) were generated by homologous recombination using plasmids described elsewhere (21). The plasmids for disruption of the glcP or sll1961 gene contained an insertion of a kanamycin (Kmr) resistance cassette in the middle of the respective coding sequence. For reintegration of the Synechocystis aqpZ (slr2057) gene into the genome of the ΔaqpZ cells, the full-length coding sequence of aqpZ was amplified by PCR using an NdeI site-containing forward primer 5′-CAGTCATATGATGAAAAAGTACATTGCTG-3′ and SalI site-containing reverse primer 5′-CAGTGTCGACTCACTCTGCTTCGGGTTCG-3′. The NdeI-SalI DNA fragment encoding AqpZ was inserted into the corresponding sites in p68TS4OxCm and integrated by homologous recombination into targeting site 4 of the chromosomal DNA of Synechocystis ΔaqpZ cells (21).
Immunoblot Analysis
Cultures were grown to a cell density of OD730 = 1.0 and then transferred to fresh BG11 medium either with or without 5 mm glucose. The cells were lysed mechanically by vortexing with glass beads, and the proteins were separated by SDS-PAGE (12.5 or 15% gels) and then transferred to PVDF membranes. The membranes were probed with anti-AqpZ antibody and anti-OpcA antibody (26, 27). The membranes were incubated for 1 h with the primary antibody (1:2000 in blocking buffer) and then incubated for 30 min with the secondary antibody (horseradish peroxidase-conjugated goat anti-rabbit IgG (1:1000)) and subsequently subjected to chemiluminescence detection.
Assay of Glucose Uptake
Cells were collected at mid-exponential phase by centrifugation at 5,000 × g for 5 min and then resuspended in BG11 supplemented with 5 mm glucose at an OD730 of 0.05. Glucose uptake was determined by measuring the concentration of glucose in the medium enzymatically using the d-glucose kit (Roche Applied Science, R-Biopharm), following the manufacturer's instructions. Aliquots (200 μl) of the cultures were harvested every 12 h and centrifuged at 1,500 rpm for 2 min, followed by the determination of glucose concentration in the supernatant.
Optical and Transmission Electron Microscopy
Optical microscopy was performed with a microscope (Axioskop FL, Carl Zeiss, Gottingen) equipped with a high definition image capture camera (HC-1000, Fujix, Tokyo) as described previously (21, 28). The cell size was analyzed using ImageJ software (National Institutes of Health, Bethesda, MD) and beads of a defined diameter (3.005 ± 0.027 μm) as size standards. Cells grown under either photoautotrophic or photomixotrophic conditions were harvested. Cells were fixed in 4% paraformaldehyde and 2% glutaraldehyde in 100 mm cacodylate buffer (pH 7.2) and then postfixed in 1% osmium tetroxide in 50 mm cacodylate buffer. Samples were dehydrated through a graded methanol series, then embedded in Epon812 resin (28). The ultrathin sections were stained with uranyl acetate followed by lead citrate solution and examined with a 1010 transmission electron microscope (JEOL) at 80 kV (28).
Analysis of Cell Size Distribution
Cell size distribution was measured using a particle size distribution analyzer (CDA-1000X, Sysmex). Samples (100 μl) were taken from the cultures at the indicated intervals and diluted 100–500 times with modified physiological saline (0.45% sodium chloride, 144 mosm) prior to performing the measurements.
Determination of Glycogen Content
Analysis of the intracellular glycogen content was performed as described elsewhere (29). The glucose produced by acid hydrolysis was quantified using a colorimetric assay (30).
E. coli Mutants and Growth Conditions
Deletion of chromosomal genes in E. coli was performed as described previously (31). E. coli MA02 (glpF::km) and E. coli MA03 (aqpZ::cm/glpF::km) were generated from the E. coli K-12 W3110 strain using the following primer sets: for aqpZ (JW0859) gene disruption, primers ΔEcAqpZ-PS1 (5′-CTATAAAACGACCATATTTTTCACAGGGTCAATTTTTAATTGTGGTGGATGTGTAGGCTGGAGCTGCTTC-3′) and ΔEcAqpZ-PS2 (5′-AACAACATCTTAAAAAAAGGCCTGACATTACGCCAGGCCTTCTGCGTTAACATATGAATATCCTCCTTAGT-3′); for glpF (JW3898) gene disruption, primers ΔEcGlpF-PS1 (5′-GTCCGTGACTTTCACGCATACAACAAACATTAACTCTTCAGGATCCGATTGTGTAGGCTGGAGCTGCTTC-3′) and ΔEcGlpF-PS2 (5′-GCGCAACGATATATTTTTTTTCAGTCATGTTTAATTGTCCCGTAGTCATACATATGAATATCCTCCTTAGT-3′). We removed the kanamycin and chloramphenicol resistance genes from E. coli MA02 and E. coli MA03 to generate strains MA05 (glpF−) and MA06 (aqpZ−/glpF−) using the FLP-mediated recombination method (31). Bacterial strains were routinely plated on LB or M9 agar medium containing 50 mg/liter ampicillin. For overnight liquid cultures, bacterial strains were grown aerobically at 30 °C in M9 modified minimal medium with 0.2% casamino acids, 100 mg/liter ampicillin, and 10 mm maltose. Growth was monitored by measuring the A600 of the cultures in M9 modified medium supplemented with 2 mm glycerol (32).
Metabolite Profiling
Cultures were harvested by centrifugation at 15,000 × g at 4 °C for 2 min at the times indicated and washed twice with 1 ml of ice-cold distilled water to remove dead cells, and then cell pellets were frozen in liquid nitrogen. Each sample was extracted, derivatized, and analyzed by gas chromatography-time-of-flight mass spectrometry (GC/TOF-MS) as described (33–36). We used lyophilized samples for analysis. Each sample was prepared using 2 mg, dry weight, of cells for GC/TOF-MS analysis. Finally, 22 μg of fresh weight of the derivatized extract was injected into the GC/TOF-MS. Nonprocessed data were exported to the netCDF format using ChormaTOF software (version 3.22, Leco) for further data analysis. The raw data were processed using a custom script as described by Jonsson et al. (33, 34) to perform base-line correction, alignment, and peak deconvolution. Metabolites were identified by comparing their mass spectrum and retention time index with those generated for reference compounds analyzed on our instrumentation as well as those in the MS and retention time index libraries in the Golm Metabolome Database (37, 38).
Analysis of Metabolite Data
Analytical bias in metabolite measurements was controlled using cross-contribution-compensating multiple standard normalization (39) with 16 internal standard peaks. Metabolite peaks with more than 30% missing values were removed. Analysis of variance for examining correlation with glycogen levels and cell diameter was fitted for each metabolite. The formula for examining correlation with duration of culture, glycogen content, and cell diameter is shown in Fig. 8A. Model parameters were calculated using LIMMA (40) for the statistical environment R project (see the R Project site on the World Wide Web). p values were false discovery rate-adjusted to correct for multiple testing. The model used for studying the effect of genotype, g, glycogen level, d, and cell diameter, p, on the estimated level, m, of metabolite i in sample j was as follows,
where g:d and g:p are the interactions between genotype and glycogen level and between genotype and cell diameter, respectively, β is the intercept, and ϵ is the error. We furthermore considered the following,
to examine interaction between the same metabolite levels and the duration of culture a.
FIGURE 8.
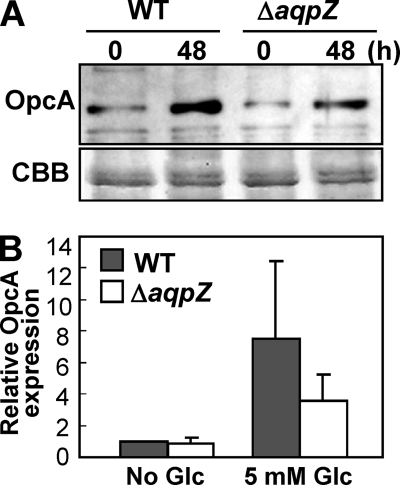
Glucose-induced down-regulation of glucose-6-phosphate dehydrogenase in ΔaqpZ cells. A, Western blot analyses of OpcA, a protein essential for glucose-6-phosphate dehydrogenase activity in the pentose phosphate pathway in protein extracts from WT and ΔaqpZ cells (top). The cells were exposed to 5 mm glucose for 48 h prior to extraction of proteins. Each lane was loaded with 3 μg of protein. Total protein (CBB) served as a loading control (bottom). B, the relative expression level of AqpZ protein was calculated by densitometry in relation to the sample without glucose. Data are mean ± S.D. (error bars) of values from three independent experiments.
Oxygen Evolution Measurements
Cells grown under photoautotrophic or photomixotrophic conditions for 5 days were harvested by centrifugation at 5,000 × g at room temperature and resuspended in 20 mm TES buffer, pH 8.0, at an OD730 = 1.0. Cell suspensions were illuminated with white light at 1000 μmol of photon m−2 s−1, and oxygen evolution was measured using a Clark-type electrode at 25 °C. For the determination of whole chain photosynthetic electron transport activities, cell suspensions were supplemented with 2 mm sodium bicarbonate. PS-II-mediated electron transport activities were measured in the presence of 1 mm 1,4-benzoquinone and 0.8 mm K3Fe(CN)6 in the cell suspension (41).
RESULTS
AqpZ-mediated Water Transport Was Insensitive to Inhibition by Mercury in Xenopus Oocytes
In order to evaluate its water transport activity, Synechocystis AqpZ was expressed in Xenopus oocytes. Correct expression of wild-type AqpZ or a Myc-tagged version in this system was confirmed by Western blot using either an antibody generated against Synechocystis AqpZ (see “Experimental Procedures”) or an anti-Myc epitope antibody. Both proteins, wild-type AqpZ and Myc-tagged AqpZ, were detected in protein extracts of oocytes expressing the respective protein (Fig. 1A, left). Myc-tagged C. elegans aquaporin (Myc-Y69) was used as a positive control (Fig. 1A, right). The specificity of the anti-AqpZ antibody was also confirmed in this experiment. Confocal microscopy of immunolabeled oocytes showed that AqpZ was localized to the oocyte plasma membrane (Fig. 1B). Oocyte swelling assays were performed to measure AqpZ activity. Oocytes expressing either wild-type AqpZ or the Myc-tagged version exhibited a significant increase in osmotic water permeability (Pf) when compared with water-injected cells (Fig. 1, C and D). This indicated that Synechocystis AqpZ conferred water permeability.
FIGURE 1.
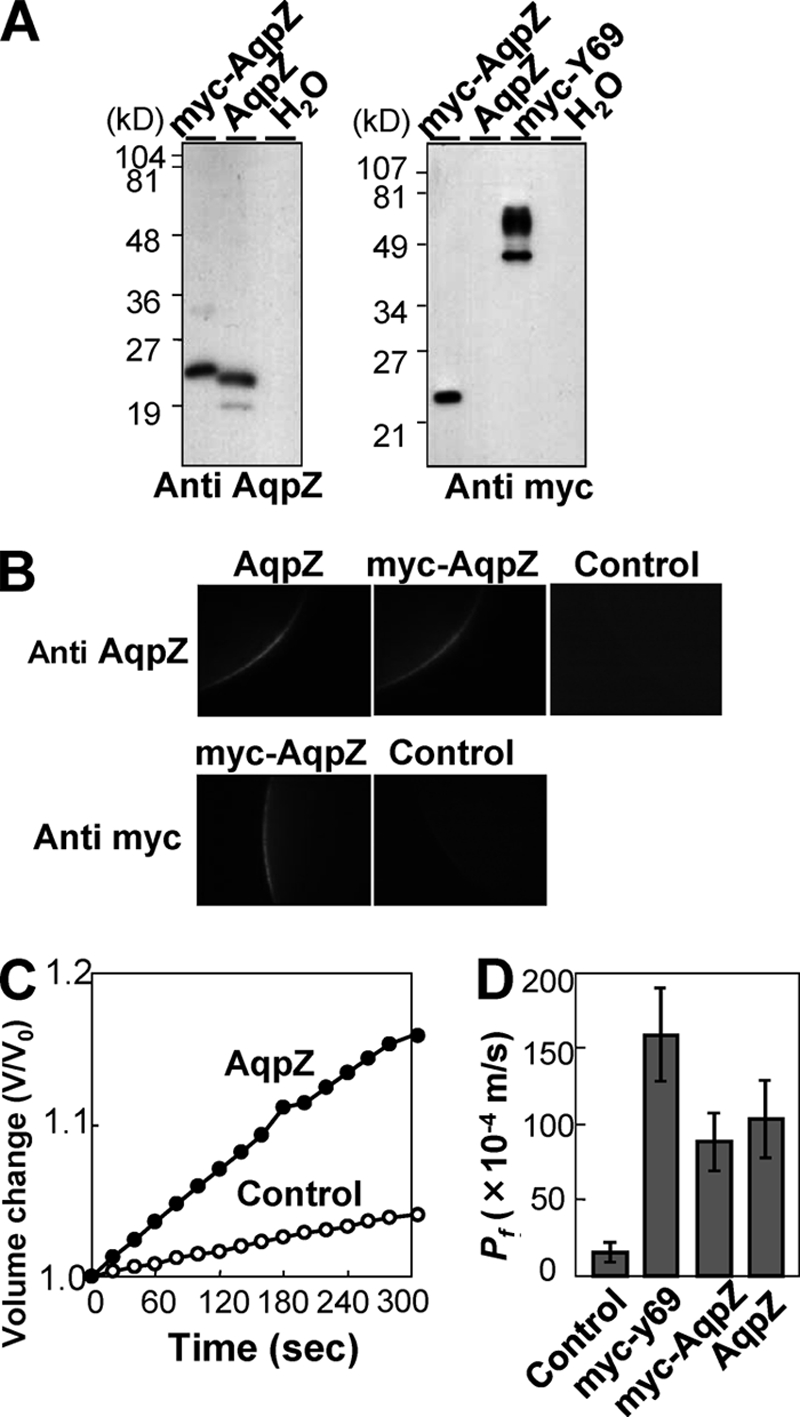
Expression of Synechocystis AqpZ in oocytes. A, immunoblotting of isolated membrane fractions from oocytes injected with water or expressing Synechocystis AqpZ, Myc-AqpZ, or Myc-tagged C. elegans aquaporin (Myc-Y69). Blots were probed with either anti-AqpZ (left) or anti-Myc antibodies (right). B, confocal microscopy images of oocytes injected with water (control) or expressing Synechocystis AqpZ or Myc-AqpZ. Oocytes were immunolabeled with anti-AqpZ antibodies (top row) or anti-Myc antibodies (bottom row) followed by an Alexa Fluor 488-conjugated secondary antibody. C, time-dependent osmotic swelling of water-injected oocytes and oocytes expressing Synechocystis AqpZ. D, osmotic water permeability (Pf) of Synechocystis AqpZ, Myc-AqpZ, or C. elegans Myc-Y69 expressed in Xenopus oocytes. Osmotic swelling assays were performed at 20 °C (mean ± S.D. (error bars), n = 6–7).
AqpZ Is Localized to the Plasma Membrane
Fractions of plasma and thylakoid membranes were prepared by sucrose density gradient fractionation followed by aqueous polymer two-phase partitioning (20, 21, 24). As shown in Fig. 2A, a single protein band of the corresponding molecular mass (25.5 kDa) of AqpZ was detected by Western blot in the plasma membrane fraction, which was identified by the presence of the plasma membrane marker protein NrtA (22). No AqpZ protein was detected in the thylakoid membrane fraction, which was identified by the presence of NdhD3 and NdhF3 (23, 24). In addition, the membrane localization of the AqpZ protein was determined by immunogold labeling followed by electron microscopy. A cross-section of Synechocystis wild-type cells grown under non-stress conditions showed gold particles decorating the plasma membrane when incubated with the AqpZ antiserum (Fig. 2B). Only a small amount of the label was found in other locations. Control experiments with the ΔaqpZ strain did not show any significant labeling (supplemental Fig. S1). These results indicate that AqpZ was primarily localized in the plasma membrane of Synechocystis.
FIGURE 2.
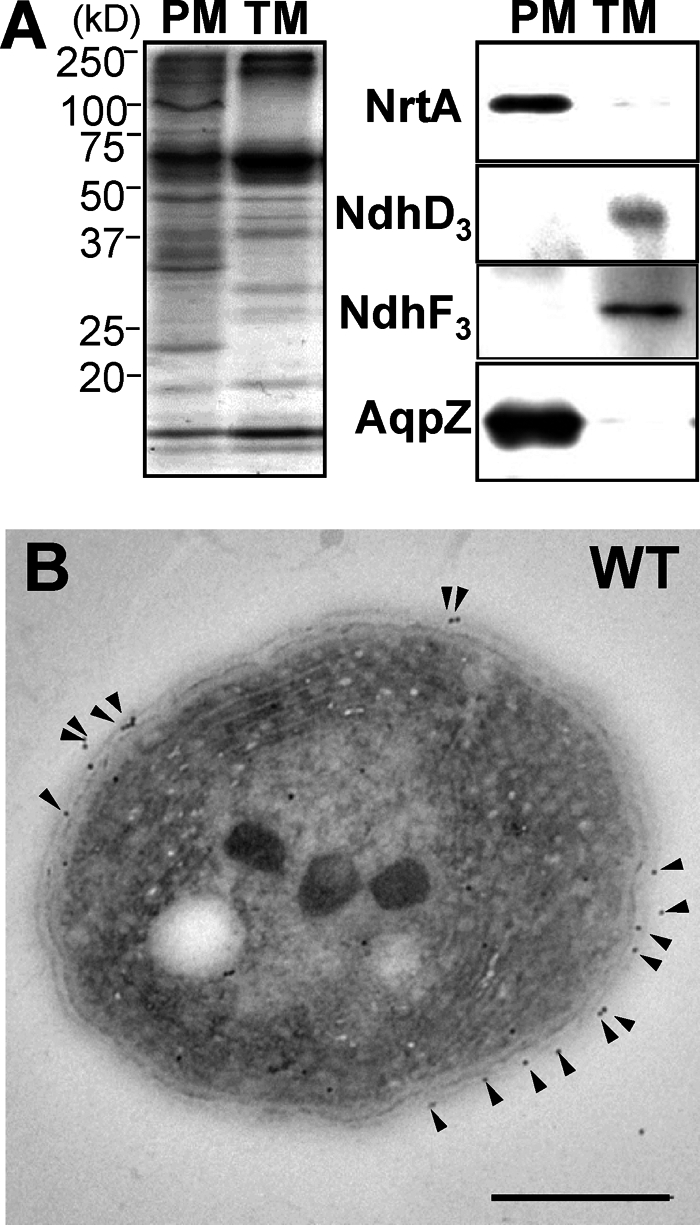
Membrane localization of AqpZ in Synechocystis. A, plasma membrane localization of AqpZ. Plasma membranes (PM) and thylakoid membranes (TM) were isolated by sucrose density fractionation followed by aqueous polymer two-phase partitioning. Shown are Coomassie Brilliant Blue staining (left) and immunoblotting (right) of the plasma membrane and the thylakoid membrane fractions from wild-type Synechocystis. NrtA (marker for the plasma membrane fraction) and NdhD3 and NdhF3 (markers for the thylakoid membrane fraction) were detected on Western blots using the corresponding antibodies. B, cross-section of Synechocystis wild-type cell immunolabeled using an anti-AqpZ antibody. AqpZ protein, indicated by the presence of gold particles (arrowheads), was localized in the plasma membrane. Bar, 500 nm.
Synechocystis Cells Lacking the Aquaporin AqpZ Were More Sensitive to Glucose in the Medium
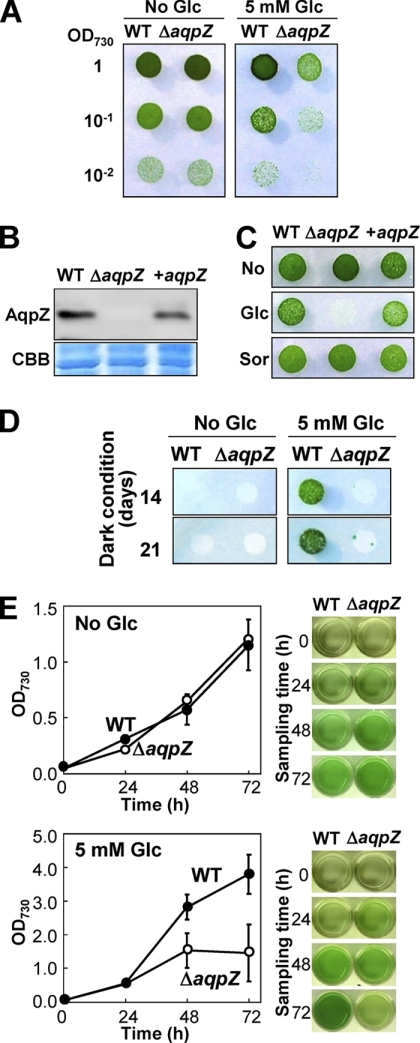
When a glucose-tolerant wild-type strain of Synechocystis PCC 6803 and the aquaporin-deficient mutant, ΔaqpZ, derived from it were grown on BG11 plates in the absence of glucose, both grew equally well (Fig. 3A, left). However, the addition of 5 mm glucose to the BG11 medium strongly inhibited the growth of the ΔaqpZ strain (Fig. 3A, right). To confirm that lack of AqpZ was the reason for this sensitivity of ΔaqpZ cells to glucose, we reintroduced the aqpZ gene into a neutral site of the ΔaqpZ genome. The complementation construct consisted of aqpZ under control of the trc promoter, the resulting cells were designated +aqpZ. By using antibodies against AqpZ, we confirmed the presence of AqpZ protein in extracts from +aqpZ cells and the absence of AqpZ protein in extracts from ΔaqpZ cells (Fig. 3B). The complemented cells were able to grow on glucose medium as well as the wild type, whereas the ΔaqpZ cells did not grow (Fig. 3C). As a control and to exclude the possibility that the growth inhibition was caused by the change in osmolarity due to the addition of 5 mm glucose, we added sorbitol or l-glucose at the same concentration instead of glucose to the cells (Fig. 3C and supplemental Fig. S2). Only glucose caused growth inhibition of the ΔaqpZ cells. Synechocystis wild-type cells are able to grow heterotrophically in the dark if provided with a short pulse of white light in the presence of glucose (14). We examined the growth of ΔaqpZ cells under these heterotrophic conditions. An aliquot of a mid-logarithmic phase culture of either wild-type or ΔaqpZ cells grown on medium without glucose in the light was spotted onto solid BG11 plates with or without 5 mm glucose (Fig. 3D) and grown in the dark. In contrast to the wild-type cells, ΔaqpZ cells were incapable of growing on medium containing 5 mm glucose in the dark (Fig. 3D). Similar to this, after 48 h of growth in liquid medium with glucose in the light, the growth rate of ΔaqpZ cells was much slower than that of wild-type cells (Fig. 3E). These results indicate that loss of aqpZ caused hypersensitivity to glucose and that ΔaqpZ cells were unable to effectively use glucose as a carbon source for growth.
FIGURE 3.
Phenotype of the aqpZ mutants. A, WT or ΔaqpZ cells grown to mid-exponential phase were spotted onto BG11 solid medium without (left) or with 5 mm glucose (right). Each spot consisted of 5 μl of liquid culture diluted to an OD730 of 1, 0.1, or 0.01, as indicated. Plates were maintained at 30 °C, 50 μmol of photons m−2 s−1. Plates were photographed at 5 days after inoculation. B, amount of AqpZ protein in WT cells, ΔaqpZ cells, or ΔaqpZ cells complemented with the aqpZ gene (+aqpZ). Blots were probed with antiserum to AqpZ (top). Total protein (CBB) served as a loading control (bottom). C, growth of WT cells, ΔaqpZ cells, and +aqpZ cells on solid medium without an addition (top), with 5 mm glucose (middle), or with 5 mm sorbitol (bottom). D, WT or ΔaqpZ cells grown to mid-exponential phase were spotted onto solid medium without (left) or with 5 mm glucose (right). Each spot consisted of 5 μl of culture diluted to an OD730 of 1.0. The plates were incubated in the dark except for a short exposure to light (15 min each day) and photographed at days 14 and 21. E, growth curves (left) of WT (filled circles) and ΔaqpZ cells (open circles) in liquid medium without (top) and with 5 mm glucose (bottom) grown in the light. An aliquot of the cultures taken at the times indicated is shown on the right. Data and error bars (S.D.) correspond to the results of at least five independent experiments.
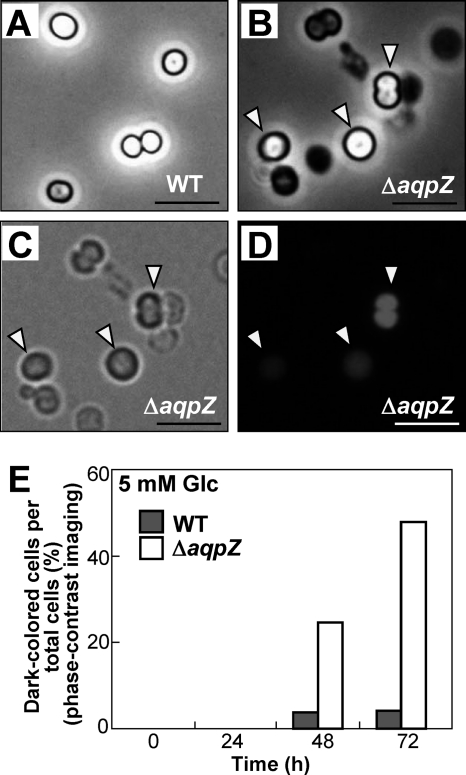
We observed individual Synechocystis cells grown in liquid medium with glucose using phase-contrast imaging. The number of dark cells was higher than the number of bright cells in the ΔaqpZ culture compared with the wild type (Fig. 4, A and B). Those cells appearing dark using phase-contrast microscopy did not show autofluorescence under UV light (Fig. 4, C and D), indicating that they lacked chlorophyll. Based on these results, dark cells were considered to be dead cells. After growth for 48 or 72 h, the number of dark cells in cultures of the ΔaqpZ strain was much higher than in wild-type cultures (Fig. 4E). These results showed that AqpZ is essential for survival of Synechocystis under photomixotrophic conditions.
FIGURE 4.
Effects of glucose on the viability of ΔaqpZ cells. A–D, WT and ΔaqpZ cells were cultured in liquid medium supplemented with 5 mm glucose (Glc) in the light. Shown are phase-contrast micrographs of WT (A) and ΔaqpZ cells (B–D). The ΔaqpZ cells in B were continuously monitored using bright field (C) and fluorescence microscopy (D). Cells shown were photographed at 72 h. The arrows indicate cells showing chlorophyll autofluorescence. Bars, 10 μm. E, percentage of the number of dark cells, determined using phase-contrast imaging in cultures grown in medium containing 5 mm glucose for the times indicated.
Deletion of aqpZ Resulted in an Increase in Cell Volume in the Presence of Glucose
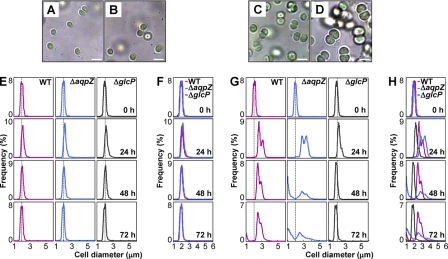
While performing the microscopic observations shown in Fig. 4, we noticed a difference in size and morphology between the ΔaqpZ and the wild-type cells. We therefore compared wild-type and ΔaqpZ cells during incubation with or without 5 mm glucose under the microscope (Fig. 5, A–D). There was no significant difference in the size of wild-type and ΔaqpZ cells grown in liquid medium without glucose (Fig. 5, A and B). In contrast, after 48 h of growth on medium containing 5 mm glucose, both wild-type and ΔaqpZ cells became larger (Fig. 5, C and D). However, the diameter of the ΔaqpZ cells increased more than that of the wild-type cells (Fig. 5, C and D). The distribution of cell sizes of the wild type, ΔaqpZ, and cells lacking the glucose uptake transporter GlcP (ΔglcP) was evaluated over the course of 72 h using a particle counter (Fig. 5, E–H). The size distribution of wild-type, ΔaqpZ, and ΔglcP cells was similar when cells were grown without glucose (Fig. 5, E and F). After 24 h of incubation in the presence of 5 mm glucose, ΔaqpZ cells were larger than the wild-type cells. The size of the ΔglcP cells remained largely unchanged over the course of the experiment (Fig. 5, G and H). In the ΔaqpZ cell culture, a significant number of small cells (less than 1.5 mm in diameter) were observed after 48 h; these were most likely dead cells.
FIGURE 5.
Effects of glucose on the size distribution of Synechocystis cells. A–D, WT and ΔaqpZ cells were grown under photoautotrophic or photomixotrophic (5 mm glucose) conditions. A, WT cells; B, ΔaqpZ cells; C, WT cells with 5 mm glucose; D, ΔaqpZ cells with 5 mm glucose. Cells were photographed at 48 h. Bars, 3 μm. E–H, WT, ΔaqpZ cells and ΔglcP cells were cultured in medium without (E and F) or with 5 mm glucose (G and H), and the cell sizes were determined by a particle counter. Vertical dashed lines in E and G, 2 μm in diameter of the cells. WT, ΔaqpZ, and ΔglcP cells are indicated by red, blue, and gray lines, respectively. F and H, overlays of the distributions shown in E and G, respectively.
Cell Division Was Affected in ΔaqpZ Cells Grown in the Presence of Glucose
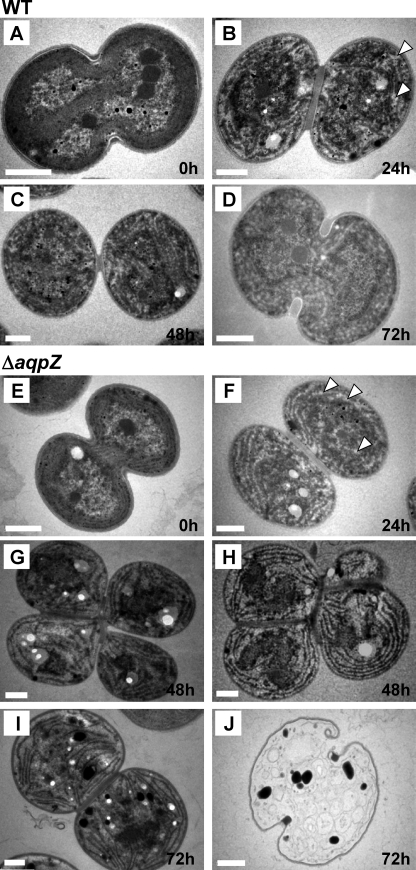
To assess the effects of glucose on cell morphology in ΔaqpZ cells, we examined the cells by transmission electron microscopy. When both wild-type and ΔaqpZ cells were cultured in medium without glucose, their appearance was similar (Fig. 6, A and E). After incubation in liquid medium with glucose for 24 h, glycogen granules (white spots) were visible in sections of both wild-type and ΔaqpZ cells to a similar extent (Fig. 6, B and F). However, at 48 and 72 h, a number of ΔaqpZ cells containing glycogen granules showed dramatic changes compared with the wild type (Fig. 6, G–I). The structure of the thylakoid membranes in these ΔaqpZ cells was disordered, and oval-shaped cells containing bodies of high electron density were observed (Fig. 6, I and J). Fig. 6, G–J, shows the unusual appearance of these cells that also were unable to complete cell division. These structural aberrations and morphological abnormalities of ΔaqpZ cells were correlated with the presence of glucose in the medium.
FIGURE 6.
Aberrant morphology of ΔaqpZ cells in the presence of glucose. WT (A–D) and ΔaqpZ cells (E–J) were grown under photomixotrophic conditions for 0, 24, 48, and 72 h. Glycogen granules are indicated by arrowheads (B and F). Incomplete cell division (G and H), abnormally shaped thylakoid membranes in the cells (I), and dead cells (J) were observed in the ΔaqpZ cell culture. Bars, 0.5 μm.
Glucose Uptake Is Required for Glucose-induced Growth Inhibition of ΔaqpZ Cells
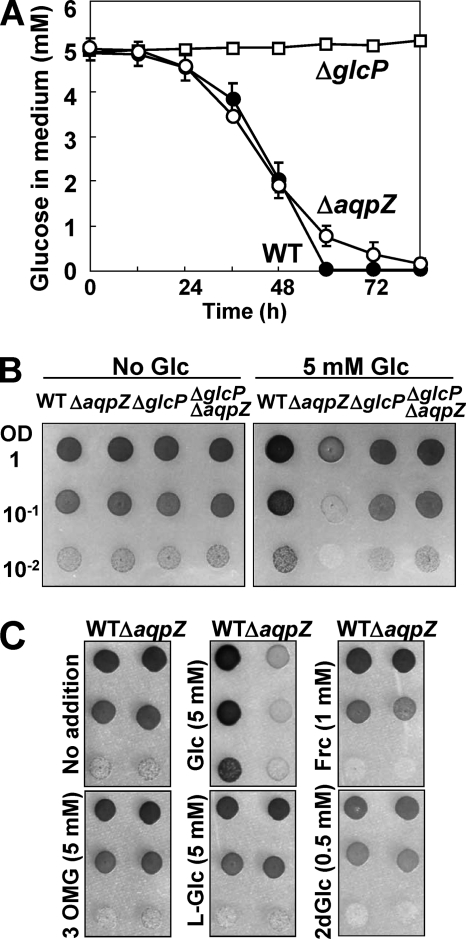
To examine whether ΔaqpZ cells were sensitive to intracellular or extracellular glucose, we studied the effect of deletion of the glucose uptake transporter, GlcP (42–44). Consistent with previously reported results, the ΔglcP mutant showed strongly reduced glucose uptake from the medium (Fig. 7A). When GlcP was deleted in the ΔaqpZ background (ΔglcP/ΔaqpZ mutant), these cells were no longer sensitive to glucose (Fig. 7B). Next, glucose analogs were tested to assess the cause of glucose toxicity in ΔaqpZ cells. l-Glucose (an enantiomer of glucose, which is very poorly transported into cells), 3-o-methyl-glucose (a glucose analog, which can be taken up into the cell but not phosphorylated by hexokinase), 2-deoxyglucose (which is phosphorylated by hexokinase but inhibits the production of glucose 6-phosphate, NADPH, and ATP), or fructose was added to solid media and growth was tested. Unlike glucose, none of the analogs resulted in a significant difference in growth between wild-type and ΔaqpZ cells, either on solid (Fig. 7C) or in liquid media (data not shown) (44). These data indicated that there is no difference in glucose uptake or hexokinase activity between the wild-type and ΔaqpZ cells.
FIGURE 7.
Inhibition of the growth of ΔaqpZ cells by glucose was dependent on glucose uptake. A, consumption of glucose in the medium by WT, ΔaqpZ, and ΔglcP cells. The glucose concentration of the medium (initial concentration was 5 mm) was determined at the times indicated. Data are means ± S.D. (error bars) of three independent experiments. B, WT, ΔaqpZ, ΔglcP, and ΔaqpZ/ΔglcP cells grown on solid medium without (left) or with 5 mm glucose (right) for 5 days. Each spot consisted of 5 μl of culture diluted to the indicated values of OD730. C, WT and ΔaqpZ cells grown for 5 days on solid medium containing the indicated concentrations of d-glucose (Glc), l-glucose (L-Glc), 2-deoxy-glucose (2dGlc), 3-o-methyl-d-glucose (3OMG), or fructose (Frc). Each spot consisted of 5 μl of culture diluted to an OD730 of 1.0.
The Activity of the Pentose Phosphate Pathway was Decreased in ΔaqpZ Cells
The expression of genes encoding enzymes in the glycolytic and the pentose phosphate pathways has been studied under various nutrient conditions (29, 44–50). Following its uptake into the cell, glucose is converted to glucose 6-phosphate by glucokinase, and glucose 6-phosphate is then further metabolized by glucose 6-phosphate dehydrogenase, an enzyme belonging to the pentose phosphate pathway. In Synechocystis, the OpcA protein is required for glucose-6-phosphate dehydrogenase activity (26, 27). Changes in the amount of OpcA protein in response to the addition of glucose to the medium were determined by immunological analysis (Fig. 8, A and B). Expression of OpcA protein was induced by glucose after 48 h (Fig. 8, A and B). However, the level of induction of OpcA protein in ΔaqpZ was approximately half as high as that in the wild type (Fig. 8, A and B). This indicates that the aqpZ mutation inhibited the glucose-mediated activation of the pentose phosphate pathway.
ΔaqpZ Cells Contained More Glycogen
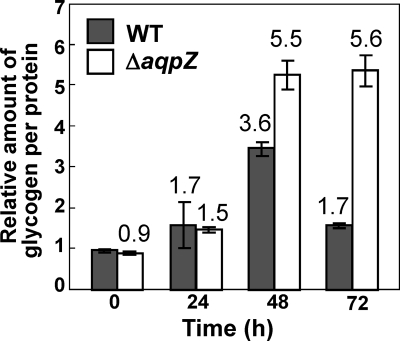
The decrease in induction of OpcA protein in ΔaqpZ cells in response to glucose (Fig. 8) and the existence of glycogen granules in the cells (Fig. 6) suggested that glucose catabolism was decreased in these cells as well. We therefore hypothesized that the cells may convert excess glucose to glycogen in order to prevent an increase in intracellular osmolarity. The glycogen content of wild-type and ΔaqpZ cells during log phase was the same before the addition of glucose (0 h in Fig. 9). After the addition of glucose to the medium, the amount of glycogen reached its peak at 48 h in the wild type and then decreased again. The ΔaqpZ cells accumulated significantly more glycogen over the course of the experiment than the wild type, and no decrease in glycogen content was seen at 72 h (Fig. 9), at which point the mutant contained 5.6 times more glycogen than the wild type at 0 h.
FIGURE 9.
Accumulation of glycogen in ΔaqpZ cells under photomixotrophic growth conditions. WT and ΔaqpZ cells were cultured under photomixotrophic conditions (5 mm glucose). The amount of glycogen in the cells was calculated relative to the value for WT (time = 0). Data are means ± S.D. (error bars) of values from three independent experiments.
Metabolite Profiles of Synechocystis Cells Grown under Photomixotrophic Conditions
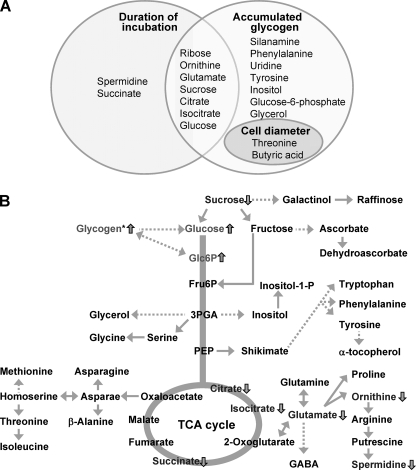
To elucidate the impact of loss of aqpZ on the metabolite content, we determined the levels of 72 metabolites in extracts of wild-type and ΔaqpZ cells (Fig. 10 and supplemental Figs. S2–S5). We applied two-way analysis of variance to find possible interactions between incubation time, intracellular glycogen content, or cell size and metabolite levels (Fig. 10A and supplemental Fig. S2). The statistical analysis revealed significant differences in metabolite levels between wild-type and ΔaqpZ cells (Fig. 10B and supplemental Fig. S2). The culture time-based profiles, which were verified at 48 h under photomixotrophic conditions, showed reduced amounts of isocitrate, citrate, glutamate, sucrose, succinate, ornithine, and spermidine in ΔaqpZ cells and a higher abundance of glucose and glucose 6-phosphate, (Fig. 10B). Interestingly, the lower level of spermidine, known as a compound that enhances cell proliferation, was correlated with the decrease in cell division of the ΔaqpZ cells (51). When we compared the correlation between intracellular glycogen levels or cell sizes and changes in metabolite levels, some of the interaction effects were overlapping (Fig. 10A). The overall changes in the levels of metabolites showed that glucose metabolism was inhibited in the ΔaqpZ cells (Fig. 10 and supplemental Figs. S3–S6).
FIGURE 10.
Changes in metabolite levels in ΔaqpZ cells in comparison with the WT grown for 48 h under photomixotrophic conditions based on metabolite profiling using GC/TOF-MS. A, Venn diagram of annotated metabolites that showed significant interaction effects with duration of culture, accumulated glycogen, and cell diameter. The corresponding box plots data sets are shown in supplemental Figs. S3–S5. B, diagram depicting key steps in glycolysis, the pentose phosphate pathway, the TCA cycle, and related pathways. Increase or decrease of metabolites in the ΔaqpZ mutant compared with the wild type is shown as upward or downward arrows, respectively. The data were derived from the data set shown in supplemental Fig. S2. 3PGA, 3-phosphoglycerate; PEP, phosphoenolpyruvate; Fru6P, fructose 6-phosphate; Glc6P, glucose 6-phosphate; GABA, γ-aminobutyric acid.
Synechocystis AqpZ Does Not Transport Glycerol
One possible explanation for the finding that products of the early steps of glycolysis accumulated in the ΔaqpZ mutant would be that AqpZ has a function in the export of glycerol, one of the products of glucose metabolism. Glycerol transport activity has been shown for some other aquaporins (52, 53). We examined whether AqpZ is able to transport glycerol by using heterologous expression in E. coli (supplemental Fig. S7). The E. coli MA05 (glpF−) or MA06 (aqpZ−, glpF−) strain complemented with the E. coli glycerol transporter gene glpF was able to grow on medium containing 2 mm glycerol as the sole carbon source. In contrast, Synechocystis AqpZ was not able to rescue the growth defects of strain MA05 or MA06. The same was true for E. coli AqpZ and the empty vector (supplemental Fig. S7). These data showed that Synechocystis AqpZ did not function as a glycerol transporter in the same way as E. coli GlpF.
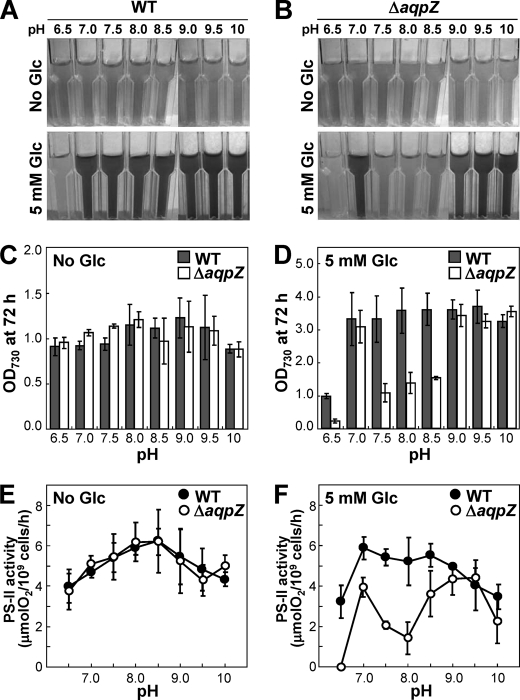
pH Dependence of ΔaqpZ Cells
Because organic compounds contribute to the cellular pH buffering system (54, 55), the reduced amount of certain metabolites found in ΔaqpZ cells (Fig. 10) may result in a disturbance of pH homeostasis in the cells. It has also been reported that glucose affected the pH sensitivity of Synechocystis (41, 56). Therefore, we tested the growth of ΔaqpZ cells in liquid medium with pH values ranging from 6.5 to 10. In medium without glucose, ΔaqpZ cells grew identical to the wild type at all pH values tested (Fig. 11, A and B). Oxygen evolution as a measure of PSII activity was the same for wild-type and ΔaqpZ cells in medium without glucose at all pH values tested (Fig. 11E). In contrast, under photomixotrophic conditions, when glucose was included in the medium, neither the wild-type nor the ΔaqpZ cells grew at pH 6.5 (Fig. 11, A, B, and D). The most significant difference was that the growth rate of the ΔaqpZ cells was strongly decreased after 72 h at pH values from 7.5 to 8.5 (Fig. 11, B and D). Oxygen evolution of the ΔaqpZ cells was also strongly decreased at these pH values (Fig. 11, E and F). These results indicated that hypersensitivity of the ΔaqpZ cells to glucose was pH-dependent.
FIGURE 11.
Influence of pH on the glucose sensitivity of the ΔaqpZ cells. A and B, WT (A) and ΔaqpZ cells (B) were grown for 72 h at 30 °C under photoautotrophic or photomixotrophic (5 mm glucose) conditions in media with different initial pH values. Aliquots of each culture were photographed. C and D, the OD730 of the cultures was measured after 72 h of growth. E and F, PSII-dependent oxygen evolution from the cells was determined after 48 h. Error bars, S.D.
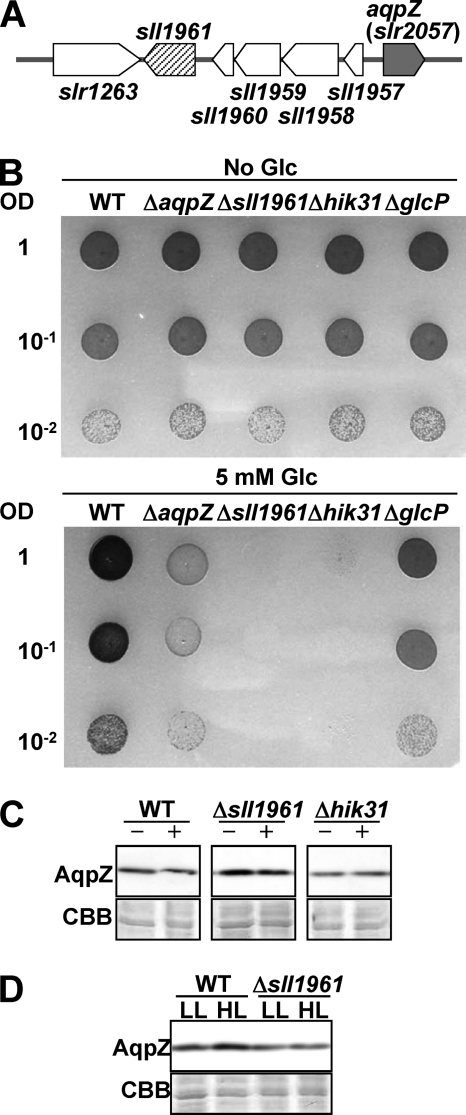
Comparison of the Glucose Sensitivity of Δsll1961 or Δhik31 Mutants with ΔaqpZ Cells
DNA microarray and Northern blotting analysis conducted previously revealed that deletion of sll1961, encoding a putative transcription factor, resulted in a decrease in the transcription level of aqpZ (57). The sll1961 mutant was also very sensitive to glucose in the medium (58). The aqpZ (slr2507) gene is adjacent to sll1961 but in the opposite orientation on the chromosome (Fig. 12A). In addition, inactivation of the hik31 gene, encoding a sensory histidine kinase, also suppressed cell growth in the presence of glucose (44). We compared the phenotypes of these two mutants with that of the ΔaqpZ cells (Fig. 12B). Both mutants, Δsll1961 and Δhik31, exhibited more severe growth inhibition in the presence of glucose than the ΔaqpZ cells. Immunoblot analysis showed that in the presence of glucose in the medium, the amount of AqpZ protein was slightly decreased in the Δsll1961 cells but unchanged in the Δhik31 cells (Fig. 12C). High light conditions increased the amount of AqpZ protein in the wild type, which was consistent with the results of the DNA microarray (57). No increase in AqpZ protein expression level in high light conditions was seen in the Δsll1961 mutant (Fig. 12D). These data suggest that sll1961 may partially regulate the expression of AqpZ protein.
FIGURE 12.
Influence of the putative positive transcription regulator, sll1961, on apqZ expression. A, the position of sll1961 and aqpZ in the chromosomal DNA. B, WT, ΔaqpZ, Δsll1961, Δhik31, and ΔglcP cells were grown to mid-exponential phase and spotted onto solid medium without (top) or with 5 mm glucose (bottom). Each spot consisted of 5 μl of liquid culture diluted to an OD730 of 1, 0.1, or 0.01. Plates were incubated at 30 °C for 5 days. C, Western blot analysis of AqpZ protein in WT, Δsll1961, or Δhik31 cells grown in medium containing 5 mm glucose (+) or no glucose (−). D, Western blot analysis of AqpZ protein in WT and Δsll1961 cells grown in medium without glucose under low light (LL) or high light (HL) conditions.
DISCUSSION
Loss of function of the plasma membrane-localized aquaporin AqpZ made Synechocystis cells unable to grow in medium containing glucose. ΔaqpZ cells showed aberrant cellular morphology and were affected in cell division (Figs. 2 and 6). This glucose sensitivity was dependent on glucose uptake, and in the absence of a functioning glucose transporter, glucose in the medium had no negative effect on ΔaqpZ cells (Fig. 7). This is compelling evidence because not much information on the phenotypes of aquaporin-deficient strains is available (6). Synechocystis uses the degradation of glucose into smaller molecules via the pentose phosphate pathway and glycolysis to increase intracellular osmolarity (44, 50). Consistent with this, both wild-type and ΔaqpZ cells grown on medium with glucose swelled more compared with cells grown in the absence of glucose (Fig. 5). The ΔaqpZ cells were larger in size than the wild type, which may be the result of a decrease in water permeability due to the loss of AqpZ function. Based on OpcA protein expression (Fig. 8) and metabolite profiling of the ΔaqpZ cells (Fig. 10 and supplemental Figs. S3–S6), glucose in the medium led to a decrease in glucose degradation and to enhanced glycogen synthesis, most likely to limit swelling of the cells (Fig. 9). This is in agreement with previous reports that the glycogen content was elevated or that glucose catabolism was impaired in Synechocystis when cells were exposed to excess glucose (29, 41, 48, 59). The observed decrease in the content of spermidine, a compound known to be involved in the enhancement of cell division, is consistent with decreased cell growth after glucose addition to the medium (51) (Fig. 10).
Water transport across the membrane is coordinated with the transport of various solutes, which are in turn closely associated with the formation of proton motive force consisting of pH gradient and membrane potential across the membrane (12, 60). The potassium transport system, consisting of Ktr-type transporters and potassium channels, and the sodium extrusion system of Na+/H+ antiporters in the plasma membrane of Synechocystis function to control the turgor pressure and the electrochemical membrane potential in response to extracellular or intracellular environmental changes (21, 61–69). The immediate adjustment to changes of membrane potential or cellular osmolarity requires fast water flux across the plasma membrane in response to the conversion of glucose into various types of molecules through the carbon metabolism pathway. In addition, intermediate metabolites like citrate and malate derived from glucose through glycolysis and the TCA cycle are known to be important for regulation of pH homeostasis, ΔpH, and the proton motive force (70). Synechocystis mutants impaired in tocopherol biosynthesis, which is an antioxidant small metabolite, are also affected in their pH dependence (41). The ΔaqpZ mutant was sensitive to pH values between pH 7.5 and pH 8.5 in glucose-containing medium and showed inactivation of PSII (Fig. 11). This may be the result of changed levels of metabolites detected in the ΔaqpZ cells.
We analyzed potential effects on carbon metabolism by GC/TOF-MS profiling of ΔaqpZ and wild-type cells and compared their metabolite contents. Metabolite profiling data were used to analyze possible interactions between glycogen content, cell size, and metabolite levels (supplemental Figs. S4–S6). The content of glucose 6-phosphate and glucose increased in the ΔaqpZ cells after 48 h of growth, whereas the levels of products of the tricarboxylic acid cycle and some amino acids remained unchanged or were lower compared with the wild type. This is in agreement with the finding that the influx of glucose into the pentose phosphate pathway was reduced (Fig. 8). Consistent with this, statistical analyses showed that the ΔaqpZ cells overall contained lower levels of metabolites compared with the wild type (Fig. 10 and supplemental Figs. S3–S6). The reduction in the amount of metabolites derived from the degradation of glucose prevented an increase of the intracellular osmolarity and promoted glycogen synthesis in the cells.
Fujimori et al. (57) isolated the sll1961 mutant based on its hypersensitivity to high light conditions. In a subsequent study, the same group found that glucose in the medium reduced the growth of the sll1961 mutant (58). DNA microarray analysis revealed that loss of function of sll1961 resulted in decreased expression of aqpZ at the transcriptional level, indicating that sll1961 is a positive transcription regulator for aqpZ gene expression. This functional relationship between sll1961 and aqpZ is further supported by their adjacent position in the Synechocystis genome. We compared the sensitivity of the Δsll1961 and the ΔaqpZ mutant to glucose and the level of AqpZ protein in cells grown without and with glucose and found some evidence for a regulatory role of sll1961 on aqpZ expression (Fig. 12). However, because loss of function of sll1961 did not result in a lack of AqpZ protein, we concluded that sll1961 only had a limited role in aqpZ expression.
Like other aquaporins, AqpZ can mediate both inward and outward water flow (Fig. 1) (71). Because the genome of Synechocystis PCC 6803 contains a single gene encoding an aquaporin, aqpZ, and our results showed that AqpZ resides in the plasma membrane (Fig. 2 and supplemental Fig. S1), this leads to the following questions. Is AqpZ the only water transport system? What is the water permeation route across the thylakoid membrane? The detailed structural analysis of potassium channels revealed that they allow the passage of water molecules through the conducting pore (72). Considering these findings, we predict that other membrane proteins in addition to AqpZ may conduct the diffusion of water across membranes.
It is also possible that AqpZ may be required for the transport of products synthesized during the process of glucose metabolism. Many aquaporins have been documented to act as facilitators of water, glycerol, peroxide, CO2, and other small, uncharged, ubiquitous molecules (11, 12). We therefore tested the possibility that glycerol may be able to pass through AqpZ by heterologous expression of aqpZ in E. coli glpF mutants but did not observe glycerol transport activity (supplemental Fig. S7). It cannot be excluded that passage of small metabolites through AqpZ may be required in order to discharge cytotoxic compounds from cells growing on glucose-containing media. This would explain why cells lacking AqpZ were hypersensitive to glucose and were larger than the wild type in the presence of 5 mm glucose (Fig. 5).
In summary, our efforts in characterizing ΔaqpZ cells under photomixotrophic conditions have yielded new insights into the role of aquaporin in glucose metabolism in Synechocystis. Loss of function of aqpZ resulted in a down-regulation of glucose hydrolysis after glucose addition into the medium and an increase of glycogen synthesis. Therefore, in addition to its role as a water channel, AqpZ plays a role in regulating cell volume, macronutrient homeostasis, and cell division under photomixotrophic conditions.
Supplementary Material
Acknowledgments
We thank Tatsuo Omata (Nagoya University) for the anti-NrtA antibodies, Eva-Mari Aro (University of Turku) and Teruo Ogawa (Nagoya University) for the antibodies against NdhD3 and NdhF3, John C. Meeks (University of California, Davis) for the anti-OpcA antibodies, Iwane Suzuki (Tsukuba University) for the Δhik31 cells, Makoto Kobayashi and Hitomi Otsuki (RIKEN Plant Science Center) for metabolomics analysis, Takako Kawai (RIKEN Plant Science Center) for performing electron microscopy, and Anke Reinders (University of Minnesota) for critical reading of the manuscript.
This work was supported by MEXT and Japan Society for the Promotion of Science Grants-in-aid for Scientific Research 22020002 and 22380056 (to N. U.) and the Salt Science Research Foundation.

The on-line version of this article (available at http://www.jbc.org) contains supplemental Figs. S1–S7.
- TES
- 2-{[2-hydroxy-1,1-bis(hydroxymethyl)ethyl]amino}ethanesulfonic acid
- Bicine
- N,N-bis(2-hydroxyethyl)glycine
- CHES
- 2-(cyclohexylamino)ethanesulfonic acid.
REFERENCES
- 1. Preston G. M., Carroll T. P., Guggino W. B., Agre P. (1992) Science 256, 385–387 [DOI] [PubMed] [Google Scholar]
- 2. Agre P., Kozono D. (2003) FEBS Lett. 555, 72–78 [DOI] [PubMed] [Google Scholar]
- 3. Czempinski K., Frachisse J. M., Maurel C., Barbier-Brygoo H., Mueller-Roeber B. (2002) Plant J. 29, 809–820 [DOI] [PubMed] [Google Scholar]
- 4. Maurel C., Reizer J., Schroeder J. I., Chrispeels M. J. (1993) EMBO J. 12, 2241–2247 [DOI] [PMC free article] [PubMed] [Google Scholar]
- 5. Shapiguzov A., Lyukevich A. A., Allakhverdiev S. I., Sergeyenko T. V., Suzuki I., Murata N., Los D. A. (2005) Microbiology 151, 447–455 [DOI] [PubMed] [Google Scholar]
- 6. Tanghe A., Van Dijck P., Thevelein J. M. (2006) Trends Microbiol. 14, 78–85 [DOI] [PubMed] [Google Scholar]
- 7. Calamita G., Kempf B., Bonhivers M., Bishai W. R., Bremer E., Agre P. (1998) Proc. Natl. Acad. Sci. U.S.A. 95, 3627–3631 [DOI] [PMC free article] [PubMed] [Google Scholar]
- 8. Soupene E., King N., Lee H., Kustu S. (2002) J. Bacteriol. 184, 4304–4307 [DOI] [PMC free article] [PubMed] [Google Scholar]
- 9. Delamarche C., Thomas D., Rolland J. P., Froger A., Gouranton J., Svelto M., Agre P., Calamita G. (1999) J. Bacteriol. 181, 4193–4197 [DOI] [PMC free article] [PubMed] [Google Scholar]
- 10. Hill A. E., Shachar-Hill B., Shachar-Hill Y. (2004) J. Membr. Biol. 197, 1–32 [DOI] [PubMed] [Google Scholar]
- 11. Yasui M., Hazama A., Kwon T. H., Nielsen S., Guggino W. B., Agre P. (1999) Nature 402, 184–187 [DOI] [PubMed] [Google Scholar]
- 12. Maurel C. (2007) FEBS Lett. 581, 2227–2236 [DOI] [PubMed] [Google Scholar]
- 13. Williams J. G. K. (1988) Methods Enzymol. 167, 776–778 [Google Scholar]
- 14. Anderson S. L., McIntosh L. (1991) J. Bacteriol. 173, 2761–2767 [DOI] [PMC free article] [PubMed] [Google Scholar]
- 15. Uozumi N., Gassmann W., Cao Y., Schroeder J. I. (1995) J. Biol. Chem. 270, 24276–24281 [DOI] [PubMed] [Google Scholar]
- 16. Ma T., Frigeri A., Skach W., Verkman A. S. (1993) Biochem. Biophys. Res. Commun. 197, 654–659 [DOI] [PubMed] [Google Scholar]
- 17. Chakrabarti N., Roux B., Pomès R. (2004) J. Mol. Biol. 343, 493–510 [DOI] [PubMed] [Google Scholar]
- 18. Liu K., Kozono D., Kato Y., Agre P., Hazama A., Yasui M. (2005) Proc. Natl. Acad. Sci. U.S.A. 102, 2192–2197 [DOI] [PMC free article] [PubMed] [Google Scholar]
- 19. Meetam M., Keren N., Ohad I., Pakrasi H. B. (1999) Plant Physiol. 121, 1267–1272 [DOI] [PMC free article] [PubMed] [Google Scholar]
- 20. Norling B., Zak E., Andersson B., Pakrasi H. (1998) FEBS Lett. 436, 189–192 [DOI] [PubMed] [Google Scholar]
- 21. Tsunekawa K., Shijuku T., Hayashimoto M., Kojima Y., Onai K., Morishita M., Ishiura M., Kuroda T., Nakamura T., Kobayashi H., Sato M., Toyooka K., Matsuoka K., Omata T., Uozumi N. (2009) J. Biol. Chem. 284, 16513–16521 [DOI] [PMC free article] [PubMed] [Google Scholar]
- 22. Omata T. (1995) Plant Cell Physiol. 36, 207–213 [DOI] [PubMed] [Google Scholar]
- 23. Ohkawa H., Price G. D., Badger M. R., Ogawa T. (2000) J. Bacteriol. 182, 2591–2596 [DOI] [PMC free article] [PubMed] [Google Scholar]
- 24. Zhang P., Battchikova N., Jansen T., Appel J., Ogawa T., Aro E. M. (2004) Plant Cell 16, 3326–3340 [DOI] [PMC free article] [PubMed] [Google Scholar]
- 25. Stanier R. Y., Kunisawa R., Mandel M., Cohen-Bazire G. (1971) Bacteriol. Rev. 35, 171–205 [DOI] [PMC free article] [PubMed] [Google Scholar]
- 26. Sundaram S., Karakaya H., Scanlan D. J., Mann N. H. (1998) Microbiology 144, 1549–1556 [DOI] [PubMed] [Google Scholar]
- 27. Hagen K. D., Meeks J. C. (2001) J. Biol. Chem. 276, 11477–11486 [DOI] [PubMed] [Google Scholar]
- 28. Toyooka K., Moriyasu Y., Goto Y., Takeuchi M., Fukuda H., Matsuoka K. (2006) Autophagy 2, 96–106 [DOI] [PubMed] [Google Scholar]
- 29. Osanai T., Kanesaki Y., Nakano T., Takahashi H., Asayama M., Shirai M., Kanehisa M., Suzuki I., Murata N., Tanaka K. (2005) J. Biol. Chem. 280, 30653–30659 [DOI] [PubMed] [Google Scholar]
- 30. Forchhammer K., Tandeau de Marsac N. (1995) J. Bacteriol. 177, 2033–2040 [DOI] [PMC free article] [PubMed] [Google Scholar]
- 31. Datsenko K. A., Wanner B. L. (2000) Proc. Natl. Acad. Sci. U.S.A. 97, 6640–6645 [DOI] [PMC free article] [PubMed] [Google Scholar]
- 32. Froger A., Rolland J. P., Bron P., Lagrée V., Le Cahérec F., Deschamps S., Hubert J. F., Pellerin I., Thomas D., Delamarche C. (2001) Microbiology 147, 1129–1135 [DOI] [PubMed] [Google Scholar]
- 33. Jonsson P., Gullberg J., Nordström A., Kusano M., Kowalczyk M., Sjöström M., Moritz T. (2004) Anal. Chem. 76, 1738–1745 [DOI] [PubMed] [Google Scholar]
- 34. Jonsson P., Johansson E. S., Wuolikainen A., Lindberg J., Schuppe-Koistinen I., Kusano M., Sjöström M., Trygg J., Moritz T., Antti H. (2006) J. Proteome Res. 5, 1407–1414 [DOI] [PubMed] [Google Scholar]
- 35. Kusano M., Fukushima A., Kobayashi M., Hayashi N., Jonsson P., Moritz T., Ebana K., Saito K. (2007) J. Chromatogr. B Analyt. Technol. Biomed. Life Sci. 855, 71–79 [DOI] [PubMed] [Google Scholar]
- 36. Kusano M., Fukushima A., Arita M., Jonsson P., Moritz T., Kobayashi M., Hayashi N., Tohge T., Saito K. (2007) BMC Syst. Biol. 1, 53 [DOI] [PMC free article] [PubMed] [Google Scholar]
- 37. Schauer N., Steinhauser D., Strelkov S., Schomburg D., Allison G., Moritz T., Lundgren K., Roessner-Tunali U., Forbes M. G., Willmitzer L., Fernie A. R., Kopka J. (2005) FEBS Lett. 579, 1332–1337 [DOI] [PubMed] [Google Scholar]
- 38. Kopka J., Schauer N., Krueger S., Birkemeyer C., Usadel B., Bergmüller E., Dörmann P., Weckwerth W., Gibon Y., Stitt M., Willmitzer L., Fernie A. R., Steinhauser D. (2005) Bioinformatics 21, 1635–1638 [DOI] [PubMed] [Google Scholar]
- 39. Redestig H., Fukushima A., Stenlund H., Moritz T., Arita M., Saito K., Kusano M. (2009) Anal. Chem. 81, 7974–7980 [DOI] [PubMed] [Google Scholar]
- 40. Smyth G. K. (2004) Stat. Appl. Genet. Mol. Biol. 3, Article3 [DOI] [PubMed] [Google Scholar]
- 41. Sakuragi Y., Maeda H., Dellapenna D., Bryant D. A. (2006) Plant Physiol. 141, 508–521 [DOI] [PMC free article] [PubMed] [Google Scholar]
- 42. Schmetterer G. R. (1990) Plant Mol. Biol. 14, 697–706 [DOI] [PubMed] [Google Scholar]
- 43. Zhang C. C., Jeanjean R., Joset F. (1998) FEMS Microbiol. Lett. 161, 285–292 [DOI] [PubMed] [Google Scholar]
- 44. Kahlon S., Beeri K., Ohkawa H., Hihara Y., Murik O., Suzuki I., Ogawa T., Kaplan A. (2006) Microbiology 152, 647–655 [DOI] [PubMed] [Google Scholar]
- 45. Yang C., Hua Q., Shimizu K. (2002) Metab. Eng. 4, 202–216 [DOI] [PubMed] [Google Scholar]
- 46. Yang C., Hua Q., Shimizu K. (2002) Appl. Microbiol. Biotechnol. 58, 813–822 [DOI] [PubMed] [Google Scholar]
- 47. Knowles V. L., Plaxton W. C. (2003) Plant Cell Physiol. 44, 758–763 [DOI] [PubMed] [Google Scholar]
- 48. Singh A. K., Sherman L. A. (2005) J. Bacteriol. 187, 2368–2376 [DOI] [PMC free article] [PubMed] [Google Scholar]
- 49. Lee S., Ryu J. Y., Kim S. Y., Jeon J. H., Song J. Y., Cho H. T., Choi S. B., Choi D., de Marsac N. T., Park Y. I. (2007) Plant Physiol. 145, 1018–1030 [DOI] [PMC free article] [PubMed] [Google Scholar]
- 50. Takahashi H., Uchimiya H., Hihara Y. (2008) J. Exp. Bot. 59, 3009–3018 [DOI] [PMC free article] [PubMed] [Google Scholar]
- 51. Igarashi K., Kashiwagi K. (2006) J. Biochem. 139, 11–16 [DOI] [PubMed] [Google Scholar]
- 52. Hibuse T., Maeda N., Nagasawa A., Funahashi T. (2006) Biochim. Biophys. Acta 1758, 1004–1011 [DOI] [PubMed] [Google Scholar]
- 53. Wintour E. M., Henry B. A. (2006) Trends Endocrinol. Metab. 17, 77–78 [DOI] [PubMed] [Google Scholar]
- 54. Daeschel M. A. (1988) Appl. Environ. Microbiol. 54, 1627–1629 [DOI] [PMC free article] [PubMed] [Google Scholar]
- 55. Korithoski B., Krastel K., Cvitkovitch D. G. (2005) J. Bacteriol. 187, 4451–4456 [DOI] [PMC free article] [PubMed] [Google Scholar]
- 56. Ryu J. Y., Song J. Y., Lee J. M., Jeong S. W., Chow W. S., Choi S. B., Pogson B. J., Park Y. I. (2004) J. Biol. Chem. 279, 25320–25325 [DOI] [PubMed] [Google Scholar]
- 57. Fujimori T., Higuchi M., Sato H., Aiba H., Muramatsu M., Hihara Y., Sonoike K. (2005) Plant Physiol. 139, 408–416 [DOI] [PMC free article] [PubMed] [Google Scholar]
- 58. Ozaki H., Ikeuchi M., Ogawa T., Fukuzawa H., Sonoike K. (2007) Plant Cell Physiol. 48, 451–458 [DOI] [PubMed] [Google Scholar]
- 59. Osanai T., Imamura S., Asayama M., Shirai M., Suzuki I., Murata N., Tanaka K. (2006) DNA Res. 13, 185–195 [DOI] [PubMed] [Google Scholar]
- 60. Tournaire-Roux C., Sutka M., Javot H., Gout E., Gerbeau P., Luu D. T., Bligny R., Maurel C. (2003) Nature 425, 393–397 [DOI] [PubMed] [Google Scholar]
- 61. Mikkat S., Milkowski C., Hagemann M. (2000) Plant Cell Environ. 23, 549–559 [Google Scholar]
- 62. Inaba M., Sakamoto A., Murata N. (2001) J. Bacteriol. 183, 1376–1384 [DOI] [PMC free article] [PubMed] [Google Scholar]
- 63. Elanskaya I. V., Karandashova I. V., Bogachev A. V., Hagemann M. (2002) Biochemistry 67, 432–440 [DOI] [PubMed] [Google Scholar]
- 64. Berry S., Esper B., Karandashova I., Teuber M., Elanskaya I., Rögner M., Hagemann M. (2003) FEBS Lett. 548, 53–58 [DOI] [PubMed] [Google Scholar]
- 65. Matsuda N., Kobayashi H., Katoh H., Ogawa T., Futatsugi L., Nakamura T., Bakker E. P., Uozumi N. (2004) J. Biol. Chem. 279, 54952–54962 [DOI] [PubMed] [Google Scholar]
- 66. Matsuda N., Uozumi N. (2006) Biosci. Biotechnol. Biochem. 70, 273–275 [DOI] [PubMed] [Google Scholar]
- 67. Zulkifli L., Uozumi N. (2006) J. Bacteriol. 188, 7985–7987 [DOI] [PMC free article] [PubMed] [Google Scholar]
- 68. Zulkifli L., Akai M., Yoshikawa A., Shimojima M., Ohta H., Guy H. R., Uozumi N. (2010) J. Bacteriol. 192, 5063–5070 [DOI] [PMC free article] [PubMed] [Google Scholar]
- 69. Zanetti M., Teardo E., La Rocca N., Zulkifli L., Checchetto V., Shijuku T., Sato Y., Giacometti G. M., Uozumi N., Bergantino E., Szabò I. (2010) PLoS One 5, e10118 [DOI] [PMC free article] [PubMed] [Google Scholar]
- 70. Bandell M., Ansanay V., Rachidi N., Dequin S., Lolkema J. S. (1997) J. Biol. Chem. 272, 18140–18146 [DOI] [PubMed] [Google Scholar]
- 71. Azad A. K., Sato R., Ohtani K., Sawa Y., Ishikawa T., Shibata H. (2011) Plant Sci. 180, 375–382 [DOI] [PubMed] [Google Scholar]
- 72. Doyle D. A., Morais Cabral J., Pfuetzner R. A., Kuo A., Gulbis J. M., Cohen S. L., Chait B. T., MacKinnon R. (1998) Science 280, 69–77 [DOI] [PubMed] [Google Scholar]
Associated Data
This section collects any data citations, data availability statements, or supplementary materials included in this article.


