

Abstract
BACKGROUND
Epigenetic therapy has had a significant impact on the management of hematologic malignancies, but its role in the treatment of ovarian cancer remains to be defined. We have shown earlier that treatment of ovarian and breast cancer cells with DNA methyltransferase and HDAC inhibitors can upregulate expression of imprinted tumor suppressors. In this study, demethylating agents and HDAC inhibitors were tested for their ability to induce re-expression of tumor suppressor genes, inhibiting growth of ovarian cancer cells in culture and in xenografts.
METHODS
Ovarian cancer cells (Hey and SKOv3) were treated with demethylating agents [decitabine (DAC), azacytidine (AZA)] or HDAC inhibitors [(suberoylanilide hydroxamic acid (SAHA), trichosporin A (TSA)] to determine their impact on cellular proliferation, cell cycle regulation, apoptosis, autophagy and re-expression of ARHI and PEG3, two growth inhibitory imprinted tumor suppressor genes. The in vivo activity of DAC and SAHA was assessed in a Hey xenograft model.
RESULTS
A combination of DAC and SAHA produced synergistic inhibition of Hey and SKOv3 growth, by apoptosis and cell cycle arrest. DAC induced autophagy in Hey cells that could be enhanced by SAHA. Treatment with both agents induced re-expression of ARHI and PEG3 in cultured cells and in xenografts, correlating with growth inhibition. Knockdown of ARHI decreased DAC-induced autophagy. DAC and SAHA inhibited growth of Hey xenografts and induced autophagy in vivo.
CONCLUSION
A combination of DAC and SAHA inhibited ovarian cancer growth while inducing apoptosis, G2/M arrest, autophagy and re-expression of imprinted tumor suppressor genes.
Keywords: ovarian cancer, autophagy, decitabine (DAC), suberoylanilide hydroxamic acid (SAHA), imprinted tumor suppressor genes, ARHI, PEG3
INTRODUCTION
Ovarian cancer is the second most common gynecologic malignancy in the United States and has the highest fatality-to-case ratio1. Despite advances in surgery and chemotherapy, the cure rate is less than 30% for advanced stage ovarian cancer2, underscoring the urgent need for more effective therapy based upon a better understanding of the biology of the disease.
Molecular mechanisms underlying development and progression of ovarian cancer remain poorly understood. Genetic alterations have been detected in different ovarian cancers with activating mutations and amplification of oncogenes, as well as inactivating mutations and loss of heterozygosity of tumor suppressor genes.3
Epigenetic changes have also been implicated in malignant transformation and progression of different cancers, including ovarian cancer.4 Aberrant DNA methylation in the CpG islands within promoter regions is associated with silencing of tumor suppressor genes, which is considered equivalent to the effect of inactivating mutations or deletion of tumor suppressor genes.5 Aberrant DNA methylation can be reversed with hypomethylating agents such as 5-azacitidine (AZA), and 5-aza-2′-deoxycytidine (decitabine; DAC).5,6 Re-expression of genes that inhibit growth, promote apoptosis and induce autophagy could exert anti-tumor activity. While significant therapeutic activity has been reported in patients with hematopoietic malignancies,7 few trials have been performed in solid tumors, including ovarian cancer. Recent studies with AZA suggest that re-expression of silenced genes can be achieved and that sensitivity to carboplatin can be restored in a fraction of patients with platinum-resistant ovarian cancer.8
Epigenetic regulation of tumor suppressor genes also occurs through histone modification. Acetylation of histones H3 and H4 is associated with active gene transcription, whereas deacetylation represses gene expression. These changes are catalyzed by histone acetyltransferases and histone deacetylases (HDAC). Several compounds, including suberoylanilide hydroxamic acid (SAHA) and trichostatin A (TSA) inhibit histone deacetylase activity and can induce global and gene specific hyperacetylation, enhancing expression of numerous genes. These compounds have been shown to inhibit cancer growth in different preclinical models, and are being evaluated in clinical trials with SAHA (vorinostat) for treating patients with cutaneous T-cell lymphoma.9,10 When used as a single agent in platinum refractory ovarian cancer, SAHA was well tolerated, but had minimal activity.11 A recent Phase 1b-2a study to assess the effects of hypomethylating agent azacitidine in patients with platinum-resistant or platinum-refractory epithelial ovarian cancer showed that treatment with hypomethylating agent could partially reverse platinum resistance.8
Combined use of demethylating agents and HDAC inhibitors have achieved greater anti-tumor activity;12,13 however mechanisms underlying their activity are not well-defined, but may relate to upregulation of growth inhibitory and pro-apoptotic genes that have been silenced during oncogenesis by hypermethylation and histone deacetylation. While both growth inhibitory and growth stimulatory genes could be upregulated by these inhibitors, tumor progression during oncogenesis is thought to involve silencing of tumor suppressor genes in excess of oncogenes. Thus, growth inhibitory genes might be upregulated preferentially by treatment with demethylating agents and HDAC inhibitors. Early clinical trials have demonstrated that demethylating agents and HDAC inhibitors can be administered together at effective doses to treat hematologic malignancies.13
Several putative tumor suppressor genes are imprinted and expressed from only a single non-imprinted allele in normal cells. Our previous studies have identified 7 imprinted tumor suppressor genes that are downregulated in ovarian cancers.14 Among these genes, ARHI and PEG3 are the most markedly downregulated with reduced expression in approximately 63–88% and 75% of ovarian cancers, respectively.15,16 ARHI and PEG3 can be downregulated by LOH or can be silenced by promoter hypermethylation of both alleles.16 In addition, ARHI expression is downregulated transcriptionally and post-transcriptionally in ovarian cancer cells.17 Re-expression of ARHI can be achieved in cancer cells by treatment with AZA and TSA that, in combination, can stimulate transcription from both the imprinted and non-imprinted alleles.18 Re-expression of ARHI and PEG3 strongly inhibit clonogenic growth of ovarian cancers.16 Re-expression of ARHI causes autophagic death of cultured human ovarian cancer cells and induces tumor dormancy in xenografts.19 Autophagy is characterized by the accumulation of multi-lamellar vacuoles that engulf cytoplasm and organelles, forming autophagosomes marked by microtubule-associated protein light chain 3 (MAP-LC3). Autophagosomes then fuse with lysosomes, releasing their contents for hydrolysis, which can temporarily sustain energy production by stressed cells, but can prove lethal if prolonged.20
In the current study, we measured the anti-proliferative activity of two demethylating agents - DAC and AZA - and two HDAC inhibitors - SAHA and TSA - individually and in combination against human Hey and SKOv3 ovarian cancer cells. To identify mechanisms underlying growth inhibition, we measured changes in cell cycle, apoptosis and autophagy. We have tested the hypothesis that growth inhibition would be associated with re-expression of growth inhibitory tumor suppressor genes, including ARHI and PEG3, and that these genes might be used as biomarkers for effective dosing of demethylating agents and HDAC inhibitors in cell culture and in xenografts.
MATERIALS AND METHODS
Reagents and cells
AZA (Pharmion Corp., Boulder, CO), and DAC (Sigma-Aldrich, St. Louis, MO) were dissolved in distilled water. TSA (Sigma-Aldrich) was dissolved in ethanol. SAHA was synthesized according to Gediva et. al. 21 and dissolved in DMSO. The characterization of SAHA is in agreement with the reference and the purity is >95% based on LCMS analysis. Cells were maintained in RPMI-1640 (Hey) or McCoy’s 5A (SKOv3) medium, supplemented with 10% fetal bovine serum, 100 mM L-glutamine, 100 µg/ml streptomycin and 100 U/ml penicillin. The identity of both cell lines was confirmed by DNA satellite signature analysis.
Cell growth assays
Growth of Hey and SKOv3 cells was evaluated by Sulforhodamin B (SRB) staining as described.19 Briefly, Hey (1.5×10³) and SKOv3 (2×10³) cells were plated in triplicates in 96-well plates for 24 hrs and treated with DAC, AZA, SAHA, and TSA, individually or in combination with serial 2-fold dilutions of the two agents. Culture media were changed daily with freshly added inhibitors. Cells were harvested on day 5 for SRB assays and the values were normalized to untreated controls.
RNA extraction and real-time RT-PCR
Expression of ARHI and PEG3 was measured using real-time quantitative reverse transcription-PCR (RQ RT-PCR) as described.16 The primers for ARHI and PEG3 were purchased from Applied Biosystems. Relative levels of ARHI and PEG3 mRNA were normalized to a concurrent determination for GAPDH mRNA. All samples were measured in triplicate and the experiments were repeated twice.
Measurement of induction of apoptosis
Cultured cells were treated with DAC, SAHA, or their combination for 5 consecutive days without changing the medium. Caspase 3 and 7 activities were measured using the Caspase-Glo 3/7 Assay (Promega, Madison, WI).
Cell cycle analysis
Cells were grown for 24 hrs and treated with DAC, SAHA, or their combination for 1, 3, or 5 days. Cell viability was assessed by staining with propidium iodide (PI) and analyzed by flow cytometry.
Detection of autophagy with GFP-LC3
Cultured cells were treated with DAC, SAHA, or a combination for 3 days. On day 3, cells were transfected with green fluorescence protein-tagged MAP-LC3 (GFP-LC3) plasmid. After 24 hrs cells were fixed in 4% paraformaldehyde for 30 min and mounted for confocal microscopy. GFP fluorescence was visualized with a confocal microscope, and autophagic cells that demonstrated punctate GFP-LC3 staining were counted.
Detection of autophagy with acridine orange staining
Ovarian cancer cells were seeded and treated as described for the cell cycle assays. At the indicated times, cells were incubated with medium containing 0.5 µg/ml acridine orange (Molecular Probes, Eugene, OR) for 15 min in the dark, detached by trypsinization, washed and analyzed by FACS.
Transmission electron microscopy
Transmission electron microscopy (TEM) was used to confirm morphologically the induction of autophagy by examining alterations in the subcellular structures of Hey cells in culture and in xenografts. Cells were cultured and treated with DAC and/or SAHA for 5 days. Cultured cells and tumor xenografts were fixed, and prepared for TEM as described.19 Representative areas were chosen for ultrathin sectioning and viewed with a JEM 1010 transmission electron microscopy.
siRNA Transfection
Hey cells were cultured and treated with DAC and/or SAHA for 3 days. Transfection with control or ARHI siRNA was performed on day 2 using the DharmaFECT#4 reagent (Dharmacon Research, Lafayette, CO). A mixture of siRNA (100 nM final concentration) and transfection reagents was incubated at room temperature for 20 min and then added to cells. After incubation for 48 hrs, cells were harvested for confocal microscopy with GFP-LC3 or flow cytometry with acridine orange staining.
Growth of ovarian cancer xenografts in nude mice
In vivo studies with Hey ovarian cancer xenografts were carried out in six-week-old female Balb-c nu/nu mice according to protocols approved by the Institutional Animal Care and Use Committee at the University of Texas MD Anderson Cancer Center. Twenty mice were divided into four treatment groups. Twelve additional mice were divided into four groups for histologic studies on day 22. All mice were injected intraperitoneally (i.p.) with 1×10⁶ Hey cells in 200 µl RPMI-1640 media. Two days later, mice were injected i.p. with (a) vehicle (control group), (b) DAC (0.8 mg/kg/3× a week), (c) SAHA (12.5 mg/kg/5× a week), or (d) combination of DAC and SAHA at the same dose as the single agent treatments. Treatment was continued for 21 days. On day 22, tumors from three mice of each group were collected and prepared for TEM. The remaining five mice from each group were evaluated daily for morbidity and mortality.
Biostatistical analysis
All experiments were repeated independently at least two times. To assess in vitro growth inhibition and synergistic inhibition, we used the SYNERGY22 program which estimates dose-response curves for each agent, alone and combined, and quantifies drug interaction at different inhibitory levels. One may conclude synergy when the interaction index is less than 1 and its 95% confidence interval lies below 1. The analysis is based on the Median-Effect Principle and the Combination Index Method.23 A regression based analysis was used to test for association between growth inhibition and gene expression. For the in vivo study, statistical significance of difference among survivals in mice was analyzed by the log-rank test.24 We used the Efron method25 to handle observations that had tied survival times. p values were obtained by 1-sided analysis and significance was assumed at p<0.05.
RESULTS
DNA methyltransferase inhibitors and HDAC inhibitors decrease growth of ovarian cancer cells
To identify optimal drugs, we compared the anti-proliferative activity of two DNA methylation inhibitors - DAC and AZA - and two HDAC inhibitors - SAHA and TSA - in two human ovarian cancer cell lines. Hey and SKOv3 cells were treated with increasing concentrations of DAC (0–100 µM), AZA (0–100 µM), SAHA (0–32 µM) or TSA (0–2 µM). Growth was measured after 5 days of treatment. Viability of both Hey and SKOv3 cells was reduced in a dose-dependent manner for all four agents (Fig. 1). For cells treated with DAC, the reduction in viability at increasing doses could be fitted by hyperbolic curves which decreased to asymptotes at approximately 30% for Hey and 60% for SKOv3 cells. In the case of SKOv3 cells, there was no further increase in DAC’s anti-proliferative activity at concentrations higher than 32 µM. However, treatment with AZA at doses >50 µM killed all the Hey cells and decreased SKOv3 cells at an asymptote of 15%. In contrast to the DNA methylation inhibitors, both HDAC inhibitors were very toxic to cells, where all cells were killed at concentrations >8 µM and >0.72 µM for SAHA and TSA, respectively (Fig. 1). The IC50 and IC75 for each agent, individually and in combination, are presented in Table 1.
Figure 1. Antiproliferative activities of demethylating agents and histone deacetylase inhibitors on ovarian cancer cells.

(A) Hey or (B) SKOv3 cells were treated with indicated concentrations of demethylating agents (DAC, AZA) and HDAC inhibitors (SAHA, TSA), individually or in combinations. Cell proliferation was determined on day 5 with SRB assays. Data plotted represent optical density of SRB stained cells treated with the different agents normalized to values for untreated control cells.
Table 1.
Growth inhibition of DNA methylation inhibitors and HDAC inhibitors for Hey and SKOv3 ovarian cancer cells.
| Hey | SKOv3 | |||
|---|---|---|---|---|
| Treatment | IC50 (µM) | IC75 (µM) | IC50 (µM) | IC75 (µM) |
| AZA | 6.10 | 12.35 | 13.16 | 45.82 |
| DAC | 35.2 | 284.3 | 385.5 | 21501.1 |
| SAHA | 1.92 | 3.84 | 1.21 | 3.05 |
| TSA | 0.092 | 0.178 | 0.071 | 0.163 |
| AZA+SAHA | 3.52+0.80* | 7.53+1.72* | 6.11+0.36* | 15.38+0.91* |
| AZA+TSA | 4.04+0.046* | 7.99+0.091* | 7.53+0.025* | 17.39+0.057* |
| DAC+SAHA | 0.44+0.024* | 2.59+0.14* | 2.27+0.076* | 11.42+0.38* |
| DAC+TSA | 0.80+0.0022* | 3.91+0.011* | 3.93+0.011* | 14.55+0.040* |
For the combination treatments, we provide an estimate and 95% confidence interval for the second drug based on the experimental design, which set the dose of the second drug to be a constant ratio of the first drug’s dose.
DAC and SAHA exert synergistic inhibition of cell growth
To explore the potential interaction between DNA methylation inhibitors and HDAC inhibitors, we treated Hey and SKOv3 cells with DAC or AZA in combination with SAHA or TSA. The concentrations for each agent were determined based on the combination design proposed by Chou26, in which a mixture of one DNA methylation inhibitor and one HDAC inhibitor with the diagonal constant ratio [(IC50 of DAC or AZA):(IC50 of SAHA or TSA)] was serially diluted before addition to the cells. In every set of experiments, the combination of one DNA methylation inhibitor and one HDAC inhibitor resulted in a significantly more pronounced cell kill when compared to treatment with each single agent (Fig. 1, Table 1). When results for each combination of inhibitors were analyzed for additive, synergistic, or antagonistic effects, the most prominent synergistic interaction was observed between DAC and SAHA for both Hey and SKOv3 cells. Other combinations resulted in primarily additive toxicity. Based on these results, we chose the combination of DAC and SAHA at their IC50 values for all subsequent cell culture studies.
Treatment with DAC and SAHA induces apoptosis
To examine whether the anti-proliferative effect of DAC and SAHA could be attributed to the induction of apoptosis, caspase3/7 activities were analyzed in Hey and SKOv3 cells that had been treated for 5 days with DAC and/or SAHA at concentrations that resulted in 50% inhibition of cell growth. As shown in Figure 2, treatment with DAC and SAHA alone induced caspase activity in SKOv3, but not Hey cells. However, the combination of DAC and SAHA synergistically increased caspase activity in both cell lines.
Figure 2. DAC and SAHA induce apoptosis in ovarian cancer cells.

Ovarian cancer cells were treated with DAC and SAHA for 5 days at their respective IC50 concentrations (see Table 1). Apoptosis in control and treated cells were determined by analysis of caspase 3/7 activities in (A) Hey or (B) SKOv3 cells or by flow cytometry in (C) Hey or (D) SKOv3 cells.
A combination of DAC and SAHA arrests ovarian cancer cells in G2/M
To determine whether the anti-proliferative effect of DAC and SAHA might also result from cell cycle arrest, cell cycle analyses were performed on cells treated for 1, 3 and 5 days. The percentage of cells in G1, S, and G2/M phase are shown in Figure 3. When used individually, treatment with SAHA had only a modest and inconsistent effect on cell cycle over the course of the experiment. DAC arrested a progressively greater number of cells in G2/M over time with 16.1% on day 1, 28.7% on day 3 and 35.3% on day 5 in Hey cells. DAC alone failed to affect the fraction of SKOv3 cells in G2/M, but the combination of the two agents produced G2/M arrest in both cell lines. In Hey cells, treatment with a combination of DAC and SAHA increased the fraction of cells in G2/M progressively from 23.8%, on day 1 to 44.9% on day 5. A more modest effect was observed with SKOv3 cells on day 5 where 20.4% of cells treated with the combination were in G2/M compared to 14.1% for the controls. While both cell lines responded to the combination treatment by increasing the fraction of G2/M cells, the change in Hey cells was more evident. The underlying mechanism that contributes to this dichotomous effect is not clear. We also quantified the sub-G0/G1 fraction as an additional assessment of apoptosis. Consistent with the caspase activity, DAC alone showed modest increase in the fraction of sub-G0/G1 cells while SAHA had no effect. Combination treatment with DAC and SAHA resulted in synergistic increase in apoptotic cells (Fig. 2 C & D).
Figure 3. DAC and SAHA induce cell cycle arrest.

(A) Hey or (B) SKOv3 cells were treated with DAC, SAHA or a combination at their respective IC50. On days 1, 3, and 5, cells were harvested and the fraction of cells in G1, S and G2/M phases was determined by flow cytometry.
DAC and SAHA induce autophagy in Hey ovarian cancer cells
DAC and SAHA inhibited proliferation of both Hey and SKOv3 cells by apoptosis and G2/M arrest. A third possible mechanism that could contribute to their growth inhibitory effects is autophagic cell death. To assess this possibility, Hey and SKOv3 cells were transiently transfected with a GFP-LC3 plasmid, treated with DAC and SAHA for 3 days and then examined under a confocal fluorescence microscope. Treatment of Hey cells with DAC induced autophagy, as indicated by an increase in the GFP-LC3 puncta (Fig. 4A). Although SAHA alone did not induce autophagy, it enhanced DAC’s ability to induce autophagy. When the GFP-LC3 puncta were counted in Hey cells, the number of puncta increased from 60 puncta/100 cells for the control cells to 150 puncta/100 cells for the DAC and SAHA-treated cells. In contrast, autophagy was not observed in SKOv3 cells when treated with these agents.
Figure 4. DAC induces autophagy in Hey cells but not in SKOv3 cells.

(A) Hey and SKOv3 ovarian cancer cells were transfected with GFP-LC3 plasmids and treated with DAC, SAHA, or a combination at their respective IC50 concentrations. Formation of punctate GFP-LC3 spots is indicative of autophagy. (B) Hey and SKOv3 cells were treated with DAC or SAHA for 1, 3, and 5 days. After staining with acridine orange, the fraction of autophagic cells was determined by flow cytometry. (C) Hey cells were treated with DAC or SAHA, or a combination for 5 days. Cells were then harvested and processed for TEM. The arrows indicate autophagosomes. N, nucleus; M, mitochondria.
To confirm that these agents induced autophagy, we employed acridine orange staining followed by flow cytometry. Figure 4B shows that DAC induced autophagy in Hey with 36% acridine positive cells on day 3 and 35% on day 5. Consistent with the GFP-LC3-transfected cells, SAHA alone did not induce autophagy but the combination of SAHA and DAC increased acridine positive cells to 49% on day 3 and 51% on day 5. No autophagy was observed for SKOv3 for all treatment groups. Finally, we used TEM to document autophagy in Hey cells treated for 5 days with diluent, DAC, SAHA, or both agents. Figure 4C shows that treatment with DAC induced formation of autophagosomes when compared to the control group. Whereas SAHA alone did not induce autophagy, addition of DAC+SAHA further enhanced the number of autophagosomes,
Upregulation of ARHI and PEG3 correlate with growth inhibition induced by a combination of DAC and SAHA
We have shown earlier that ARHI and PEG3 are downregulated in a majority of ovarian cancers and that their expression can be increased by treatment with demethylating agents and HDAC inhibitors.16 Here we have evaluated whether induction of ARHI and PEG3 in ovarian cancer cells correlates with inhibition of growth by DAC and SAHA. The expression of ARHI and PEG3 in Hey and SKOv3 cells were quantified after treatment for 5 days with DAC, SAHA or in combination (Fig. 5). Cell growth was measured in parallel cultures.
Figure 5. DAC reactivates ARHI and PEG3 expression in ovarian cancer cells.
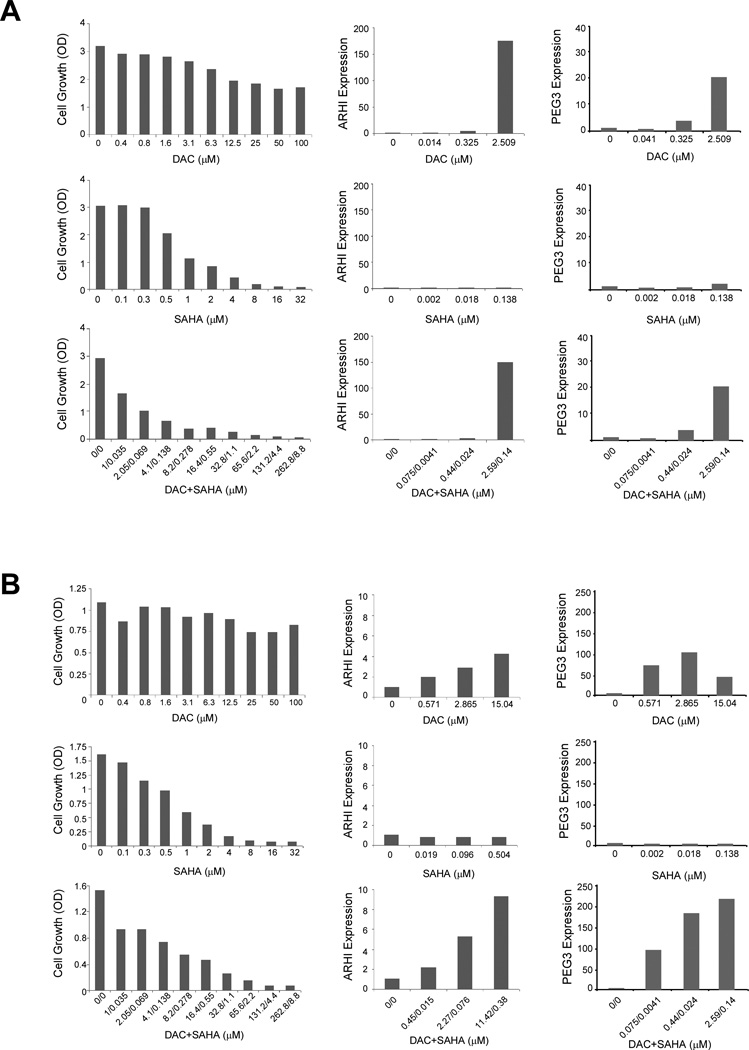
(A) Hey and (B) SKOv3 cells were treated for 5 days with indicated concentrations of DAC, SAHA, or a combination. Cells were analyzed for cell proliferation by SRB staining (left column), and for ARHI (middle column) and PEG3 (right column) expression by real-time RT-PCR. The quantitative analyses were repeated at least two times and one representative experiment is shown.
Treatment of Hey cells with DAC dramatically induced ARHI and PEG3 expression and was associated with a decrease in cell growth (Fig. 5A). Treatment with SAHA alone had little effect on ARHI and PEG3 expression, while completely inhibiting cell growth. The combination of DAC and SAHA was more potent for inhibiting cell growth and produced a dose-dependent increase in ARHI and in PEG3 mRNA. These data show that levels of ARHI and PEG3 correlated inversely with growth inhibition produced by a combination of DAC and SAHA.
For SKOv3 cells, DAC induced PEG3 and to a lesser extent ARHI, but had little effect on cancer cell growth (Fig. 5B). As in Hey cells, SAHA alone failed to induce ARHI and PEG3 expression, but inhibited growth by more than 90%. A combination of DAC plus SAHA produced dose-dependent induction of ARHI and PEG3 and greater than 90% inhibition of cancer cell growth.
A regression based analysis was used test for association between growth inhibition and gene expression. We fit a regression model to the gene expression data, adjusting for cell line, drug, and gene. Association was determined by significance in the regression slope coefficients. Significance was assumed at p<0.05. Growth inhibition of Hey cells correlated with induction of ARHI after treatment with DAC (p=0.000004) or a combination of DAC and SAHA (p=0.00002). PEG3 levels appeared to vary inversely with growth inhibition by DAC or a combination of DAC and SAHA, but a slight depression in PEG3 levels at IC75 precluded a statistically significant correlation in each case. Growth inhibition by DAC or a combination of DAC and SAHA in SKOv3 cells correlated with ARHI (p=0.03 and p=0.01) and with PEG3 levels (p=0.00009 and p=2.21E-13).
Expression of ARHI is required for optimal induction of autophagy by a combination of DAC and SAHA
Re-expression of ARHI by transfection or with a Tet-inducible promoter can produce autophagy in SKOv3 and Hey cells.19 The dramatic induction of ARHI following DAC treatment and the known role of ARHI in autophagy raise the possibility that DAC-induced autophagy may be mediated through ARHI. To test this hypothesis, Hey cells were transfected with siARHI before treatment with DAC and SAHA. Induction of autophagy was quantified by acridine orange staining and flow cytometry. As shown in Figure 6, knockdown of ARHI expression dramatically reduced autophagy induced by DAC or DAC+SAHA.
Figure 6. ARHI expression is required for DAC and SAHA-induced autophagy in Hey ovarian cancer cells.
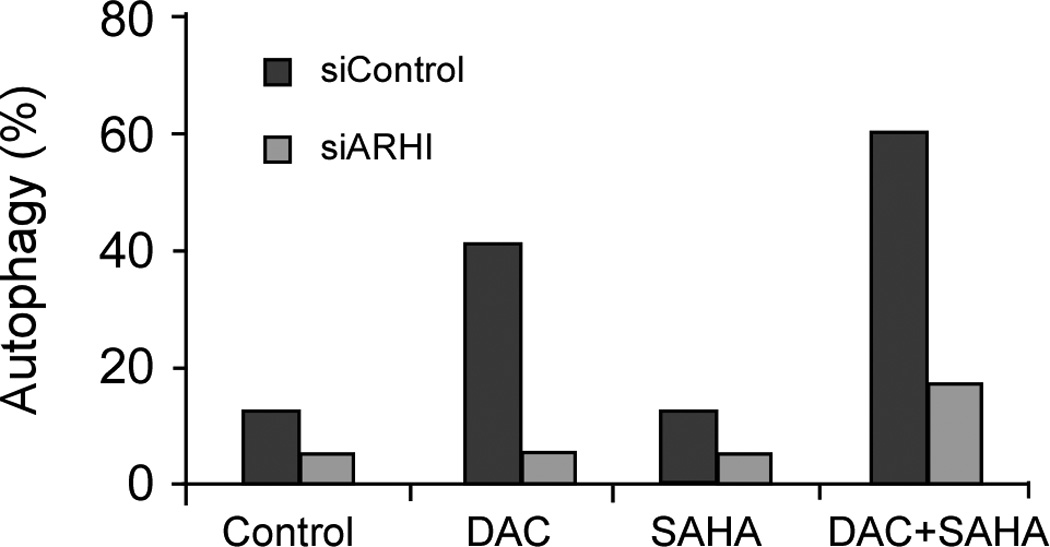
Hey cells were transfected with control siRNA (siControl) or ARHI siRNA (siARHI) and treated with DAC, SAHA, or a combination at their respective IC50 concentrations. Autophagic cells were determined by acridine orange staining. The figure shows results from one representative experiment.
To examine whether growth inhibition produced by DAC and SAHA might also depend, at least in part, on the re-expression of ARHI and PEG3, Hey and SKOv3 cells were transfected with control siRNA or a mixture of ARHI siRNA and PEG3 siRNA before they were treated with a combination of DAC and SAHA. Changes in cell proliferation were measured by SRB analysis. Our results showed that knockdown of ARHI and PEG3 had no effect on DAC- and SAHA-induced growth inhibition (data not shown), suggesting that the observed growth inhibition was mediated by other DAC and SAHA-responsive genes.
DAC and SAHA exhibit additive inhibition of ovarian cancer xenograft growth
To further validate our in vitro studies, we used nude mice with intraperitoneal human Hey ovarian cancer xenografts. Groups of mice were treated intraperitoneally with one of four treatments described in Materials and Methods. The effect of treatment on survival was evaluated, and the presence of autophagosomes was examined by TEM. Figure 7A displays the Kaplan-Meier survival curves for each of the four treatment groups. A test of significance of each difference from the control was provided by the log-rank test, using the Efron method25 to resolve observations that have tied survival times. Significance was assumed at p<0.05. While SAHA alone did not improve survival (p=0.135), DAC alone (p=0.0169) and DAC combined with SAHA (p=0.00184) for 3 weeks significantly increased survival.
Figure 7. DAC and SAHA inhibit growth of xenograft tumor and induce autophagy.
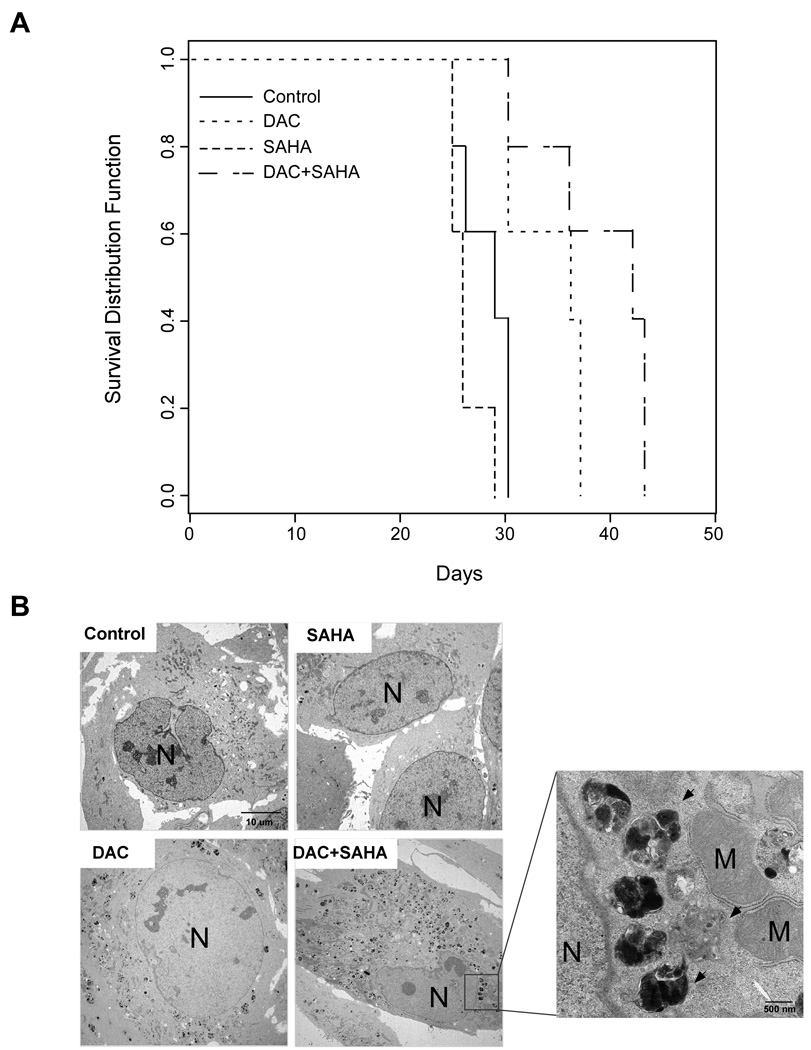
(A) Mice were injected i.p. with Hey (1×10⁶) cells. Two days later, mice were injected i.p. with (1) saline (control) (2) DAC, (3) SAHA, and (4) a combination of DAC and SAHA as described in Materials and Methods. Five mice from each group were evaluated daily for survival. (B) Hey xenograft tumors were treated as indicated for 21 days before they were harvested and processed for TEM. The arrows indicate the autophagosomes. N, nucleus; M, mitochondria.
Autophagy is found in ovarian cancer xenografts after DAC and SAHA treatment
To determine whether the action of DAC and SAHA in vivo was associated with the induction of autophagy, three mice in each group were sacrificed after 21 days of treatment and their xenograft tumors harvested for TEM to examine for the presence of autophagosomes. While no or a few autophagosomes were detected in the control and SAHA-treated groups, the number of autophagosomes was significantly increased in the DAC-treated groups, and the group treated with a combination of DAC and SAHA had the greatest number of autophagosomes (Fig. 7B). Thus the additive inhibition of xenograft growth observed with DAC and SAHA may due, in part, to autophagic death of ovarian cancer cells.
Treatment with DAC and SAHA reactivates the expression of ARHI and PEG3 in Hey ovarian cancer xenografts
As shown earlier, the combined treatment of DAC+SAHA reactivated both ARHI and PEG3 expression in cultured cells (Fig. 5). To determine whether the combined treatment could also reactivate the expression of ARHI and PEG3 in xenografts, we quantified ARHI and PEG3 transcripts in xenografts from mice treated with DAC+SAHA and compared with those from control mice. As shown in Figure 8, both ARHI and PEG3 transcripts were increased by approximately 1.5-fold in xenografts from DAC+SAHA-treated mice. The increase in ARHI expression was further demonstrated by an increased immunohistochemical staining with anti-ARHI antibody.
Figure 8. Treatment with a combination of DAC and SAHA reactivates the expression of ARHI and PEG3 in xenografts.
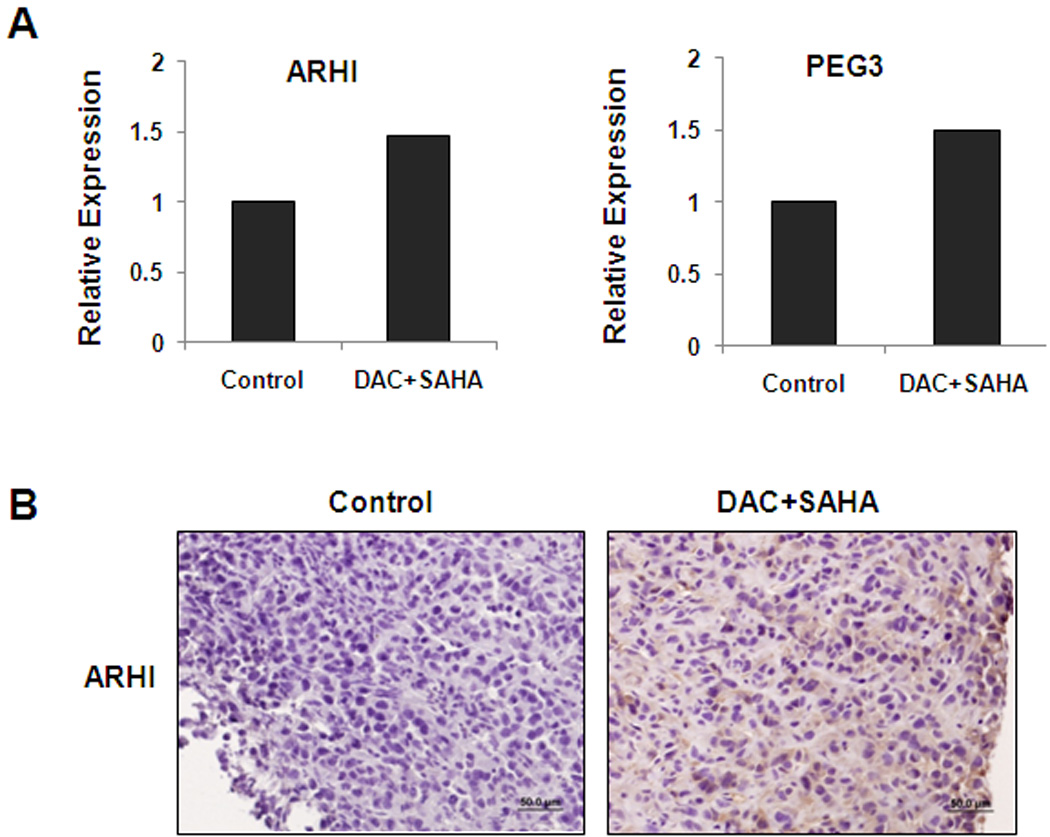
Hey xenograft tumors were treated with a combination of DAC and SAHA for 21 days. Tumors from two mice were harvested and processed for (A) RNA extraction to quantify ARHI and PEG3 RNA transcripts by real-time RT-PCR or (B) immunohistochemical staining with anti-ARHI antibody.
DISCUSSION
Our study demonstrates that a combination of a demethylating agent and a histone deacetylase inhibitor can exert synergistic inhibition of growth in ovarian cancer. This principle may apply to a variety of cancers that arise from different sites.27–30 Previous reports from the ovarian cancer literature have documented that demethylating agents31 and histone deacetylating agents32,33 can inhibit growth of multiple cell lines and primary cultures of ascites tumor cells32, enhancing the activity of carboplatin31 or paclitaxel.32,33 Moreover, treatment of xenografts with decitabine and HDAC inhibitor belinostat enhanced the activity of cisplatin, associated with upregulation of hMLH1.34 No interaction was noted between decitabine and belinostat in the absence of cisplatin. In our study, maximally tolerated doses of decitabine significantly inhibited Hey xenograft growth and treatment with decitabine in combination with SAHA provided super-additive inhibition of xenograft growth that approached statistical significance (p=0.068). Differences in outcome in cell culture and in xenografts may relate to pharmacologic and pharmacokinetic considerations, particularly for SAHA. For patients with myelodysplastic syndrome35,36 or chronic myelogenous leukemia,37 administration of low-dose decitabine by intravenous infusion has produced therapeutic response. However, we chose to use maximally-tolerated doses of decitabine because of the route of administration (i.p. vs i.v.) and because we wanted to maximize the inhibitory effect of decitabine and SAHA in the growth of Hey tumor xenografts. The mice appear to tolerate these doses and regiments as there were no early deaths or significant weight loss with the combination treatment.
The growth inhibition produced in cell culture and in xenografts with demethylating agents and HDAC inhibitors may relate to re-expression of growth inhibitory tumor suppressor genes. While many genes may be upregulated or downregulated when cells are treated with demethylating agents alone38,39 or in combination with HDAC inhibitors40, a combination of the two agents can facilitate re-expression of hypermethylated40 and/or imprinted18 tumor suppressor genes, including ARHI and PEG3. Treatment with DAC increased expression of ARHI and PEG3 in both cell lines. While treatment with SAHA alone had minimal effect on ARHI and PEG3 expression, the combination of DAC and SAHA had a greater effect on the induction of both ARHI and PEG3. Growth inhibition produced by the combined treatment correlated inversely with levels of ARHI and PEG3.
The mechanism(s) by which DAC and SAHA inhibit tumor growth are multiple and may vary between different ovarian cancers. Both ARHI and PEG3 can inhibit clonogenic growth and ARHI produces cell cycle arrest.16 In the present study, the combination of DAC and SAHA produced apoptosis in both Hey and SKOv3 cell lines. In previous reports, treatment with SAHA has produced apoptosis in ovarian cancer cells32,33 but the induction of autophagy has not previously been noted. Treatment with DAC induced autophagy in Hey ovarian cancer cells and autophagy could be enhanced by concomitant treatment with both DAC and SAHA. As ARHI has been shown to induce autophagy,19 increased levels of this gene may contribute to autophagic cell death. Knockdown of ARHI reduced autophagy, consistent with the importance of ARHI in regulating this function.
Taken together, our data suggest that a combination of a demethylating agent and an HDAC inhibitor should have greater impact on ovarian cancer than either treatment alone and deserves further evaluation in the clinic. Re-expression of ARHI and PEG3 may provide useful biomarkers for identifying biologically optimal doses of the inhibitors.
Acknowledgements
This work was supported in part with funds from U.T. M.D. Anderson SPORE in Ovarian Cancer NCI P50 CA83639, the National Foundation for Cancer Research, the Zarrow Foundation and Mr. Stuart Zarrow. We acknowledge the NCI Cancer Center Support Grant (CA016672) for our Translational Chemistry Core Facility.
Footnotes
Financial Disclosures: There are no financial conflicts among the authors.
REFERENCES
- 1.Berek JS, Friedlander ML, Bast RC., Jr . Ovarian Cancer. In: Hong WK, Bast RC Jr, Hait W, Kufe D, Pollock RE, Weichselbaum RR, Holland JF, Frei E III, editors. Holland-Frei Cancer Medicine. 8th Edition. Shelton, CT: PMPH-USA; 2010. pp. 1344–1375. [Google Scholar]
- 2.Jemal A, Siegel R, Ward E, et al. Cancer Statistics, 2009. CA Cancer J. Clin. 2009;59:225–249. doi: 10.3322/caac.20006. [DOI] [PubMed] [Google Scholar]
- 3.Bast RC, Jr, Hennessy B, Mills GB. The Biology of Ovarian Cancer: New Opportunities for Translation. Nature Rev Cancer. 2009;9:415–428. doi: 10.1038/nrc2644. PMID: 19461667. [DOI] [PMC free article] [PubMed] [Google Scholar]
- 4.Baylin SB, Ohm JE. Epigenetic gene silencing in cancer - a mechanism for early oncogenic pathway addiction? Nat Rev Cancer. 2006;6:107–116. doi: 10.1038/nrc1799. [DOI] [PubMed] [Google Scholar]
- 5.Jones PA, Baylin SB. The fundamental role of epigenetic events in cancer. Nat Rev Genet. 2002;3:415–428. doi: 10.1038/nrg816. [DOI] [PubMed] [Google Scholar]
- 6.Issa JP. DNA methylation as a therapeutic target in cancer. Clin Cancer Res. 2007;13:1634–1637. doi: 10.1158/1078-0432.CCR-06-2076. [DOI] [PubMed] [Google Scholar]
- 7.Santos FP, Kantarjian H, et al. Decitabine in the treatment of myelodysplastic syndrome. Expert Rev Anticancer Therapy. 2010;10:9–22. doi: 10.1586/era.09.164. [DOI] [PubMed] [Google Scholar]
- 8.Fu S, Hu W, Iyer R, et al. A phase IB-IIA study to reverse platinum resistance by use of a hypomethylating agent azacitidine in platinum-resistant or refractory epithelial ovarian cancer. Cancer. doi: 10.1002/cncr.25701. In press. [DOI] [PMC free article] [PubMed] [Google Scholar]
- 9.Dokmanovic M, Clarke C, Marks PA. Histone deacetylase inhibitors: overview and perspectives. Mol Cancer Res. 2007;5:981–989. doi: 10.1158/1541-7786.MCR-07-0324. [DOI] [PubMed] [Google Scholar]
- 10.Zhang C, Richon V, Ni X, Talpur R, Duvic M. Selective induction of apoptosis by histone deacetylase inhibitor SAHA in cutaneous T-cell lymphoma cells: relevance to mechanism of therapeutic action. J Invest Dermatol. 2005;125:1045–1052. doi: 10.1111/j.0022-202X.2005.23925.x. [DOI] [PubMed] [Google Scholar]
- 11.Modesitt SC, Sill M, Hoffman JS, Bender DP. A phase II study of vorinostat in the treatment of persistent or recurrent epithelial ovarian or primary peritoneal carcinoma: a gynecologic oncology group study. Gyn Oncol. 2008;109:182–186. doi: 10.1016/j.ygyno.2008.01.009. [DOI] [PubMed] [Google Scholar]
- 12.Piekarz RL, Sackett DL, Bates SE. Histone deacetylase inhibitors of demethylating agents: Clinical development of histone deacetylase inhibitors for cancer therapy. Cancer J. 2007;13:30–39. doi: 10.1097/PPO.0b013e31803c73cc. [DOI] [PubMed] [Google Scholar]
- 13.Garcia-Manero G, Kantarjian HM, et al. Phase 1/2 study of the combination of 5-aza-2'-deoxycytidine with valproic acid in patients with leukemia. Blood. 2006;108:3271–3279. doi: 10.1182/blood-2006-03-009142. [DOI] [PMC free article] [PubMed] [Google Scholar]
- 14.Lu KH, Patterson AP, Wang L, et al. Selection of potential markers for epithelial ovarian cancer with gene expression arrays and recursive descent partition analysis. Clinical Cancer Res. 2004;10:3291–3300. doi: 10.1158/1078-0432.CCR-03-0409. [DOI] [PubMed] [Google Scholar]
- 15.Rosen DG, Wang L, Jain AJ, et al. Expression of the tumor suppressor gene ARHI in epithelial ovarian cancer is associated with increased expression of p21WAF1/CIP1 and prolonged progression-free survival. Clin Cancer Res. 2004;10:6559–6566. doi: 10.1158/1078-0432.CCR-04-0698. [DOI] [PubMed] [Google Scholar]
- 16.Feng W, Marquez RT, Lu Z, et al. Imprinted tumor suppressor genes ARHI and PEG3 are the most frequently downregulated in human ovarian cancers by loss of heterozygosity and promoter mehtylation. Cancer. 2008;112:1489–1502. doi: 10.1002/cncr.23323. [DOI] [PubMed] [Google Scholar]
- 17.Lu Z, Luo RZ, Peng H, et al. Transcriptional and posttranscriptional down-regulation of the imprinted tumor suppressor gene ARHI (DRAS3) in ovarian cancer. Clin Cancer Res. 2006;12:2404–2413. doi: 10.1158/1078-0432.CCR-05-1036. [DOI] [PubMed] [Google Scholar]
- 18.Fujii S, Luo RZ, Yuan J, et al. Reactivation of the silenced and imprinted alleles of ARHI is associated with increased histone H3 acetylation and decreased histone H3 lysine 9 methylation. Human Molecular Gen. 2003;12:1791–1800. doi: 10.1093/hmg/ddg204. [DOI] [PubMed] [Google Scholar]
- 19.Lu Z, Luo RZ, Lu Y, et al. A Ras-related imprinted tumor suppressor gene ARHI regulates autophagy and tumor dormancy in ovarian cancer. J Clin Invest. 2008;118:3917–3929. doi: 10.1172/JCI35512. [DOI] [PMC free article] [PubMed] [Google Scholar]
- 20.Levine B. Eating oneself and uninvited guests: autophagy-related pathways in cellular defense. Cell. 2005;120:159–162. doi: 10.1016/j.cell.2005.01.005. [DOI] [PubMed] [Google Scholar]
- 21.Gediya LK, Chopra P, Purushottamachar P, Maheshwari N, Njar VC. A new simple and high-yield synthesis of suberoylanilide hydroxamic acid and its inhibitory effect alone or in combination with retinoids on proliferation of human prostate cancer cells. J Med Chem. 2005;48:5047–5051. doi: 10.1021/jm058214k. [DOI] [PubMed] [Google Scholar]
- 22.Lee JJ, Kong M, Ayers GD, Lotan R. SYNERGY. 2006 Available at: http://biostatistics.mdanderson.org/SoftwareDownload.
- 23.Chou TC. The median-effect principle and the combination index for quantification of synergism and antagonism. In: Chou TC, Rideout DC, editors. Synergism and Antagonism in Chemotherapy. San Diego: Academic Press; 1991. pp. 61–101. [Google Scholar]
- 24.Mantel N. Evaluation of survival data and two new rank order statistics arising in its consideration. Cancer Chemotherapy Reports. 1966;50:163–170. [PubMed] [Google Scholar]
- 25.Efron B. The efficiency of Cox's likelihood function for censored data (1977) JASA. 72:557–565. [Google Scholar]
- 26.Chou TC. Theoretical basis, experimental design, and computerized simulation and antagonism in drug combination studies. Pharmacol Rev. 2006;58:621–681. doi: 10.1124/pr.58.3.10. [DOI] [PubMed] [Google Scholar]
- 27.Yang H, Hoshino K, et al. Antileukemia activity of the combination of 5-aza-2’-deoxycytidine with valproic acid. Leuk Res. 2005;29:739–748. doi: 10.1016/j.leukres.2004.11.022. [DOI] [PubMed] [Google Scholar]
- 28.Hurtubise A, Momparler RL. Effect of histone deacetylase inhibitor LAQ824 on antineoplastic action of 5-Aza-2’-deoxycytidine on human breast carcinoma cells. Cancer Chemother Pharmacol. 2006;58:618–625. doi: 10.1007/s00280-006-0225-6. [DOI] [PubMed] [Google Scholar]
- 29.Fandy TE, Carraway H, Gore SD. DNA demethylating agents and histone deacetylase inhibitors in hematologic malignancies. Cancer J. 2007;13:40–48. doi: 10.1097/PPO.0b013e31803c7359. [DOI] [PubMed] [Google Scholar]
- 30.Venturelli S, Armeanu S, Pathil A, et al. Epigenetic combination therapy as a tumor-selective treatment approach for hepatocellular carincoma. Cancer. 2007;109:2132–2141. doi: 10.1002/cncr.22652. [DOI] [PubMed] [Google Scholar]
- 31.Li Y, Hu W, et al. Azacitidine enhances sensitivity of platinum-resistant ovarian cancer cells to carboplatin through induction of apoptosis. Am J Obstet Gynecol. 2009;200:177. doi: 10.1016/j.ajog.2008.08.030. e1-177.e9. [DOI] [PubMed] [Google Scholar]
- 32.Sonnemann J, Gange J, et al. Comparative evaluation of the treatment efficacyof suberoylanilide hydroxamic acid (SAHA) and paclitaxel in ovarian cancer cell lines and primary ovarian cancer cells from patients. BMC Cancer. 2006;6:183. doi: 10.1186/1471-2407-6-183. [DOI] [PMC free article] [PubMed] [Google Scholar]
- 33.Dietrich CS, Greenberg VL, et al. Suberoylandilide hydroamic acid (SAHA) potentiates paclitaxel-induced apoptosis in ovarian cancer cell lines. Gynec Oncol. 2010;116:126–130. doi: 10.1016/j.ygyno.2009.09.039. [DOI] [PubMed] [Google Scholar]
- 34.Steele N, Finn P, Brown R, Plumb JA. Combined inhibition of DNA methylation and histone acetylation enhances gene re-expression and drug sensitivity in vivo. Brit J Cancer. 2009;100:758–763. doi: 10.1038/sj.bjc.6604932. [DOI] [PMC free article] [PubMed] [Google Scholar]
- 35.Cashen AF, Shah AK, et al. Pharmacokinetics of decitabine administered as a 3-h infusion to patients with acute myeloid leukemia (AML) or myelodysplastic syndrome (MDS) Cancer Chemother Pharmacol. 2008;61:759–766. doi: 10.1007/s00280-007-0531-7. [DOI] [PubMed] [Google Scholar]
- 36.Wijermans P, Lübbert M, et al. Low-dose 5-aza-2'-deoxycytidine, a DNA hypomethylating agent, for the treatment of high-risk myelodysplastic syndrome: a multicenter phase II study in elderly patients. J Clin Oncol. 2000;18:956–962. doi: 10.1200/JCO.2000.18.5.956. [DOI] [PubMed] [Google Scholar]
- 37.Issa JP, Gharibyan V, et al. Phase II study of low-dose decitabine in patients with chronic myelogenous leukemia resistant to imatinib mesylate. J Clin Oncol. 2005;23:3948–3956. doi: 10.1200/JCO.2005.11.981. [DOI] [PubMed] [Google Scholar]
- 38.Menendez L, Walker D, et al. Identification of candidate methylation-responsive genes in ovarian cancer. Mol Cancer. 2007;6:10–19. doi: 10.1186/1476-4598-6-10. [DOI] [PMC free article] [PubMed] [Google Scholar]
- 39.Adair SJ, Hogan KT. Treatment of ovarian cancer cell lines with 5-aza-2 deoxycytidine upregulates the expression of cancer-testis antigens and class I major histocompatibility complex-encoded molecules. Cancer Immunol. 2009;58:589–601. doi: 10.1007/s00262-008-0582-6. [DOI] [PMC free article] [PubMed] [Google Scholar]
- 40.Leshchenko V, Kuo PY, Shaknovich R, et al. Genome wide DNA methylation analysis reveals novel targets for drug development in mantel cell lymphoma. Blood. 2010;12:1182. doi: 10.1182/blood-2009-12-257485. [DOI] [PMC free article] [PubMed] [Google Scholar]