

Abstract
With aging, renal function tends to decline, as evidenced by reduced glomerular filtration rate. High-protein intake may further stress the kidneys by causing sustained hyperfiltration. To investigate whether dietary protein is associated with impaired renal function, we used data from 2 nested case-control studies within the Women’s Health Initiative Observational Study (n = 2419). We estimated protein intake using a FFQ and estimated glomerular filtration rate (eGFR) from cystatin C. To account for the original study designs, inverse probability weights were applied. Self-reported energy and protein were calibrated using biomarkers of energy and protein intake. Associations between protein intake and renal function were estimated by weighted linear and logistic regression models. Average calibrated protein intake (mean ± SD) was 1.1 ± 0.2 g/(kg body weight·d).Twelve percent (n = 292) of women had impaired renal function. The odds of impaired renal function, defined as eGFR <60 mL/(min·1.73m2), was not associated with calibrated protein intake. When eGFR was modeled continuously, there was no association with calibrated protein when protein was expressed in absolute (g/d) or relative to energy (protein % energy/d), but protein relative to body weight [g/(kg body weight·d)] was associated with higher eGFR. There was no evidence for effect modification by age, BMI, or general health status. These data suggest higher protein intake is not associated with impaired renal function among postmenopausal women without a diagnosis of chronic kidney disease.
Introduction
Higher dietary protein intake causes hyperfiltration, as measured by elevated estimated glomerular filtration rate (eGFR),7 in the short term, but whether protein detrimentally affects renal function is contentiously debated (1, 2). Sustained hyperfiltration may cause renal injury, leading to reduced renal function, and the American Dietetic Association and American Diabetes Association both recommend limiting protein intake to 0.8–1.0 [g/(kg body weight·d)] (~ <10–14% of energy from protein) among individuals with renal damage (3). An alternative hypothesis is that hyperfiltration is a normal, adaptive response to higher protein intake having no impact on renal function (4). Of critical importance to public health is whether diets higher in protein have detrimental effects on renal function among older adults without overt chronic kidney disease (CKD), i.e. having an eGFR >60 mL/(min·1.73m2) (5). Clinicians commonly prescribe higher protein intake in aging individuals to reduce sarcopenia and preserve lean body mass, enhance immune function, promote wound healing, and treat hypoalbuminemia.
Two serum markers, creatinine and cystatin C, are used in clinical practice to measure eGFR (6, 7). A systematic review of 24 studies comparing the diagnostic accuracy of both markers for impaired renal function reported that cystatin C had higher sensitivity compared with creatinine (81 vs. 69%) at a common specificity (88%) (8). While measuring cystatin C as a biomarker of renal function also has the advantage over creatinine of being independent of muscle mass (9, 10), cystatin C may be associated with adiposity independent of renal function (11). Thus, studies that carefully account for protein intake and BMI while measuring renal function using cystatin C as a measure of renal function are warranted.
Data from the Women’s Health Initiative Observational Study (WHI-OS) can inform this question by examining associations between protein intake and renal function among older women having a wide range of renal function. We evaluated cross-sectional associations between protein intake and renal function among 2419 postmenopausal women from the WHI to test the hypothesis that protein intake is associated with impaired renal function (12). We used established biomarkers of energy and protein intake to correct for measurement error in the reporting of dietary consumption data (13). The consistency of the association by age, BMI, and general health status was also evaluated.
Materials and Methods
Study population.
The WHI-OS, a prospective cohort study that enrolled 93,676 women ages 50–79 y between 1993 and 1998 at 40 U.S. clinical centers, has been described in detail elsewhere (14). Institutional review boards at each participating institution reviewed and approved the study. Women with CKD requiring dialysis were not eligible for participation in the WHI-OS. Data were combined from 2 nested case-control studies, each investigating the relationship between renal function and fracture rates (12). Matching factors for controls in the 2 studies were age, race/ethnicity, date of blood draw, and history of fracture (12). Of the 2535 women participating in the 2 case-control studies, 2419 (95.4%) had complete covariate information and were included in the analysis.
Outcome ascertainment.
For both case-control studies, serum cystatin C concentrations were measured using the Dade Behring BN-II nephelometer and Dade Behring reagents (GMI) using a particle-enhanced immunonephelometric assay. For 1 study, assays were conducted at Medical Research Laboratories International (Highland Heights, KY), reporting a sensitivity of 0.02 mg/L and an inter-assay CV of 5.7% with a measurement range of 0.25–7.9 mg/L. For the second case-control study, assays were conducted at University of Minnesota, Fairbanks (Minneapolis, MN) reporting an inter-assay CV from 2.3 to 3.1% with a range from 0.3 to 10.0 mg/L. To account for differences in cystatin C measurement between the 2 case-control studies, laboratory values were calibrated to the study reporting values consistent with population-based data (15) using cystatin C values measured in participants in both case-control studies (n = 42). The glomerular filtration rate was estimated from cystatin C using the equation:
Impaired renal function was defined by stage 3 CKD [eGFR <60 mL/(min·1.73m2)].
Exposure ascertainment.
All participants completed the FFQ at WHI-OS baseline. The self-administered FFQ included 122 items for individual foods/food groups and 19 adjustment items (17). Protein intake was characterized as absolute (g), relative to energy intake [as a percentage of total energy (% energy)], and relative to body weight [0.1 g protein/(kg body weight·d)] (18).
Calibrated protein estimation.
As previously described (13), the WHI Nutritional Biomarkers Study used objective biomarkers of total energy expenditure (approximately equivalent to energy intake in weight-stable persons) and protein intake to assess the measurement properties of the FFQ. Briefly, 544 Dietary Modification Trial participants from 12 WHI-OS clinical centers participated in a doubly labeled water protocol to estimate total energy expenditure over a 2-wk period and a 24-h urine collection to estimate nitrogen excretion from which protein consumption was calculated. These biomarkers were compared with the concurrent self-reported dietary intake data. For these analyses, calibrated energy and protein estimates were obtained by inserting FFQ consumption estimates and other participant characteristics obtained at baseline from the WHI-OS into regression equations (19–21). Separate equations were used for energy, absolute protein (g/d), and protein relative to energy (%energy/d). All 3 equations included BMI and age, and other predictive variables included race, education, income, smoking, and physical activity. For example, the equation for protein (% energy) was:
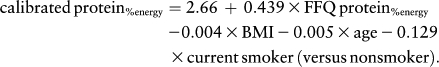 |
Covariate ascertainment.
Demographic characteristics (age, family income, education, race/ethnicity), medical history [hip fracture, emphysema, treated diabetes, hypertension (on medication and/or blood pressure >140/90 mm Hg), arthritis, cancer], and other health-related characteristics (i.e. general health status, defined as a self-reported categorical assessment of health ranging from excellent to poor) were obtained by self-report at WHI-OS baseline. BMI was computed using measured height and weight at baseline (weight in kg/height2 in m2). Energy, alcohol, and percent of energy from total fat were estimated from the FFQ. Smoking status was classified as current, past, or never.
Statistical analysis.
The association between protein intake and renal function was plotted to examine evidence of nonlinearity and/or threshold effects. Spearman correlations were used to describe associations between uncalibrated compared with calibrated measures of energy and protein intake with BMI. Summary statistics are reported as mean ± SD and model estimates as mean (95% CI) unless otherwise noted.
Because the participants of the 2 nested case-control studies were not a random sample of the WHI-OS population, ordinary regression models may introduce bias (22). To obtain estimates representative of the WHI-OS population, inverse probability weights were applied, including matching factors (age, race/ethnicity, date of blood draw), region (Northeast, South, Midwest, and West), and case status (fracture history) in the model for the weights (23, 24). Unweighted and weighted distributions of participant characteristics enrolled in the case-control studies (n = 2419) were compared with the entire WHI-OS (n = 93,676) to evaluate the acceptability of the model for the weights.
A series of weighted linear and logistic regression models were examined to evaluate the influence of energy intake, BMI, and other potential confounding factors on observed associations. Age, energy intake, and BMI were modeled continuously allowing for changes in the slope at each quintile by including splines in regression models (25). Robust SE for uncalibrated protein were estimated from weighted regression models and SE for calibrated protein were estimated using a bootstrapping procedure (500 replicates) to acknowledge the uncertainty in the regression calibration coefficients as well as that due to the sampling from the study population. The role of protein source (animal/vegetable) was considered using separate weighted regression models characterizing the exposure of interest as animal protein, vegetable protein, and proportion of total protein from animal sources. The consistency of the association by age, BMI, and general health status was evaluated by stratifying across categories of the potential effect modifier and testing for multiplicative interaction by including a cross-product term of the exposure and effect modifier in regression models.
Results
Mean calibrated protein intake was 1.1 ± 0.2 [g/(kg body weight·d)], exceeding the current Recommended Dietary Allowance for protein [0.8 g/(kg body weight·d)] (18). Twelve percent (n = 292) of women had impaired renal function [eGFR <60 mL/(min·1.73m2)]. Among women with impaired renal function, 224 were classified as stage 3a, 56 as stage 3b, 11 as stage 4, and 1 as stage 5. Case-control study participants were older and more likely to be a minority and have lower general health status relative to the entire WHI-OS population, but applying the inverse probability weights resulted in similar distributions between the 2 populations (data not shown). Women having impaired renal function were more likely to be older, white, have less education and lower income, drink less alcohol, report lower general health status, and have a medical history of stroke, diabetes, or myocardial infarction (all P < 0.05) (Table 1).
TABLE 1.
Characteristics of the women by estimated glomerular filtration rate (eGFR) categories defined by serum cystatin C1–3
| eGFR category in mL/(min·1.73 m2) |
||||
| Characteristic | Stage 1: >90 | Stage 2: 60 to <90 | Stage 3: <60 | |
| n, (%) | 2419 (100) | 728 (30) | 1416 (59) | 275 (11) |
| Unweighted, n (%) | Weighted, % | |||
| Age, y | ||||
| 50–59 | 546 (23) | 43 | 53 | 4 |
| 60–69 | 965 (40) | 29 | 62 | 9 |
| 70–79 | 908 (38) | 18 | 66 | 16 |
| Race/ethnicity | ||||
| White | 1316 (54) | 27 | 63 | 10 |
| Black | 566 (23) | 41 | 52 | 7 |
| Hispanic | 268 (11) | 40 | 56 | 4 |
| Other | 269 (11) | 53 | 42 | 5 |
| Education | ||||
| High school diploma or less | 627 (26) | 23 | 63 | 14 |
| Some college or associate degree | 896 (37) | 28 | 61 | 11 |
| College degree | 242 (10) | 36 | 60 | 4 |
| Some postgraduate | 654 (27) | 36 | 58 | 6 |
| Income | ||||
| <$20,000 or do not know | 696 (29) | 21 | 62 | 17 |
| $20,000–34,999 | 612 (25) | 27 | 63 | 10 |
| $35,000–49,999 | 449 (19) | 29 | 61 | 10 |
| $50,000–74,999 | 362 (15) | 32 | 63 | 5 |
| ≥$75,000 | 300 (12) | 45 | 51 | 4 |
| Smoking | ||||
| Never | 1318 (54) | 29 | 61 | 10 |
| Past | 913 (38) | 31 | 61 | 8 |
| Current | 188 (8) | 31 | 58 | 11 |
| Alcohol intake | ||||
| Never drinker | 436 (18) | 26 | 64 | 11 |
| Past drinker | 566 (23) | 25 | 61 | 15 |
| <1 drink/wk | 721 (30) | 24 | 66 | 10 |
| 1–6 drinks/wk | 479 (20) | 37 | 57 | 6 |
| ≥7 drinks/wk | 217 (9) | 45 | 51 | 4 |
| General health status | ||||
| Excellent/very good | 1210 (50) | 32 | 61 | 7 |
| Good | 869 (36) | 25 | 63 | 11 |
| Fair/poor | 340 (14) | 28 | 50 | 22 |
| Comorbid conditions | ||||
| Cardiovascular disease | 498 (21) | 31 | 61 | 8 |
| Congestive heart failure | 45 (2) | 8 | 45 | 48 |
| Stroke | 66 (3) | 21 | 65 | 14 |
| Diabetes (treated with pills or shots) | 190 (8) | 22 | 52 | 26 |
| Hypertension (treated or measured) | 972 (40) | 23 | 58 | 19 |
| Myocardial Infarction | 87 (4) | 27 | 45 | 28 |
| Unweighted mean ± SD | Weighted mean ± SE | |||
| BMI, kg/m2 | 27.9 ± 6.2 | 26.0 ± 29.6 | 27.9 ± 34.8 | 32.7 ± 40.3 |
| Total physical activity, MET/wk | 12.2 ± 13.5 | 16.4 ± 83.8 | 13.4 ± 92.6 | 9.7 ± 65.2 |
| Daily dietary intake | ||||
| Total energy,4Mcal | 1.54 ± 6.35 | 1.59 ± 3.73 | 1.57 ± 3.63 | 1.62 ± 3.22 |
| Calibrated total energy, Mcal | 2.09 ± 0.228 | 2.10 ± 0.110 | 2.12 ± 0.127 | 2.21 ± 0.139 |
| Protein, g | 63.6 ± 28.5 | 66.2 ± 170 | 65.3 ± 159 | 66.2 ± 147 |
| Calibrated protein, g | 75.0 ± 11.9 | 78.6 ± 67.7 | 78.8 ± 69.2 | 80.6 ± 65.2 |
| Protein, % energy | 16.5 ± 3.4 | 16.7 ± 19.0 | 16.7 ± 20.1 | 16.4 ± 17.7 |
| Calibrated protein, % energy | 14.2 ± 1.5 | 14.7 ± 8.3 | 14.4 ± 8.5 | 13.7 ± 7.6 |
| Protein, g/(kg body weight·d) | 0.9 ± 0.4 | 1.0 ± 2.6 | 0.9 ± 2.4 | 0.8 ± 1.9 |
| Calibrated protein, g/(kg body weight·d) | 1.1 ± 0.2 | 1.2 ± 1.3 | 1.1 ± 1.2 | 1.0 ± 0.8 |
| Unweighted mean ± SD | Weighted mean ± SE | |||
| Animal protein, g | 43.4 ± 23.2 | 44.8 ± 137.0 | 44.8 ± 131.9 | 46.0 ± 123.1 |
| Vegetable protein, g | 20.1 ± 9.0 | 21.3 ± 55.2 | 20.5 ± 49.3 | 20.1 ± 42.3 |
| Carbohydrate, % energy | 53.3 ± 9.6 | 53.7 ± 59.2 | 53.2 ± 56.3 | 51.3 ± 45.9 |
| Fat, % energy | 30.4 ± 8.6 | 28.4 ± 51.0 | 30.1 ± 49.9 | 33.1 ± 43.5 |
Stages of CKD per K/DOQI Guidelines (2) estimated using eGFR = 76.7 3 cystatin C.−1.19.
Unweighted summary statistics are and row percentages for categorical variables and mean ± SD for continuous variables. Weighted estimates account for factors associated with selection into original case-control studies (age, race/ethnicity, year of blood draw, region, and history of fracture). Weighted summary statistics are n and column percentages for categorical variables and mean ± SE for continuous variables.
The FFQ specifies 1 drink as: beer = 12 ounces (14 g ethanol), wine = 6 ounces (18 g ethanol), and liquor = 1.5 ounces (14 g ethanol).
1 kcal = 4.184 kJ.
When expressed in absolute terms or relative to calibrated energy intake, there was no significant linear association between eGFR and protein intake (Table 2, model 2) after accounting for potential confounding factors. Relative to body weight, each 0.1 g daily protein/kg body weight was associated with a 1.60 (95% CI = 0.89–2.84) unit higher eGFR in the adjusted weighted linear regression model (Table 2, model 2). Covariates were sequentially added to models and adding dietary fat (%energy) resulted in the largest change in effect estimates between model 1 and model 2. Models evaluating protein source (animal/vegetable) as the exposure were similar to total protein (data not shown). Uncalibrated and calibrated protein measures produced similar results and there were no qualitative differences in the results stratified by age, BMI, or general health status categories (data not shown).
TABLE 2.
Weighted linear associations (95% CI) between estimated glomerular filtration rate (e-GFR) as estimated by serum cystatin C and calibrated protein intake in women12
| Daily calibrated protein intake linear regression estimate (95% CI) |
|||
| Model | Absolute (per g) | Relative to energy intake (per 1% energy) | Relative to body weight [per 0.1 g/(kg body weight·d)] |
| Model 1 | 0.15 (0–0.28) | 0.78 (0.07–1.44) | 1.30 (0.66–2.13) |
| Model 2 | 0.17 (-0.08–0.43) | 0.49 (-0.27–1.28) | 1.60 (0.89–2.84) |
Weighted linear regression estimates account for factors associated with selection into original case-control studies (age, race/ethnicity, year of blood draw, region, and history of fracture).
Model 1: age, race/ethnicity, BMI. Model 2: Model 1+ calibrated energy, vegetable and fruit intake, percentage of energy from fat, education, income, smoking, physical activity, alcohol intake, general health status, previous medical conditions (cardiovascular disease, myocardial infarction, stroke, congestive heart failure, hypertension, treated diabetes).
Odds of impaired renal function were not significantly associated with quartile of protein intake (Table 3). There were trends toward an inverse association between protein intake and impaired renal function when protein was expressed in relation to energy intake (%energy/d) or body size [g/(kg body weight·d)].
TABLE 3.
Adjusted weighted OR of estimated glomerular filtration rate (e-GFR) < 60 in women by quartile of calibrated protein intake1
| Daily calibrated protein intake OR (95% CI) |
|||
| Absolute (g) | Relative to energy intake (% energy) | Relative to body weight [g/(kg body weight·d)] | |
| Quartile 2 | 0.96 (0.39–2.96) | 1.06 (0.47–2.03) | 0.93 (0.34–2.06) |
| Quartile 3 | 0.90 (0.24–3.04) | 1.06 (0.44–2.47) | 0.61 (0.22–1.63) |
| Quartile 4 | 1.22 (0.16–4.66) | 0.44 (0.19–1.66) | 0.48 (0.10–1.69) |
Weighted logistic regression model estimates (95% CI) comparing protein intake to the lowest quartile, accounting for factors associated with selection into original case-control studies (age, race/ethnicity, year of blood draw, region, and history of fracture). Covariates were age, race/ethnicity, BMI, calibrated energy, vegetable and fruit intake, percentage of energy from fat, education, income, smoking, physical activity, alcohol intake, general health status, and previous medical conditions (cardiovascular disease, myocardial infarction, stroke, congestive heart failure, hypertension, and treated diabetes).
Discussion
Protein intake was associated with slightly higher renal function among postmenopausal women when using calibrated protein expressed relative to body weight as the exposure measure. There was no association with renal function when protein intake was expressed in absolute terms or relative to energy intake. Though longitudinal and trial data are needed to draw causal inferences, these data suggest higher protein intake does not adversely affect renal function among women with normal or slightly impaired renal function.
A major contribution of the current analysis was using cystatin C to evaluate the relation between protein intake and renal function. Previous studies used serum creatinine to estimate renal function, but creatinine excretion is positively associated with muscle mass. Because protein intake may preserve lean body mass (26), higher protein intake may result in changes in serum creatinine concentration indicative of changes in muscle mass rather than renal function. Data suggest cystatin C may be a better biomarker of impaired renal function and mortality compared with serum creatinine, but its concentration is positively associated with adiposity (15). These relations may explain why measures of protein intake that incorporated body size [g/(kg body weight·d)] were associated with higher renal function, whereas measures of protein intake that did not directly incorporate body weight (g/d and %energy) were not associated with renal function. The Cardiovascular Health Study reported associations between obesity and 7-y decline in renal function using creatinine, but no associations were observed using cystatin C (27).
The Nurses’ Health Study (NHS) also reported no association between high-protein intake and renal function decline among 1624 women over an 11-y follow-up period. The estimated change in GFR, as estimated by creatinine, was 0.25 mL/(min·1.73m2) (95% CI = −0.78–1.28) per 10-g increase in protein intake (28). Investigators observed stronger associations after accounting for dietary measurement error using a second self-reported measure of diet collected in a validation study. However, key differences between the NHS and this study conducted in WHI-OS include: 1) creatinine, rather than cystatin C, was used to estimate renal function; 2) measurement error was corrected using self-report data rather than objective biomarkers; 3) NHS assessed trajectories of renal function rather than cross-sectional associations; and 4) NHS did not examine protein intake relative to body weight.
Research examining whether restricting protein intake leads to preservation of renal function has been conducted predominantly in patients with moderate to severe renal insufficiency (1). Most evidence supports moderate restriction of protein intake, but follow-up has typically been short (29–31). The largest trial, the Modification of Diet in Renal Disease trial, demonstrated no effect of protein restriction on renal function (32, 33). A long-term follow-up of study participants from the Modification of Diet in Renal Disease trial reported those assigned to the restricted protein intake group had an increased risk of mortality [adjusted HR = 1.92 (95% CI = 1.15–3.20)] (34).
Nutrient intakes are highly correlated with each other, and the observed association between protein intake and higher renal function was attenuated after adding dietary fat to regression models. Proteins from plant sources deliver lower nonvolatile acid load and have decreased bioavailability of phosphorous, suggesting they are better protein sources for patients with CKD. We considered protein source (animal/vegetable) in our analysis using separate weighted regression models characterizing the exposure of interest as animal protein, vegetable protein, and proportion of total protein from animal sources. These models provided no evidence for a difference in the association between uncalibrated protein intake and renal function by protein source (data not shown). However, lack of a biomarker for protein source limits our ability to make inferences related to this question.
Acknowledging limitations of the current analysis could help to direct future research. Because this was a cross-sectional study, we cannot make inferences regarding the temporality of the observed associations. Longitudinal studies could inform whether higher protein intake is associated with rate of renal function decline as estimated by cystatin C and creatinine. If women with reduced renal function were advised by their physicians to limit protein intake, this could partially explain observed associations. However, in a sensitivity analysis excluding women with an eGFR <60 mL/(min·1.73 m2), our results were similar (data not shown). Longitudinal studies assessing change in renal function as measured by cystatin C as well as creatinine in relation to protein intake corrected for measurement error using biomarkers are needed.
In conclusion, these data suggest no adverse association between protein intake and renal function among postmenopausal women without overt CKD. We examined associations independent of demographic and lifestyle characteristics and comorbidities and evaluated consistency across the distribution of age, BMI, and general health status. Longitudinal studies using exposure and outcome measures similar to the current study would provide the opportunity to evaluate whether higher protein intake is associated with a more rapid decline in renal function among older adults. There is emerging evidence that higher protein intake may contribute to preservation of lean body mass (35) and reduced risk of frailty among older adults (19); however, it is important to evaluate the long-term potential health risks and benefits before suggesting changes to protein recommendations for older adults.
Acknowledgments
Louise Carter, Carol Cahill, Melissa Romaire, and Sarah Tom provided valuable editorial feedback and insights. A.Z.L., J.A.C., K.E.E., R.D.J., and R.L.P. designed and conducted research; J.M.B. and A.K.A. drafted the analytic plan and analyzed data; J.M.B., A.Z.L., M.L.N., and L.F.T. wrote the paper; and J.M.B. had primary responsibility for final content. All authors read and approved the final manuscript.
Footnotes
Supported by the National Heart, Lung, and Blood Institute, the NIH, and the U.S. Department of Health and Human Services through contracts N01WH22110, 24152, 32100-2, 32105-6, 32108-9, 32111-13, 32115, 32118-32119, 32122, 42107-26, 42129-32, and 44221. The project described was supported by award number K99AG035002 from the National Institute on Aging. The content is solely the responsibility of the authors and does not necessarily represent the official views of the National Institute on Aging or the NIH. This work was also supported by PO1 CA53996 and 5R01AG025441-03.
Abbreviations used: CKD, chronic kidney disease; eGFR, estimated glomerular filtration rate; NHS, Nurses’ Health Study; WHI-OS, Women’s Health Initiative Observational Study.
Literature Cited
- 1.Buckalew VM., Jr End-stage renal disease: can dietary protein restriction prevent it? South Med J. 1994;87:1034–7 [DOI] [PubMed] [Google Scholar]
- 2.Clinical practice guidelines for nutrition in chronic renal failure. K/DOQI, National Kidney Foundation. Am J Kidney Dis. 2000;35(6 Suppl 2):S1–140 [DOI] [PubMed] [Google Scholar]
- 3.American Diabetes Association Bantle JP, Wylie-Rosett J, Albright AL, Apovian CM, Clark NG, Franz MJ, Hoogwerf BJ, Lichtenstein AH, et al. Nutrition recommendations and interventions for diabetes: a position statement of the American Diabetes Association. Diabetes Care. 2008;31 Suppl 1:S61–78 [DOI] [PubMed] [Google Scholar]
- 4.Martin WF, Armstrong LE, Rodriguez NR. Dietary protein intake and renal function. Nutr Metab (Lond). 2005;2:25. [DOI] [PMC free article] [PubMed] [Google Scholar]
- 5.Levey AS, Coresh J, Balk E, Kausz AT, Levin A, Steffes MW, Hogg RJ, Perrone RD, Lau J, et al. National Kidney Foundation practice guidelines for chronic kidney disease: evaluation, classification, and stratification. Ann Intern Med. 2003;139:137–47 [DOI] [PubMed] [Google Scholar]
- 7.Shlipak MG, Sarnak MJ, Katz R, Fried LF, Seliger SL, Newman AB, Siscovick DS, Stehman-Breen C. Cystatin C and the risk of death and cardiovascular events among elderly persons. N Engl J Med. 2005;352:2049–60 [DOI] [PubMed] [Google Scholar]
- 8.Roos JF, Doust J, Tett SE, Kirkpatrick CM. Diagnostic accuracy of cystatin C compared to serum creatinine for the estimation of renal dysfunction in adults and children–a meta-analysis. Clin Biochem. 2007;40:383–91 [DOI] [PubMed] [Google Scholar]
- 9.Odden MC, Chertow GM, Fried LF, Newman AB, Connelly S, Angleman S, Harris TB, Simonsick EM, Shlipak MG. Cystatin C and measures of physical function in elderly adults: the Health, Aging, and Body Composition (HABC) Study. Am J Epidemiol. 2006;164:1180–9. [DOI] [PubMed] [Google Scholar]
- 10.Shlipak MG, Katz R, Fried LF, Jenny NS, Stehman-Breen CO, Newman AB, Siscovick D, Psaty BM, Sarnak MJ. Cystatin-C and mortality in elderly persons with heart failure. J Am Coll Cardiol. 2005;45:268–71 [DOI] [PubMed] [Google Scholar]
- 11.Vupputuri S, Fox CS, Coresh J, Woodward M, Muntner P. Differential estimation of CKD using creatinine- versus cystatin C-based estimating equations by category of body mass index. Am J Kidney Dis. 2009;53:993–1001 [DOI] [PMC free article] [PubMed] [Google Scholar]
- 12.LaCroix AZ, Lee JS, Wu L, Cauley JA, Shlipak MG, Ott SM, Robbins J, Curb JD, Leboff M, et al. Cystatin-C, renal function, and incidence of hip fracture in postmenopausal women. J Am Geriatr Soc. 2008;56:1434–41 [DOI] [PMC free article] [PubMed] [Google Scholar]
- 13.Neuhouser ML, Tinker L, Shaw PA, Schoeller D, Bingham SA, Horn LV, Beresford SA, Caan B, Thomson C, et al. Use of recovery biomarkers to calibrate nutrient consumption self-reports in the Women's Health Initiative. Am J Epidemiol. 2008;167:1247–59 [DOI] [PubMed] [Google Scholar]
- 14.Design of the Women's Health Initiative clinical trial and observational study. The Women's Health Initiative Study Group. Control Clin Trials. 1998;19:61–109 [DOI] [PubMed] [Google Scholar]
- 15.Kottgen A, Selvin E, Stevens LA, Levey AS, Van Lente F, Coresh J. Serum cystatin C in the United States: the Third National Health and Nutrition Examination Survey (NHANES III). Am J Kid Dis. 2008;51:385–94 [DOI] [PubMed] [Google Scholar]
- 16.Stevens LA, Coresh J, Schmid CH, Feldman HI, Froissart M, Kusek J, Rossert J, Van Lente F, Bruce RD III, et al. Estimating GFR using serum cystatin C alone and in combination with serum creatinine: a pooled analysis of 3,418 individuals with CKD. Am J Kid Dis. 2008;51:395–406 [DOI] [PMC free article] [PubMed] [Google Scholar]
- 17.Patterson RE, Kristal AR, Tinker LF, Carter RA, Bolton MP, Agurs-Collins T. Measurement characteristics of the Women's Health Initiative food frequency questionnaire. Ann Epidemiol. 1999;9:178–87 [DOI] [PubMed] [Google Scholar]
- 18.Food and Nutrition Board Dietary Reference Intakes for energy, carbohydrate, fiber, fat, fatty acids, cholesterol, protein, and amino acids (macronutrients) Report. Washington, DC: National Academies Press, 2005 [Google Scholar]
- 19.Beasley JM, LaCroix AZ, Neuhouser ML, Huang Y, Tinker L, Woods N, Michael Y, Curb JD, Prentice RL. Protein intake and incident frailty in the Women's Health Initiative observational study. J Am Geriatr Soc. 2010;58:1063–71 [DOI] [PMC free article] [PubMed] [Google Scholar]
- 20.Prentice RL, Huang Y, Kuller LH, Tinker LF, Horn LV, Stefanick ML, Sarto G, Ockene J, Johnson KC. Biomarker-calibrated energy and protein consumption and cardiovascular disease risk among postmenopausal women. Epidemiology. 2011;22:170–9 [DOI] [PMC free article] [PubMed] [Google Scholar]
- 21.Prentice RL, Shaw PA, Bingham SA, Beresford SA, Caan B, Neuhouser ML, Patterson RE, Stefanick ML, Satterfield S, et al. Biomarker-calibrated energy and protein consumption and increased cancer risk among postmenopausal women. Am J Epidemiol. 2009;169:977–89 [DOI] [PMC free article] [PubMed] [Google Scholar]
- 22.Jiang Y, Scott AJ, Wild CJ. Secondary analysis of case-control data. Stat Med. 2006;25:1323–39 [DOI] [PubMed] [Google Scholar]
- 23.Lee AJ, McMurchy L, Scott AJ. Re-using data from case-control studies. Stat Med. 1997;16:1377–89 [DOI] [PubMed] [Google Scholar]
- 24.Reilly M, Torrang A, Klint A. Re-use of case-control data for analysis of new outcome variables. Stat Med. 2005;24:4009–19 [DOI] [PubMed] [Google Scholar]
- 25.Harrell FE. Regression modeling strategies. New York: Springer; 1991 [Google Scholar]
- 26.Houston DK, Nicklas BJ, Ding J, Harris TB, Tylavsky FA, Newman AB, Lee JS, Sahyoun NR, Visser M, et al. Dietary protein intake is associated with lean mass change in older, community-dwelling adults: the Health, Aging, and Body Composition (Health ABC) Study. Am J Clin Nutr. 2008;87:150–5 [DOI] [PubMed] [Google Scholar]
- 27.de Boer IH, Katz R, Fried LF, Ix JH, Luchsinger J, Sarnak MJ, Shlipak MG, Siscovick DS, Kestenbaum B. Obesity and change in estimated GFR among older adults. Am J Kidney Dis. 2009;54:1043–51 [DOI] [PMC free article] [PubMed] [Google Scholar]
- 28.Knight EL, Stampfer MJ, Hankinson SE, Spiegelman D, Curhan GC. The impact of protein intake on renal function decline in women with normal renal function or mild renal insufficiency. Ann Intern Med. 2003;138:460–7 [DOI] [PubMed] [Google Scholar]
- 29.Pedrini MT, Levey AS, Lau J, Chalmers TC, Wang PH. The effect of dietary protein restriction on the progression of diabetic and nondiabetic renal diseases: a meta-analysis. Ann Intern Med. 1996;124:627–32 [DOI] [PubMed] [Google Scholar]
- 30.Dussol B, Iovanna C, Raccah D, Darmon P, Morange S, Vague P, Vialettes B, Oliver C, Loundoun A, et al. A randomized trial of low-protein diet in type 1 and in type 2 diabetes mellitus patients with incipient and overt nephropathy. J Ren Nutr. 2005;15:398–406. [DOI] [PubMed] [Google Scholar]
- 31.Hansen HP, Tauber-Lassen E, Jensen BR, Parving HH. Effect of dietary protein restriction on prognosis in patients with diabetic nephropathy. Kidney Int. 2002;62:220–8 [DOI] [PubMed] [Google Scholar]
- 32.Klahr S, Levey AS, Beck GJ, Caggiula AW, Hunsicker L, Kusek JW, Striker G. The effects of dietary protein restriction and blood-pressure control on the progression of chronic renal disease. Modification of Diet in Renal Disease Study Group. N Engl J Med. 1994;330:877–84 [DOI] [PubMed] [Google Scholar]
- 33.Levey AS, Greene T, Beck GJ, Caggiula AW, Kusek JW, Hunsicker LG, Klahr S. Dietary protein restriction and the progression of chronic renal disease: what have all of the results of the MDRD study shown? Modification of Diet in Renal Disease Study group. J Am Soc Nephrol. 1999;10:2426–39 [DOI] [PubMed] [Google Scholar]
- 34.Menon V, Kopple JD, Wang X, Beck GJ, Collins AJ, Kusek JW, Greene T, Levey AS, Sarnak MJ. Effect of a very low-protein diet on outcomes: long-term follow-up of the Modification of Diet in Renal Disease (MDRD) Study. Am J Kid Dis. 2009;53:208–17 [DOI] [PubMed] [Google Scholar]
- 35.Paddon-Jones D, Short KR, Campbell WW, Volpi E, Wolfe RR. Role of dietary protein in the sarcopenia of aging. Am J Clin Nutr. 2008;87:S1562–6 [DOI] [PubMed] [Google Scholar]