

Non-technical summary
Neurons in the dorsal lateral geniculate nucleus (dLGN) process and transmit signals from the retina to the visual cortex. Thalamocortical (TC) neurons and intrinsic interneurons receive input from the retina. TC neurons send output to the visual cortex, while interneurons inhibit TC neurons, forming an inhibitory feed-forward loop. Thus, interneurons are involved in tuning of temporal and spatial resolution of the visual information transmitted through the TC neurons. This processing is regulated by cortical excitatory feedback. To gain insights into the dynamics of cortical regulation, we investigated short-term synaptic plasticity at corticogeniculate synapses on both types of neurons in dLGN. We found depression at cortical synapses on interneurons in contrast to facilitation at cortical synapses on TC neurons. The depression and facilitation had distinctly different temporal characteristics. These differences in synaptic plasticity suggest that cortical feedback to dLGN might either attenuate or enhance thalamocortical transmission in a frequency-dependent manner.
Abstract
Abstract
Neurons in the dorsal lateral geniculate nucleus (dLGN) process and transmit visual signals from retina to visual cortex. The processing is dynamically regulated by cortical excitatory feedback to neurons in dLGN, and synaptic short-term plasticity (STP) has an important role in this regulation. It is known that corticogeniculate synapses on thalamocortical (TC) projection-neurons are facilitating, but type and characteristics of STP of synapses on inhibitory interneurons in dLGN are unknown. We studied STP at corticogeniculate synapses on interneurons and compared the results with STP-characteristics of corticogeniculate synapses on TC neurons to gain insights into the dynamics of cortical regulation of processing in dLGN. We studied neurons in thalamic slices from glutamate decarboxylase 67 (GAD67)–green fluorescent protein (GFP) knock-in mice and made whole-cell recordings of responses evoked by electrical paired-pulse and pulse train stimulation of cortical afferents. We found that cortical excitations of interneurons and TC neurons have distinctly different properties. A single pulse evoked larger EPSCs in interneurons than in TC neurons. However, repetitive stimulation induced frequency-dependent depression of interneurons in contrast to the facilitation of TC neurons. Thus, through these differences of STP mechanisms, the balance of cortical excitation of the two types of neurons could change during stimulation from strongest excitation of interneurons to strongest excitation of TC neurons depending on stimulus frequency and duration, and thereby contribute to activity-dependent cortical regulation of thalamocortical transmission between net depression and net facilitation. Studies of postsynaptic response patterns of interneurons to train stimulation demonstrated that cortical input can activate different types of neuronal integration mechanisms that in addition to the STP mechanisms may change the output from dLGN. Lower stimulus intensity, presumably activating few cortical afferents, or moderate frequencies, elicited summation of graded EPSPs reflecting synaptic depression. However, strong activation through higher intensity or frequency, elicited complex response patterns in interneurons caused at least partly by activation of calcium conductances.
Introduction
Neural circuits in the dorsal lateral geniculate nucleus (dLGN) in thalamus dynamically regulate transmission of visual signals from retina to visual cortex. The principal neurons in the nucleus, thalamocortical (TC) neurons, receive primary afferent input from retina and send primary output to visual cortex. Retinal afferents also excite intrinsic interneurons in dLGN which in turn inhibit TC neurons, thereby forming an inhibitory feed-forward loop (Fig. 1A). The main function of the inhibitory feed-forward loop is presumably state-dependent regulation of temporal and spatial resolution of the visual information transmitted to cortex through the TC neurons. TC neurons send axonal collaterals to neurons in the thalamic reticular nucleus (TRN), which in turn inhibit TC neurons, thereby forming an inhibitory feedback loop (Fig. 1A). The thalamocortical transmission is modulated by retinotopic feedback from visual cortex, and through state-dependent input from brainstem and forebrain nuclei that can change mode of operation of the thalamic neurons (Steriade et al. 1993; McCormick & Bal, 1997). In sleep and drowsiness, TC neurons are relatively hyperpolarized and generate slow synchronized activity caused by burst discharges (burst mode) that largely disrupts transmission of signals from retina to cortex (Steriade et al. 1997). In activated states, TC neurons are more depolarized and fire mainly repetitive single spikes that faithfully transfer retinal information to cortex (tonic mode). Like brainstem input, cortical feedback may shift the functional mode of TC neurons (Godwin et al. 1996b; Sherman, 2001; Wang et al. 2006), and in tonic mode seems to play a role in attention control (Singer, 1977) and function as a variable gain regulator (Ahlsén et al. 1985). However, corticothalamic neurons are orientation and direction selective (Grieve & Sillito, 1995). Thus, rather than general gain regulation, the cortical feedback may specifically excite those TC neurons that subsequently can enhance feature-selective responses of cortical neurons (Sillito et al. 2006).
Figure 1. Cortical excitation of dLGN neurons.
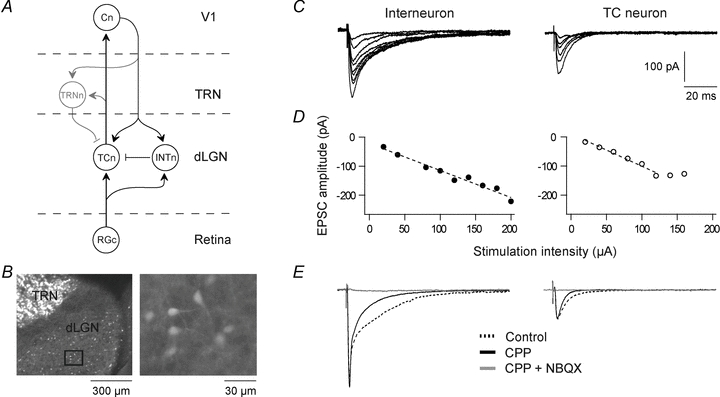
A, schematic wiring diagram of the geniculate circuit. RGc, retinal ganglion cell; TCn, thalamocortical neuron; INTn, intrinsic interneuron; TRNn, neuron of thalamic reticular nucleus; Cn, cortical neuron of primary visual area V1; arrow, excitatory connection; bar, inhibitory connection. B, section of a fixated brain slice prepared from GAD67-GFP (Δneo) mice. Left, dorsal part of dLGN and TRN with GFP-GAD67-positive cells (light grey). Right, enlargement of the area of dLGN marked by the square on the left. C, EPSCs evoked by electrical single pulse stimulation of corticogeniculate afferents at different stimulus intensities in an interneuron and a TC neuron. In all experiments GABA receptors were blocked by picrotoxin (50 μm) and CGP54626 (10 μm) added to the perfusion solution. D, amplitudes of EPSCs plotted as a function of stimulus intensity for the same neurons as in C. E, EPSCs mediated by ionotropic non-NMDA and NMDA receptors in an interneuron and a TC neuron. Dotted traces, responses in the control condition when GABAergic synaptic inputs were blocked by picrotoxin and CGP54626. Continuous traces, responses mediated by the non-NMDA component after application of 15 μm CPP. Grey traces, responses after application of 10 μm NBQX in addition to CPP. Membrane potential was kept at −60 mV. The same holding potential applies also to recordings in other figures.
Cortical feedback regulates the thalamic processing through excitatory input to TC neurons, interneurons and TRN neurons (Sherman & Guillery, 1996), indicating that the regulation depends on a dynamic balance between effects of the excitation of the three neural elements. Mechanisms of short-term plasticity (STP), which regulate synaptic strength in an activity-dependent manner (Zucker & Regehr, 2002; Abbott & Regehr, 2004), presumably play a key role in this dynamics. It is well established that corticogeniculate synapses on TC neurons and TRN neurons are facilitating (Lindström & Wróbel, 1990; Turner & Salt, 1998; von Krosigk et al. 1999; Granseth et al. 2002; Granseth, 2004; Alexander et al. 2006; Kielland et al. 2006), but with different temporal characteristics; EPSCs of TRN neurons quickly reach steady-state during pulse train stimulation of cortical afferents, whereas EPSCs in TC neurons have a wider dynamic range (Alexander et al. 2006).
Little is known about the role of interneurons in the cortical regulation of geniculate processing. We addressed this question through studies of STP of corticogeniculate synapses on interneurons, and compared this with STP of corticogeniculate synapses on TC neurons. Our results show that also interneurons may have an important role in the dynamic cortical regulation of thalamocortical transmission. We found short-term depression at the input to interneurons. The depression had faster kinetics than the facilitation of TC neurons. Single pulses or low-frequency pulse-stimulation of cortical afferents elicited strong excitation of interneurons in contrast to rather weak excitation of TC neurons. However, during higher-frequency stimulation of cortical afferents, the excitation of interneurons attenuated rapidly due to depression, while the excitation of TC neurons increased through pronounced facilitation. This suggests that the STP mechanisms may enable the corticothalamic feedback to change the balance between the excitation of interneurons and TC neurons and thereby contribute to activity-dependent cortical regulation of thalamocortical transmission between net depression and net facilitation. Current-clamp experiments demonstrated that cortical input to interneurons can activate different types of neuronal integration mechanisms, like the retinal input (Zhu et al. 1999b; Acuna-Goycolea et al. 2008). Activation of interneurons through lower stimulus intensity that gives simultaneous activation of few cortical afferents, or train stimulation with moderate frequency, elicited graded EPSPs. The summation of these potentials generally reflected short-term depression. However, strong activation through higher stimulus intensity or stimulus frequency elicited complex response patterns caused at least partially by activation of calcium conductances in the interneuron.
Methods
Ethical approval
Transgenic animals were bred in the local animal facilities and prepared for experiments in accordance with the guidelines and approval of the Animal Care Committee in Norway.
Slice preparation
Brain slices containing dLGN were prepared from glutamate decarboxylase 67 (GAD67)–green fluorescent protein (GFP) (Δneo) knock-in mice (Tamamaki et al. 2003). Mice, 28–41 days old (n = 55), were deeply anaesthetized with halothane and killed by rapid decapitation. A block of the brain was dissected out and 250–300 μm thick slices were cut parasagittaly at an angle at which corticogeniculate fibres were preserved (Turner & Salt, 1998). The slices were cut in 4°C oxygenated (5% CO2–95% O2) solution containing (mm): 75 glycerol, 87 NaCl, 25 NaHCO3, 2.5 KCl, 0.5 CaCl2, 1.25 NaH2PO4, 7 MgCl2, 16 d-glucose, and kept submerged in oxygenated (5% CO2–95% O2) artificial cerebrospinal fluid (ACSF) containing (mm): 125 NaCl, 25 NaHCO3, 2.5 KCl, 2 CaCl2, 1.25 NaH2PO4, 1 MgCl2 and10 d-glucose at 34°C for at least 30 min before the experiment.
Pharmacology and recording
During experiments, slices were kept submerged in a small chamber (volume, ∼1.5 ml) and perfused with ACSF at the rate of 5 ml min−1 heated to 36°C through an inline heater. Picrotoxin (50 μm) and [S-(R*,R*)]-[3-[[1-(3,4-dichlorophenyl)ethyl]amino]-2-hydroxypropyl] (cyclohexylmethyl)phosphinic acid hydrochloride (CGP54626; 10 μm) were added to the perfusion solution to block GABAA and GABAB synaptic inputs. NMDA receptors were blocked with (RS)-3-(2-carboxypiperazin-4-yl)-propyl-1-phosphonic acid (CPP; 15 μm) and (5S,10R)-(+)-5-methyl-10,11-dihydro-5H-dibenzo[a,d] cyclohepten-5,10-imine male-ate (MK801; 50 μm) where indicated. Non-NMDA receptor mediated currents were blocked with 2,3-dioxo-6-nitro-1,2,3,4-tetrahydrobenzo[f]quinoxaline-7-sulphonamine disodium salt (NBQX; 10 μm). Possible effect of activation of metabotropic glutamate receptors (mGluRs) was tested with application of group I/II mGluR antagonist (RS)-α-ethyl-4-carboxyphenylglycine (E4CPG; 200 μm) or group III mGluR antagonist (RS)-α-methylserine-O-phosphate (MSOP; 200 μm). Involvement of voltage-sensitive calcium channels was tested with the L-type Ca2+ channel blocker nimodipine (50 μm) and non-specific T-type Ca2+ blocker Ni2+ (0.2–0.4 mm). In a subset of experiments action potentials were blocked by 2-[(2,6-dimethylphenyl)amino]-N,N,N-trimethyl-2-oxoethaniminium chloride (QX222; 5 mm in the intracellular solution). Picrotoxin was obtained from Sigma-Aldrich (St Louis, MO, USA) while all other pharmacological agents were obtained from Tocris Bioscience (Bristol, UK).
Whole-cell voltage- or current-clamp recordings were made from interneurons and TC neurons in dLGN. Neurons were visualized using DIC optics and infrared video microscopy. Interneurons were identified by expression of GFP which was specifically expressed in GABAergic neurons (Fig. 1B) under control of the endogenous GAD67 promoter in the GAD67-GFP knock-in mice (Tamamaki et al. 2003) we used. Recordings were obtained with borosilicate glass electrodes (4–6 MΩ) filled with (mm): 115 potassium gluconate, 20 KCl, 10 Hepes, 2 MgCl2, 2 MgATP, 2 Na2ATP, 0.3 GTP (pH adjusted to 7.3 with KOH). Current traces were recorded (10 kHz sampling rate) and filtered at 3 kHz with a HEKA EPC 9 amplifier (HEKA Electronik, Lambrecht, Germany). Voltage traces were recorded (10 kHz sampling rate) and filtered at 10 kHz with an Axoclamp 2A amplifier (Molecular Devices, Sunnyvale, CA, USA). In both cases we used Pulse acquisition software (HEKA Electronik).
Stimulation protocols and data analysis
The membrane potential of the neurons was kept at –60 mV. The excitatory postsynaptic responses were evoked by electrical stimulation of corticogeniculate afferents with bipolar electrodes, using 20–200 μA current pulses of 100 μs duration. Before the experiment on each neuron, stimulus intensity was adjusted to elicit sufficiently strong response to minimize response variability. By these adjustments it was ensured that action potentials would not be elicited during voltage-clamp experiments. Stimulus protocols were single pulses, randomized paired-pulses (10 ms to 5 s inter-pulse intervals; 10 s inter-trial intervals), regular pulse trains (10 pulses at 10, 20 and 40 Hz; 30 s inter-trial intervals), two-part trains (a pre-train with 5 pulses at 2 or 5 Hz, followed by a main train with 10 pulses at 10 or 20 Hz; 60 s inter-trial intervals) and irregular pulse trains (10 pulses at 2.6–100 Hz; 60 s inter-trial intervals). Averages of 5–10 trials were used to measure the peak amplitudes of the evoked EPSCs. Amplitudes of the EPSCs were measured from baseline to peak. During high-frequency stimulation, however, EPSCs overlapped temporally. In such cases, baseline of the subsequent EPSC was extrapolated from a double-exponential function fitted to the decaying phase of the preceding EPSC.
Offline data analyses were performed with Igor Pro (WaveMetrics, Lake Oswego, OR, USA). Statistical analyses were performed with Igor Pro and SPSS (SPSS Inc., Chicago, IL, USA). Results are given as means ± SEM. The statistical difference between groups was determined using the Kruskal–Wallis test or related samples Friedman's two-way ANOVA by ranks, as indicated.
Results
Whole-cell voltage- or current-clamp recordings were made from intrinsic GABAergic interneurons (n = 54; resting membrane potential (RMP) =−60.4 ± 0.4 mV, input resistance (Rin) = 343.8 ± 25.6 MΩ) or TC neurons (n = 38, RMP −64.7 ± 0.5 mV, Rin= 163.5 ± 13.7 MΩ) in dLGN at 36°C. Corticogeniculate fibres were electrically stimulated with single pulses, paired pulses or pulse trains. Since we focused on excitatory corticogeniculate input, inhibitory synapses were blocked by GABAA and GABAB receptor antagonists added to the bath solution. Interneurons were identified by expression of GAD67-GFP in the 28–41 days old mice we used (Fig. 1B; Tamamaki et al. 2003).
Single-pulse stimulation of the optical radiation evoked EPSCs in both interneurons and TC neurons (Fig. 1C). The EPSCs increased in a graded manner with increasing stimulus intensity, indicating summation of a large number of small unitary events (Fig. 1D) reflecting input from multiple corticogeniculate inputs (Turner & Salt, 1998). At a given stimulus intensity the EPSC amplitude was considerably larger in interneurons than in TC neurons (Fig. 1E). The EPSCs were mediated by ionotropic non-NMDA and NMDA receptors. The non-NMDA component was pharmacologically isolated by 15 μm CPP, and the NMDA component by NBQX (10 μm). No postsynaptic current could be evoked in our experimental conditions when both non-NMDA and NMDA receptor blockers were added to the extracellular medium (Fig. 1E; interneurons, n = 7; TC neurons, n = 6).
Cortical input depresses interneurons in contrast to facilitation of TC neurons
We studied short-term synaptic plasticity of the isolated non-NMDA-receptor component. EPSCs of interneurons (n = 12) or TC neurons (n = 11) were evoked by paired-pulse stimulation of corticogeniculate afferents with inter-pulse intervals between 10 ms and 5 s. The magnitude of STP effects was quantified by the paired-pulse ratio (PPR) defined as the peak amplitude of the second EPSC (EPSC2) divided by the peak amplitude of the first EPSC (EPSC1), i.e. EPSC2/EPSC1.
The results demonstrated paired-pulse depression at corticogeniculate input to interneurons (Fig. 2A). At the input to TC neurons facilitation was found (Fig. 2B) consistent with previous studies (Lindström & Wróbel, 1990; Turner & Salt, 1998; von Krosigk et al. 1999; Granseth et al. 2002; Granseth, 2004; Alexander et al. 2006; Kielland et al. 2006). Accordingly, by shortening of inter-pulse intervals, increasing excitation of TC neurons was accompanied by a parallel decreasing excitation of the inhibitory interneurons.
Figure 2. Cortical feedback depresses interneurons but facilitates TC neurons.
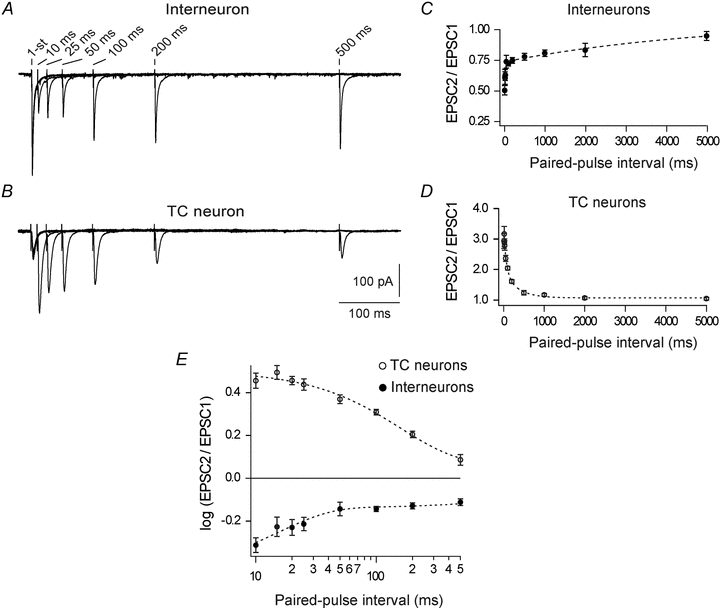
A and B, EPSCs evoked in an interneuron (A) and a TC neuron (B), by paired-pulse stimulation of corticogeniculate afferents. For each neuron traces obtained at different inter-pulse intervals are superimposed; inter-pulse intervals are indicated above the 2nd pulse in each trace. Each trace is an average of five trials with 10 s inter-trial intervals. Notice that the EPSC to the 2nd pulse decreased with shortening of the inter-pulse interval for the interneuron, demonstrating paired-pulse depression, but increased for the TC neuron, demonstrating paired-pulse facilitation. C, average paired-pulse depression ratio in interneurons (n = 12). D, average paired-pulse facilitation ratio in TC neurons (n = 11). E, paired-pulse effects for the same interneurons as in C (filled spots) and the TC neurons in D (open spots) re-plotted on double logarithmic axes. Dotted curves, double exponential functions fitted to the data. Notice the distinct temporal characteristics of short-term plasticity at corticothalamic synapses on interneurons (τf= 16.5 ± 1.14 ms, τs= 5.1 ± 1.3 s) and TC neurons (τf= 66.3 ± 22.1 ms, τs= 0.3 ± 0.1 s). Here and in other figures with average data, data points are mean ± SEM; the non-NMDA component was isolated by application of 15 μm CPP.
Paired-pulse depression and facilitation have different temporal characteristics
Paired-pulse depression was found in all interneurons studied. Maximal depression occurred at the shortest inter-pulse interval (10 ms) with an average paired-pulse ratio of 0.5 ± 0.04. The depression gradually decayed with increasing inter-pulse interval (PPR = 0.74 ± 0.05 at 50 ms; 0.78 ± 0.03 at 500 ms) and was almost absent at 5 s (PPR = 0.95 ± 0.04; Fig. 2C).
In TC neurons, the facilitation was strongest at 15 ms inter-pulse interval (PPR = 3.17 ± 0.25) but seemed to be less pronounced at the shortest interval tested (PPR = 2.93 ± 0.24 at 10 ms) consistent with previous observations of an early, short lasting depression at corticothalamic (Granseth et al. 2002) and other facilitating synapses (Stevens & Wang, 1995; Thomson & Bannister, 1999). For intervals longer than 15 ms, the facilitation gradually decayed with increasing intervals (PPR = 2.36 ± 0.1 at 50 ms; 1.24 ± 0.07 at 500 ms) and was almost unnoticeable after 1 s (PPR = 1.05 ± 0.05; Fig. 2D).
The temporal characteristics of the paired-pulse effects on TC neurons and interneurons were distinctly different. Plots of paired-pulse ratio against inter-pulse intervals could in both cases be fitted by double exponential functions with a fast (τf) and a slow (τs) time constant (Fig. 2C and D). Interestingly, the fast component of depression of interneurons (τf= 16.5 ± 1.14 ms) was only about one-quarter of the fast time component of facilitation of TC neurons (τf= 66.3 ± 22.1 ms). Thus, in the range of short inter-pulse intervals, the degree of depression of interneurons decreased more rapidly with increasing inter-pulse interval than the degree of facilitation of TC neurons. Moreover, the slow time constant of interneurons (τs= 5.1 ± 1.3 s) was more than 10 times longer than the slow time constant of TC neurons (τs= 0.3 ± 0.1 s). Accordingly, in the range of longer inter-pulse intervals, the decay of the depression in synapses of interneurons was considerably slower than the decay of the facilitation in the synapses of TC neurons.
In Fig. 2E the paired-pulse effects of interneurons and TC neurons (Fig. 2C and D) are re-plotted on double logarithmic axes for inter-pulse intervals up to 500 ms. The data suggest that the strongest amplification of thalamocortical transmission occurs at short inter-pulse intervals of the corticothalamic input, not only because the direct facilitation of TC neurons was strongest then, but also because the strong depression of interneurons was limited to the short inter-pulse intervals (<∼50 ms). At longer intervals (>∼50 ms) the depression of interneurons was moderate and rather stable as reflected in the large value of the slow time constant.
Effects of train stimulation
To study more directly how the balance between facilitation of TC neurons and depression of the inhibitory interneurons depends on the frequency of firing in the corticogeniculate afferents, we used pulse train stimulation. The firing properties of neurons in layer 6 of visual cortex of mice are unknown, but available data on lamina 6 neurons in visual cortex of awake, unanaesthetized cats, showed peak firing rates in responses to visual stimuli of about 75 spikes s−1 (Livingstone & Hubel, 1981). On this background we chose pulse trains with 10 pulses at 10, 20 or 40 Hz stimulation frequencies. STP effects were quantified by the train-pulse ratio, i.e. the peak amplitude of a subsequent EPSC (EPSCn), divided by the peak amplitude of the first EPSC (EPSC1), i.e. EPSCn/EPSC1.
In interneurons, the train stimuli at each frequency evoked a strong EPSC to the first pulse followed by EPSCs with amplitudes that rapidly decreased toward an approximately steady-state level. Thereby, the response pattern had an initial phasic component and a subsequent more sustained component as is illustrated in Fig. 3A (upper trace at each frequency) by results for a representative neuron. In TC neurons, the EPSC amplitudes increased markedly during the stimulus train from a rather small first EPSC toward a steady-state level (Fig. 3A, lower trace at each frequency), but the change toward steady-state was considerably slower than in interneurons.
Figure 3. Short-term plasticity evoked by pulse train stimulation of corticogeniculate afferents.
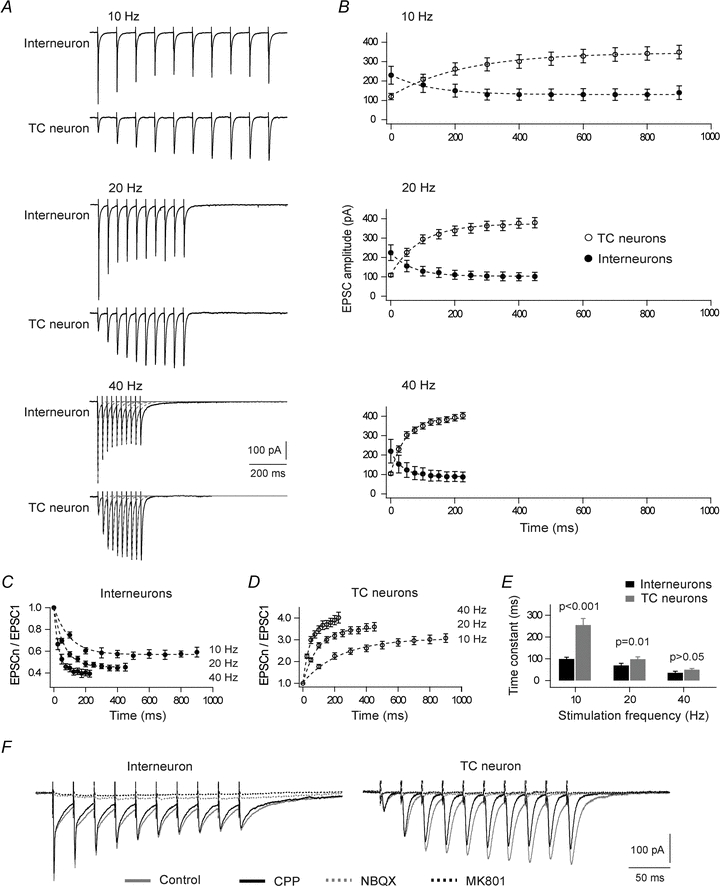
A, changes of EPSC amplitude during the trains for an interneuron (upper trace at each frequency) and a TC neuron (lower trace at each frequency). Each trace is an average of five trials with 30 s inter-trial intervals. B, averaged amplitudes of EPSCs of interneurons (filled spots, n = 11) and TC neurons (open spots, n = 13) evoked by trains of different frequencies. C and D, amplitudes of EPSCs to the successive pulses in the train, normalized to the amplitude of the first pulse, for corticogeniculate synapses of interneurons (C, n = 11), and TC neurons (D, n = 13); same data set as in B. Dotted curves, exponential functions fitted to the data. E, the time constants of exponentials describing the time course of accumulation of depression of interneurons (black bars) and facilitation of TC neurons (grey bars) at the different train frequencies. F, the postsynaptic response to the 40 Hz train was blocked by application of the ionotropic receptor antagonists CPP (15 μm), NBQX (10 μm) and MK801 (50 μm).
Figure 3B shows averaged amplitudes of EPSCs from responses of interneurons (n = 11) and TC neurons (n = 13) evoked by train stimulation of corticogeniculate afferents. At the start of a cortical pulse train, strong excitation of the inhibitory interneurons, but only relatively weak excitation of TC neurons was evoked. Moreover, the EPSC amplitudes in interneurons decreased rapidly in a frequency-dependent manner toward steady-state, in contrast to a longer-lasting and strong increase of EPSCs in TC neurons.
The steady-state level of synaptic strength obtained during the train was quantified as an average of the train pulse ratios of the three last pulses of the train. In interneurons, steady-state depression changed from 0.6 ± 0.04 at the end of a 10 Hz train to 0.4 ± 0.03 at the end of a 40 Hz train (Fig. 3C; P = 0.015, d.f. = 2, Kruskal–Wallis test). The level of facilitation of TC neurons increased with increasing stimulus frequency from 3.0 ± 0.2 at the end of a 10 Hz train to 3.9 ± 7.4 at the end of a 40 Hz train (Fig. 3D; P = 0.025, d.f. = 2, Kruskal–Wallis test).
The time course of accumulation of depression and facilitation of interneurons and TC neurons, respectively, are illustrated in Fig. 3C–E. Notice that the depression of interneurons increased at a faster rate during the train than the increase of facilitation of TC neurons, consistent with the differences of the fast time constants (τf) in the paired-pulse data. Also, in both types of neurons, the change occurred faster at higher stimulation frequency (Fig. 3E). In interneurons, the mean time constant of depression decreased from 98.5 ± 9.2 ms at 10 Hz to 35.1 ± 7.4 ms at 40 Hz (P = 0.005, d.f. = 2, Kruskal–Wallis test), while in TC neurons the time constant of facilitation decreased from 255.2 ± 29.9 ms at 10 Hz to 49.7 ± 5.7 ms at 40 Hz (P < 0.001, d.f. = 2, Kruskal–Wallis test).
To block the NMDA-Rs we used the competitive antagonist CPP (15 μm). Accordingly, some residual NMDA component might have influenced our results, especially during the highest frequency train stimulation. To check this possibility, we made control experiments with 40 Hz train stimulation where we first determined responses after wash-in of CPP (15 μm), and then after adding the non-competitive antagonist MK801 (50 μm). We saw no clear effect on the response after wash-in of MK801, and no effect on the kinetics and level of accumulated depression of interneurons (n = 5; P = 0.18, related samples Friedman's two-way ANOVA by ranks), or facilitation of TC neurons (n = 3; P = 0.18, related samples Friedman's two-way ANOVA by ranks).
In conditions with high-frequency stimulation (>100 Hz) of corticothalamic afferents, metabotropic glutamate receptors (mGluRs; group I: McCormick & von Krosigk 1992; von Krosigk et al. 1999; Turner & Salt, 2000; Reichova & Sherman, 2004; group III: Turner & Salt, 1999) can influence the response of TC neurons in dLGN. Much less is known about effects of mGluRs at cortical input to interneurons. Application of the group I/II agonist (±)-1-aminocyclopentane-trans-1,3-dicarboxylic acid (ACPD) has no effect on membrane potential or input resistance of interneurons (Pape & McCormick, 1995; Cox et al. 1998). The presence of group I mGluRs on dendrites of interneurons has been demonstrated (Godwin et al. 1996a). However, they are presumably activated by stimulation of retinogeniculate, but not corticogeniculate fibres (Govindaiah & Cox, 2004).
To check whether postsynaptic mGluR mediated currents influenced our results on STP, we made control experiments with 40 Hz train stimulation and looked for residual currents after blockade of the ionotropic GluRs. As illustrated in Fig. 3F, all currents were blocked by ionotropic receptor antagonists (15 μm CPP, 10 μm NBQX, 50 μm MK801) in both TC neurons (n = 2) and interneurons (n = 4 out of 5) except for one interneuron in which there was a small persistent current that could be largely eliminated by 0.2 mm Ni2+. To check whether presynaptic mGluRs influenced the STP properties, we compared the STP effect (train-pulse ratio) of non-NMDA-Rs mediated response to 40 Hz train stimulation before and after wash-in of the group I/II mGluR antagonist E4CPG (200 μm) or group III mGluR antagonist MSOP (200 μm). Application of the drug had no clear effect on the amplitude of EPSCs. We also found no effects of the mGluR antagonists either on facilitation of TC neurons (E4CPG, n = 3, P = 0.18; MSOP, n = 3, P = 0.06, related samples Friedman's two-way ANOVA by ranks in both cases) or on depression of interneurons (E4CPG, n = 4, P = 0.72; MSOP, n = 3, P = 0.56, related samples Friedman's two-way ANOVA by ranks in both cases). These results show that neither pre- nor postsynaptic mGluRs had any significant effect on STP properties of corticothalamic synapses of neurons in dLGN in the conditions we used. This is consistent with Granseth (2004) who did not find effects of group I/II and III mGluRs antagonists on cortical facilitation of TC neurons in conditions similar to ours.
Effects of preceding activity in cortical afferents on STP effects
In the results presented in the previous section, the stimulus trains were delivered without immediately preceding synaptic input. However, in vivo there is a maintained cortical input to dLGN which seems to vary depending on state (Hubel, 1959; Riva Sanseverino et al. 1973; Livingstone & Hubel, 1981; Legendy & Salcman, 1985). Such activity may generate a background level of synaptic depression of interneurons and facilitation of TC neurons against which effects induced by rapid changes of firing in corticothalamic afferents will occur. To gain some insights into effects of preceding activity on the response to a pulse train, we used two-part train stimuli consisting of a pre-train at 2 or 5 Hz, and a main train at 10 or 20 Hz. The effects of the pre-train were evaluated by plotting the pulse train ratio (EPSCn/EPSC1) against order of pulses within the combined train stimulus.
Figure 4A show EPSCs evoked in an interneuron (upper trace at each stimulation condition) and a TC neuron (lower trace at each stimulation condition), by the main pulse train of 20 Hz in control condition without pre-train, and together with a pre-train of 2 or 5 Hz. Figure 4B and C shows the averaged pulse train ratios for the different pulse trains for interneurons (n = 8) and TC neurons (n = 9), respectively. As expected, the pre-train induced frequency-dependent changes in the response to the main pulse train: increased depression of interneurons and increased facilitation of TC neurons. The induced changes were most pronounced at the start of the main train. In interneurons there was no clear effect of the pre-train on the response to the later part of the main train. In TC neurons, however, the pre-train not only induced a frequency-dependent initial facilitation, but also a sustained increase of facilitation during the main train.
Figure 4. Influence of preceding activity on responses to pulse train stimulation.
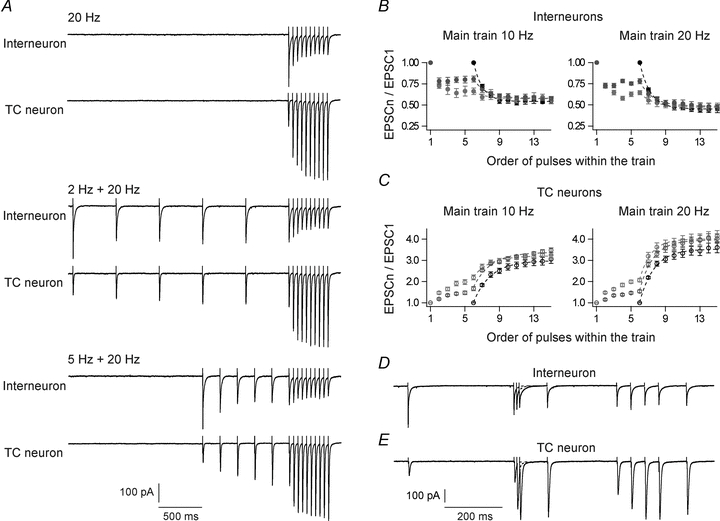
A, results from experiments with two-part stimuli showing effects of a pre-train on the response to a 20 Hz main train stimulus. Top, control without pre-train. Middle, pre-train consisting of five pulses at 2 Hz. Bottom, pre-train at 5 Hz. Interneuron, upper trace at each stimulation condition; TC neuron, lower trace at each stimulation condition. Each trace is an average of five trials with 60 s inter-trial intervals. B and C, amplitudes of EPSCs in interneurons (B, n = 8) and TC neurons (C, n = 9) evoked by successive pulses in the two-part train, normalized to the amplitude of the first EPSC. In the left panels in B and C a main train of 10 Hz was used, in the right panels, a main train of 20 Hz was used. Black circles, responses in the control condition without pre-train; dark grey circles, responses with 2 Hz pre-train; light grey circles, responses with 5 Hz pre-train. The curves are single exponential functions fitted to the responses to the main train. D and E, responses evoked by pulse train stimuli with irregular inter-pulse intervals. D, response of an interneuron. E, response of a TC neuron. The inter-pulse intervals varied between 10 and 380 ms. Each trace is an average of five trials with 60 s inter-trial intervals.
Figure 4D and E illustrates changes of balance between depression of interneurons and facilitation of TC neurons during patterns of firing in corticothalamic neurons evoked by irregular-pulse trains. The inter-pulse intervals in the train varied between 10 ms and 380 ms. In interneurons only the first pulse evoked a large EPSC, and sustained depression was maintained throughout the train irrespective of the length of the various inter-pulse intervals. Interestingly, the ‘burst’ generated by the triplet-pulse was very powerful for generation of long-lasting depression of the interneuron. The TC neurons responded with a small-amplitude EPSC to the initial pulse and with increased EPSC amplitudes during the pulse train, as expected. This increase was particularly pronounced during the high-frequency pulse-triplet, which also seemed to induce relative long-lasting facilitation.
Postsynaptic response patterns
In addition to the functional characteristics of the involved synapses, cortical-to-dLGN interneuron-mediated inhibition of TC neurons depends on neuronal integration mechanisms of the interneurons. These mechanisms may be complex, like the mechanisms of integration of retinal input, which can evoke different patterns of firing (Zhu et al. 1999a,b; Acuna-Goycolea et al. 2008) and provide different types of inhibition of TC neurons: fast and short-lasting or slow and long-lasting inhibition (e.g. Crunelli et al. 1988; Zhu & Heggelund 2001), and short-range or long-range inhibition (Zhu & Heggelund 2001; Perreault et al. 2003). Moreover, retinal input can evoke fast EPSPs, sodium spikes, or long-lasting calcium spikes (Zhu et al. 1999b, mainly T-type; Acuna-Goycolea et al. 2008, mainly L-type), partly depending on the number of activated retinal afferents (Acuna-Goycolea et al. 2008). The response patterns evoked by cortical input to interneurons are unknown, and insights into such properties are important for the understanding of the effects of cortical input on the inhibitory output of interneurons. Therefore we made a few current-clamp recordings to obtain some insights into the level of complexity of postsynaptic response patterns evoked by stimulation of cortical afferents. Inhibitory synapses were blocked with GABAA and GABAB receptor antagonists like in our voltage-clamp experiments.
For six neurons (4 interneurons, 2 TC neurons) we studied responses to pulse train stimulation of cortical afferents (10 pulses at 20 Hz or 40 Hz) at three stimulus intensities. The lowest intensity for each neuron was selected such that a single pulse elicited a small but clear response (grey traces in Fig. 5Aa, Ba and Ca); the other intensities were multiples of this strength. As expected, the TC neurons showed simple EPSP summation reflecting synaptic facilitation (Fig. 5Aa–c), and increased response amplitudes at higher stimulus frequency and intensity (e.g. Turner & Salt, 1998). However, in interneurons the response pattern could be qualitatively different depending on strength and frequency of stimulation (Fig. 5B–D). At the low stimulus intensity at both 20 and 40 Hz, all neurons showed simple summation with reduced EPSP amplitudes during the train reflecting depression, consistent with the changes of EPSCs (compare Fig. 5Ba, Ca and Da with Fig. 3A). The initial few EPSPs in a train could summate into an apparent facilitation due to their large amplitudes and stronger residual depolarization (e.g. 20 Hz traces in Fig. 5Bb and Cb), but the single EPSP amplitudes did not grow throughout the train as in the TC neurons. In one of the interneurons this simple summation pattern also occurred at the highest stimulus intensity at 40 Hz (Fig. 5Dc), but in the other interneurons qualitatively different response patterns occurred at increased stimulus intensity and frequency. Two of the other neurons showed strong and complex responses with a rather sustained depolarization and a few pronounced and broad calcium-like EPSPs that could be crowned with a putative sodium spike (Fig. 5B). The integrated depolarization during the stimulus train increased with increasing stimulus strength (20 Hz: from 1.2 ± 0.2 mV s at minimal stimulation to 5.1 ± 0.8 mV s at 3× minimal stimulation, P = 0.05, related samples Friedman's two-way ANOVA by ranks; 40 Hz: from 1.7 ± 0.2 mV s at minimal stimulation to 5.5 ± 0.6 mV s at 3× minimal stimulation, P = 0.02, related samples Friedman's two-way ANOVA by ranks), but this was not accompanied by an increased number of action potentials (compare Fig. 5Bb and Bc at 40 Hz). Moreover, in one of the interneurons, the two highest response intensities at 40 Hz elicited a strong and long-lasting depolarization that did not elicit any action potentials (Fig. 5C). Thus, in general, only few action potentials were elicited by stimulation of cortical afferents even in our conditions with blockade of inhibitory inputs. Our results demonstrate that cortical input, like retinal input to interneurons, can activate several different types of neuronal integration mechanisms. Furthermore, since stronger stimulus intensity in general activates a larger number of afferents, these findings suggest that the shift from the simple to the complex response pattern may be related to number of simultaneously activated afferents, like in retinal input to interneurons (Acuna-Goycolea et al. 2008; Antal et al. 2010).
Figure 5. Depolarization evoked by train-stimulation of corticogeniculate fibres.
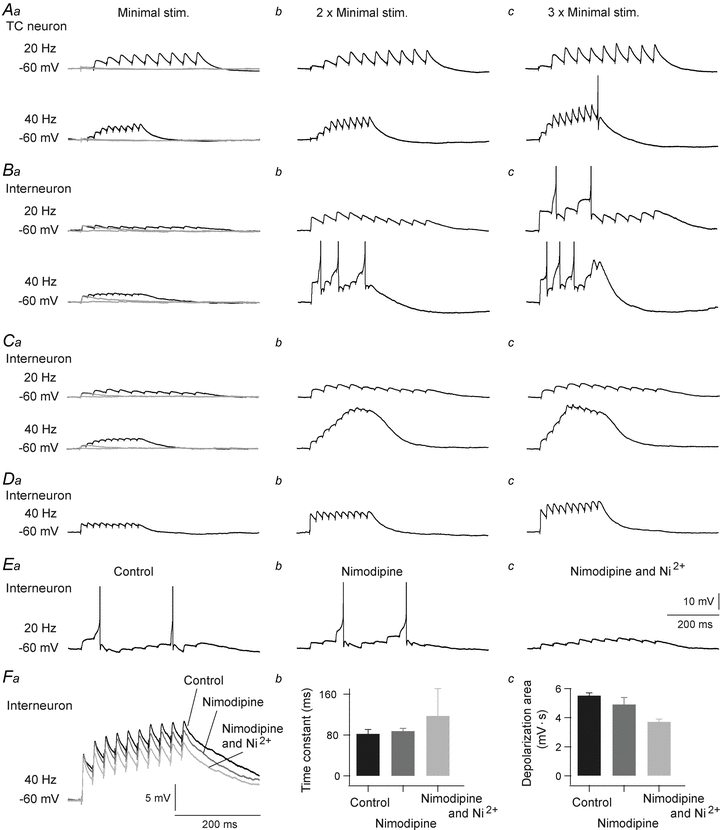
A, summation of depolarization in a TC neuron during 20 Hz (upper traces) and 40 Hz (lower traces) stimulation. Aa, response evoked by the minimal stimulation current; Ab, response evoked by stimulation current twofold larger than the minimal; Ac, response evoked by stimulation current threefold larger than the minimal. The minimal stimulation was selected such that the single pulse elicited clear EPSP (traces in grey). B, C and D, summation of depolarization in 3 different interneurons in the same stimulation conditions as in A (only responses to 40 Hz trains are shown in D). E, results from an interneuron where stimulation strength was adjusted to a level where the complex response pattern was elicited (Ea, control), and effects of nimodipine (Eb; 50 μm), and nimodipine plus Ni2+ (Ec; 0.4 mm), were tested. F, summation of depolarization in interneurons when voltage-gated Na+ channels were blocked with QX222 (5 mm); black, control condition; dark grey with nimodipine (50 μm); light grey with nimodipine and Ni2+ (0.4 mm). Fa, traces from a representative interneuron. Fb, the time constants of exponentials for the build-up of depolarization during 40 Hz trains. Fc, depolarization integrated over the response period to a 40 Hz train. Action potentials truncated at −20 mV.
To check whether the complex response pattern depended on L-type calcium currents (Acuna-Goycolea et al. 2008), we tested effects of nimodipine (50 μm) on the responses to stimulation that elicited the complex response pattern in five interneurons. Nimodipine (after 10 min wash-in) had only minor effects such as slower build-up of depolarization through the train (Fig. 5Eb), and a slight reduction in number of action potentials; number of action potentials during the 10-pulse stimulation changed on average from 2.3 ± 0.5 spikes in control condition to 1.5 ± 0.3 spikes. Adding Ni2+ (0.2–0.4 mm) further attenuated the depolarization (Fig. 5Ec) and reduced the average number of action potentials during the pulse train to 1 ± 0.6 spikes. Quantitative assessments of effects of the calcium blockers on level of depolarization were complicated by characteristics of the response patterns. For example, an action potential in the control condition could be followed by pronounced after-hyperpolarization (AHP), and possible spike elimination by calcium blockers also eliminated the AHP and thereby indicated only a minor effect on the integrated depolarization during the stimulus train. To reduce such problems, we blocked action potentials with QX222 (5 mm in the recording electrode) in four additional interneurons (cf. example in Fig. 5F). In these neurons nimodipine (50 μm) reduced build-up of depolarization during the train (time constant increased by ∼7%; from 82 ± 8.6 ms to 87.7 ± 5.3 ms) and reduced the integrated depolarization by ∼12% (from 5.5 ± 0.2 mV s to 4.9 ± 0.5 mV s). Adding Ni2+ (0.2–0.4 mm) further slowed down the build-up of depolarization (additional time constant increase by ∼34%; from 87.7 ± 5.3 ms to 117.2 ± 53.5 ms) and further reduced the integrated depolarization by ∼23% (from 4.9 ± 0.5 mV s to 3.7 ± 0.2 mV s), demonstrating an important role of T-type in addition to L-type calcium current in the integration of cortical input and in the generation of the complex response pattern.
Discussion
Several studies have demonstrated that corticothalamic feedback to TC neurons can facilitate output from TC neurons in a frequency-dependent manner (Lindström & Wróbel, 1990; Turner & Salt, 1998; von Krosigk et al. 1999; Granseth et al. 2002; Granseth, 2004; Alexander et al. 2006; Kielland et al. 2006) and this mechanism may function as a gain-regulation mechanism for thalamocortical transmission (Ahlsén et al. 1985). Our results clearly indicate that also cortical feedback to geniculate interneurons plays an important role in dynamic regulation of thalamocortical transmission. We show that corticogeniculate synapses on interneurons and TC neurons have distinctly different properties. Single stimulus-pulses to cortical afferents or the first pulse in a stimulation sequence evoked considerably larger EPSCs in interneurons than in TC neurons. However, repetitive stimulation gave frequency-dependent synaptic depression in interneurons, in contrast to the facilitation in TC neurons, such that the amplitude of the cortically evoked EPSCs in interneurons decreased, while the amplitude of the EPSCs in TC neurons increased during train stimuli. Thus, depending on stimulus frequency and duration, the balance of cortical excitation of the two types of neurons could change from strongest excitation of interneurons to strongest excitation of TC neurons.
The temporal characteristics of the STP effects of the cortical input to interneurons and TC neurons were significantly different as demonstrated by the time constants of the double exponentials fitted to the paired-pulse ratio vs. inter-pulse interval plots. These results showed that the fast time constant for interneurons was only about one-quarter of the one for TC neurons, while the slow time constant was more than 10 times longer for interneurons than for TC neurons. Thereby the dynamic range of the cortical modulation of input to interneurons was limited to short inter-pulse intervals (<∼50 ms in the conditions we used), whereas at longer intervals the excitation of interneurons was relatively independent of the length of inter-pulse interval. In contrast, the facilitation of TC neurons had a broader dynamic range. Moreover, the data from pulse train experiments demonstrated a frequency-dependent accumulation of depression in interneurons that was faster than the accumulation of facilitation in TC neurons. Accordingly, at the beginning of the train, the excitation of interneurons was strong compared to the excitation of TC neurons, but the EPSCs of interneurons rapidly decreased to an almost steady-state level while EPSCs of TC neurons continued to increase over a longer period. This suggests that at short paired-pulse intervals, and at the start of a pulse train, the cortical input to interneurons may contribute to the frequency-dependent corticogeniculate regulation of geniculate output by dynamic regulation of degree of inhibition of TC neurons. Interestingly, also synapses of interneurons on TC neurons are characterized by fast depression (S. Augustinaite & P. Heggelund, unpublished observations) such that the interneuron-mediated disynaptic cortical inhibition of TC neurons may show even stronger depression than what we found at corticogeniculate synapses on interneurons. However, at longer paired-pulse intervals, and during the later part of the pulse train, the cortical input to interneurons seems to mainly contribute to a relatively stable level of inhibition, a level that must be counteracted by the cortical excitation of TC neurons to shift the summated effect from suppression to enhancement of thalamocortical transmission.
Our experiments with pre-pulse stimulation suggest that maintained activity in cortical afferents may have an important role in regulating the balance between the excitation of interneurons and TC neurons. A pulse train in cortical afferents occurring in conditions with low levels of maintained activity may give relatively strong excitation of interneurons but weak excitation of TC neurons in the beginning of the train. On the contrary, in conditions with higher levels of maintained activity, the pulse train may give initially weaker excitation of interneurons but stronger excitation of TC neurons. The experiments with irregular pulse trains suggest that a short, high-frequency stimulation or ‘bursts’ in cortical afferents is powerful for generating relatively longer-lasting shifts toward increased thalamocortical transmission due to relatively long-lasting depression of interneurons and facilitation of TC neurons.
The opposite effects of cortical input to interneurons and TC neurons evoked by a series of corticogeniculate action potentials could mean reduced rate of changes in the membrane potential of TC neurons at the start of the pulse series. Such dampening may have an important function of preventing direct generation of action potentials in TC neurons by the cortical input, action potentials that in tonic mode could distort faithful transmission of visual signals from retina to visual cortex. The relatively slowly increasing excitation in TC neurons through the cortical facilitation combined with the disynaptic inhibition through interneurons can counteract spike generation. Cortical synapses on TRN neurons are facilitating, like the synapses on TC neurons, but the dynamic range of the synaptic facilitation at the cortical input to TRN neurons is narrower (Alexander et al. 2006), and synaptic density (Weber et al. 1989) and unitary corticothalamic EPSCs are larger in TRN than in TC neurons (Golshani et al. 2001; Gentet & Ulrich, 2004). Accordingly, also the inhibition through TRN may counteract rapid initial depolarization and spike generation in TC neurons. Moreover, sustained inhibition of TC neurons from both interneurons and TRN neurons may efficiently attenuate the level of cortical depolarization of TC neurons and prevent direct spike generation by the cortical feedback.
The retinal feed-forward inhibition of TC neurons through interneurons is presumably primarily related to generation of increased centre–surround antagonism that improves spatial resolution of visual information in TC neurons (e.g. Hubel & Wiesel, 1961; Singer, 1977; Einevoll & Heggelund, 2000; Ruksenas et al. 2000). It is therefore possible that the cortical excitation of interneurons also contributes to dynamic regulation of centre–surround antagonism and spatial resolution of TC neurons (Eyding et al. 2003; Andolina et al. 2007). Furthermore, retinal input or somatic depolarization of interneurons can elicit different types of inhibition of TC neurons (Zhu et al. 1999a,b; Zhu & Heggelund, 2001; Perreault et al. 2003; Acuna-Goycolea et al. 2008). Possibly also cortical feedback can change the type of inhibition generated by interneurons.
Interneurons can inhibit TC neurons through dendrodendritic synapses with presynaptic specializations distributed along dendritic shafts (Ralston, 1971; Famiglietti & Peters, 1972; Hamos et al. 1985; Montero, 1986; Acuna-Goycolea et al. 2008). In addition, inhibition may also be mediated through axons of the interneurons. It is not clear to what extent the inhibition of TC neurons is mediated by dendritic output or by axonal output. Although it is clear that the dendrites have synaptic contacts with dendrites of TC neurons it is unclear to what extent the axon of interneurons contacts TC neurons, or rather the same or other interneurons (Ralston, 1971). There are indications that GABA release from the dendritic synaptic sites can be regulated by local changes in the membrane potential (Cox et al. 1998; Cox & Sherman, 2000) and not only by action potentials in the interneuron, and this kind of graded regulation of dendritic GABA release could be an efficient mechanism for cortical modulation of the interneuron-mediated disynaptic inhibition of TC neurons.
Our current-clamp recordings demonstrated that cortical input to interneurons, like retinal input (Zhu et al. 1999a,b; Acuna-Goycolea et al. 2008), can evoke qualitatively different patterns of response that can involve sodium spikes and calcium spikes. Weak stimulation, which presumably activates few cortical afferents, elicited simple, graded EPSPs, a type of response pattern that appears well suited for dynamic fine-grain regulation of thalamocortical transmission. In this condition it is reasonable to assume that synaptic depression at the cortical excitation of interneurons is typically reflected as attenuation of the interneuron-mediated inhibition of TC neurons. However, our current-clamp data demonstrated that stronger stimulus intensity, which may synchroneously activate a larger number of cortical afferents, or higher stimulus frequency, which give stronger activation through the temporal summation of the EPSPs, elicited strong and complex postsynatic response patterns in the interneurons involving calcium potentials, similar to finding for retinal inputs to interneurons (Zhu et al. 1999a; Acuna-Goycolea et al. 2008). The complex response patterns evoked by retinal input depend on both T-type calcium currents (Zhu et al. 1999b) and L-type calcium currents (Acuna-Goycolea et al. 2008). Munsch et al. (1997) demonstrated both types of currents in interneurons, L-type in soma and proximal dendrites and T-type in distal dendrites. Our results on complex response pattern evoked by cortical input also demonstrated involvement of both both types of calcium currents, although the T-type seemed to be more prominent in the conditions we used. The complex response pattern was probably particularly easy to elicit in our conditions with blockade of GABAergic inhibition of interneurons (from TRN and other interneurons; Zhu & Lo, 1999). Such response pattern appears well suited for generation of long-range and long-lasting inhibition across LGN (Zhu & Heggelund, 2001; Perreault et al. 2003) that might play an important role in slow, synchronized rhythmic activity of TC neurons promoted by synchronized firing of large groups of cortical afferents in for instance states of slow-wave sleep or seizures.
Acknowledgments
This work was supported by the eVITA program of the Norwegian Research Council, and by Grant-in-Aids for Scientific Research from the MEXT, Japan and Takeda Science Foundation.
Glossary
Abbreviations
- AHP
after-hyperpolarization
- dLGN
dorsal lateral geniculate nucleus
- GAD67
glutamate decarboxylase 67
- GFP
green fluorescent protein
- mGluR
metabotropic glutamate receptors
- PPR
paired-pulse ratio
- Rin
input resistance
- RMP
resting membrane potential
- STP
short-term plasticity
- TC
thalamocortical
- TRN
thalamic reticular nucleus
Author contributions
S.A. and P.H. designed the experiments and wrote the manuscript. S.A. carried out the experiments and analysed the data. Y.Y. provided the transgenic animals and critically revised the manuscript. The experiments were done at Institute of Basic Medical Sciences, University of Oslo. All authors have approved the final version of the manuscript.
References
- Abbott LF, Regehr WG. Synaptic computation. Nature. 2004;431:796–803. doi: 10.1038/nature03010. [DOI] [PubMed] [Google Scholar]
- Acuna-Goycolea C, Brenowitz SD, Regehr WG. Active dendritic conductances dynamically regulate GABE release from thalamic interneurons. Neuron. 2008;57:420–431. doi: 10.1016/j.neuron.2007.12.022. [DOI] [PubMed] [Google Scholar]
- Ahlsén G, Lindström S, Lo FS. Interaction between inhibitory pathways to principal cells in the lateral geniculate nucleus of the cat. Exp Brain Res. 1985;58:134–143. doi: 10.1007/BF00238961. [DOI] [PubMed] [Google Scholar]
- Alexander GM, Fisher TL, Godwin DW. Differential response dynamics of corticothalamic glutamatergic synapses in the lateral geniculate nucleus and thalamic reticular nucleus. Neuroscience. 2006;137:367–372. doi: 10.1016/j.neuroscience.2005.11.012. [DOI] [PubMed] [Google Scholar]
- Andolina IM, Jones HE, Wang W, Sillito AM. Corticothalamic feedback enhances stimulus response precision in the visual system. Proc Natl Acad Sci U S A. 2007;104:1685–1690. doi: 10.1073/pnas.0609318104. [DOI] [PMC free article] [PubMed] [Google Scholar]
- Antal M, Acuna-Goycolea C, Pressler RT, Blitz DM, Regehr WG. Cholinergic activation of M2 receptors leads to context-dependent modulation of feedforward inhibition in the visual thalamus. PLoS Biology. 2010;8:1–16. doi: 10.1371/journal.pbio.1000348. [DOI] [PMC free article] [PubMed] [Google Scholar]
- Cox CL, Sherman SM. Control of dendritic outputs of inhibitory interneurons in the lateral geniculate nucleus. Neuron. 2000;27:597–610. doi: 10.1016/s0896-6273(00)00069-6. [DOI] [PubMed] [Google Scholar]
- Cox CL, Zhou Q, Sherman M. Glutamate locally activates dendritic outputs of thalamic interneurons. Nature. 1998;394:478–482. doi: 10.1038/28855. [DOI] [PubMed] [Google Scholar]
- Crunelli V, Haby M, Jassik-Gerschenfeld D, Leresche N, Pirchio M. Cl− -and K+-dependent inhibitory postsynaptic potentials evoked by interneurones of the rat lateral geniculate nucleus. J Physiol. 1988;399:153–176. doi: 10.1113/jphysiol.1988.sp017073. [DOI] [PMC free article] [PubMed] [Google Scholar]
- Einevoll GT, Heggelund P. Mathematical models for the spatial receptive-field organization of nonlagged X-cells in dorsal lateral geniculate nucleus of cat. Vis Neurosci. 2000;17:871–885. doi: 10.1017/s0952523800176060. [DOI] [PubMed] [Google Scholar]
- Eyding D, Macklis JD, Neubacher U, Funke K, Wörgötter F. Selective elimination of corticogeniculate feedback abolishes the electroencephalogram dependence of primary visual cortical receptive fields and reduces their spatial specificity. J Neurosci. 2003;23:7021–7033. doi: 10.1523/JNEUROSCI.23-18-07021.2003. [DOI] [PMC free article] [PubMed] [Google Scholar]
- Famiglietti EV, Peters A. The synaptic glomerulus and the intrinsic neuron in the dorsal lateral geniculate nucleus of the cat. J Comp Neurol. 1972;144:285–334. doi: 10.1002/cne.901440304. [DOI] [PubMed] [Google Scholar]
- Gentet LJ, Ulrich D. Electrophysiological characterization of synaptic connections between layer VI cortical cells and neurons of the nucleus reticularis thalami in juvenile rats. Eur J Neurosci. 2004;19:625–633. doi: 10.1111/j.1460-9568.2004.03168.x. [DOI] [PubMed] [Google Scholar]
- Godwin DW, Van Horn SC, Erisir A, Sesma M, Romano C, Sherman SM. Ultrastructural localization suggests that retinal and cortical inputs access different metabotropic glutamate receptors in the lateral geniculate nucleus. J Neurosci. 1996a;16:8181–8192. doi: 10.1523/JNEUROSCI.16-24-08181.1996. [DOI] [PMC free article] [PubMed] [Google Scholar]
- Godwin DW, Vaughan JW, Sherman SM. Metabotropic glutamate receptors switch visual response mode of lateral geniculate nucleus cells from burst to tonic. J Neurophysiol. 1996b;76:1800–1816. doi: 10.1152/jn.1996.76.3.1800. [DOI] [PubMed] [Google Scholar]
- Golshani P, Liu XB, Jones EG. Differences in quantal amplitude reflect GluR4-subunit number at corticothalamic synapses on two populations of thalamic neurons. Proc Natl Acad Sci U S A. 2001;98:4172–4177. doi: 10.1073/pnas.061013698. [DOI] [PMC free article] [PubMed] [Google Scholar]
- Govindaiah, Cox CL. Synaptic activation of metabotropic glutamate receptors regulates dendritic outputs of thalamic interneurons. Neuron. 2004;41:611–623. doi: 10.1016/s0896-6273(04)00013-3. [DOI] [PubMed] [Google Scholar]
- Granseth B. Dynamic properties of corticogeniculate excitatory transmission in the rat dorsal lateral geniculate nucleus in vitro. J Physiol. 2004;556:135–146. doi: 10.1113/jphysiol.2003.052720. [DOI] [PMC free article] [PubMed] [Google Scholar]
- Granseth B, Ahlstrand E, Lindström S. Paired pulse facilitation of corticogeniculate EPSCs in the dorsal lateral geniculate nucleus of the rat investigated in vitro. J Physiol. 2002;544:477–486. doi: 10.1113/jphysiol.2002.024703. [DOI] [PMC free article] [PubMed] [Google Scholar]
- Grieve KL, Sillito AM. Differential properties of cells in the feline primary visual-cortex providing the corticofugal feedback to the lateral geniculate-nucleus and visual claustrum. J Neurosci. 1995;15:4868–4874. doi: 10.1523/JNEUROSCI.15-07-04868.1995. [DOI] [PMC free article] [PubMed] [Google Scholar]
- Hamos JE, Van Horn SC, Raczkowski D, Uhlrich DJ, Sherman SM. Synaptic connectivity of a local circuit neurone in lateral geniculate nucleus of the cat. Nature. 1985;317:618–621. doi: 10.1038/317618a0. [DOI] [PubMed] [Google Scholar]
- Hubel DH. Single unit activity in striate cortex of unrestrained cats. J Physiol. 1959;147:226–238. doi: 10.1113/jphysiol.1959.sp006238. [DOI] [PMC free article] [PubMed] [Google Scholar]
- Hubel DH, Wiesel TN. Integrative action in the cat's lateral geniculate body. J Physiol. 1961;155:385–398. doi: 10.1113/jphysiol.1961.sp006635. [DOI] [PMC free article] [PubMed] [Google Scholar]
- Kielland A, Erisir A, Walaas SI, Heggelund P. Synapsin utilization differs among functional classes of synapses on thalamocortical cells. J Neurosci. 2006;26:5786–5793. doi: 10.1523/JNEUROSCI.4631-05.2006. [DOI] [PMC free article] [PubMed] [Google Scholar]
- Legendy CR, Salcman M. Bursts and recurrences of bursts in the spike trains of spontaneously active striate cortex neurons. J Neurophysiol. 1985;53:926–939. doi: 10.1152/jn.1985.53.4.926. [DOI] [PubMed] [Google Scholar]
- Lindström S, Wróbel A. Frequency-dependent corticofugal excitation of principal cells in the cats dorsal lateral geniculate-nucleus. Exp Brain Res. 1990;79:313–318. doi: 10.1007/BF00608240. [DOI] [PubMed] [Google Scholar]
- Livingstone MS, Hubel DH. Effects of sleep and arousal on the processing of visual information in the cat. Nature. 1981;291:554–561. doi: 10.1038/291554a0. [DOI] [PubMed] [Google Scholar]
- McCormick DA, Bal T. Sleep and arousal: thalamocortical mechanisms. Annu Rev Neurosci. 1997;20:185–215. doi: 10.1146/annurev.neuro.20.1.185. [DOI] [PubMed] [Google Scholar]
- McCormick DA, von Krosigk M. Corticothalamic activation modulates thalamic firing through glutamate ‘metabotropic’ receptors. Proc Natl Acad Sci U S A. 1992;89:2774–2778. doi: 10.1073/pnas.89.7.2774. [DOI] [PMC free article] [PubMed] [Google Scholar]
- Montero VM. Localization of gamma-aminobutyric acid (GABA) in type 3 cells and demonstration of their source to F2 terminals in the cat lateral geniculate nucleus: a Golgi-electron-microscopic GABA-immunocytochemical study. J Comp Neurol. 1986;254:228–245. doi: 10.1002/cne.902540207. [DOI] [PubMed] [Google Scholar]
- Munsch T, Budde T, Pape H-C. Voltage-activated intracellular calcium transients in thalamic relay cells and interneurons. Neuroreport. 1997;8:2411–2418. doi: 10.1097/00001756-199707280-00001. [DOI] [PubMed] [Google Scholar]
- Pape HC, McCormick DA. Electrophysiological and pharmacological properties of interneurons in the cat dorsal lateral geniculate nucleus. Neuroscience. 1995;68:1105–1125. doi: 10.1016/0306-4522(95)00205-w. [DOI] [PubMed] [Google Scholar]
- Perreault MC, Qin Y, Heggelund P, Zhu JJ. Postnatal development of GABAergic signalling in the rat lateral geniculate nucleus: presynaptic dendritic mechanisms. J Physiol. 2003;546:137–148. doi: 10.1113/jphysiol.2002.030643. [DOI] [PMC free article] [PubMed] [Google Scholar]
- Ralston HJ. Evidence for presynaptic dendrites and a proposal for their mechanism of action. Nature. 1971;230:585–587. doi: 10.1038/230585a0. [DOI] [PubMed] [Google Scholar]
- Reichova I, Sherman M. Somatosensory corticothalamic projections: distinguishing drivers from modulators. J Neurophysiol. 2004;92:2185–2197. doi: 10.1152/jn.00322.2004. [DOI] [PubMed] [Google Scholar]
- Riva Sanseverino E, Agnati LF, Maioli MG, Galletti C. Maintained activity of single neurons in striate and non-striate areas of cat visual-cortex. Brain Res. 1973;54:225–242. doi: 10.1016/0006-8993(73)90046-2. [DOI] [PubMed] [Google Scholar]
- Ruksenas O, Fjeld IT, Heggelund P. Spatial summation and center-surround antagonism in the receptive field of single units in the dorsal lateral geniculate nucleus of cat: comparison with retinal input. Vis Neurosci. 2000;17:855–870. doi: 10.1017/s0952523800176059. [DOI] [PubMed] [Google Scholar]
- Sherman SM. Thalamic relay functions. Prog Brain Res. 2001;134:51–69. doi: 10.1016/s0079-6123(01)34005-0. [DOI] [PubMed] [Google Scholar]
- Sherman SM, Guillery RW. Functional organization of thalamocortical relays. J Neurophysiol. 1996;76:1367–1395. doi: 10.1152/jn.1996.76.3.1367. [DOI] [PubMed] [Google Scholar]
- Sillito AM, Cudeiro J, Jones HE. Always returning: feedback and sensory processing in visual cortex and thalamus. Trends Neurosci. 2006;29:307–316. doi: 10.1016/j.tins.2006.05.001. [DOI] [PubMed] [Google Scholar]
- Singer W. Control of thalamic transmission by corticofugal and ascending reticular pathways in the visual system. Physiol Rev. 1977;57:386–420. doi: 10.1152/physrev.1977.57.3.386. [DOI] [PubMed] [Google Scholar]
- Steriade M, Jones EG, McCormick DA. Thalamus. Amsterdam: Elsevier; 1997. [Google Scholar]
- Steriade M, McCormick DA, Sejnowski TJ. Thalamocortical oscillations in the sleeping and aroused brain. Science. 1993;262:679–685. doi: 10.1126/science.8235588. [DOI] [PubMed] [Google Scholar]
- Stevens CF, Wang YY. Facilitation and depression at single central synapses. Neuron. 1995;14:795–802. doi: 10.1016/0896-6273(95)90223-6. [DOI] [PubMed] [Google Scholar]
- Tamamaki N, Yanagawa Y, Tomioka R, Miyazaki JI, Obata K, Kaneko T. Green fluorescent protein expression and colocalization with calretinin, parvalbumin, and somatostatin in the GAD67-GFP knock-in mouse. J Comp Neurol. 2003;467:60–79. doi: 10.1002/cne.10905. [DOI] [PubMed] [Google Scholar]
- Thomson AM, Bannister AP. Release-independent depression at pyramidal inputs onto specific cell targets: dual recordings in slices of rat cortex. J Physiol. 1999;519:57–70. doi: 10.1111/j.1469-7793.1999.0057o.x. [DOI] [PMC free article] [PubMed] [Google Scholar]
- Turner JP, Salt TE. Characterization of sensory and corticothalamic excitatory inputs to rat thalamocortical neurones in vitro. J Physiol. 1998;510:829–843. doi: 10.1111/j.1469-7793.1998.829bj.x. [DOI] [PMC free article] [PubMed] [Google Scholar]
- Turner JP, Salt TE. Group III metabotropic glutamate receptors control corticothalamic synaptic transmission in the rat thalamus in vitro. J Physiol. 1999;519:481–491. doi: 10.1111/j.1469-7793.1999.0481m.x. [DOI] [PMC free article] [PubMed] [Google Scholar]
- Turner JP, Salt TE. Synaptic activation of the group I metabotropic glutamate receptor mGluR1 on the thalamocortical neurons of the rat dorsal lateral geniculate nucleus in vitro. Neuroscience. 2000;100:493–505. doi: 10.1016/s0306-4522(00)00280-3. [DOI] [PubMed] [Google Scholar]
- von Krosigk M, Monckton JE, Reiner PB, McCormick DA. Dynamic properties of corticothalamic excitatory postsynaptic potentials and thalamic reticular inhibitory postsynaptic potentials in thalamocortical neurons of the guinea-pig dorsal lateral geniculate nucleus. Neuroscience. 1999;91:7–20. doi: 10.1016/s0306-4522(98)00557-0. [DOI] [PubMed] [Google Scholar]
- Wang W, Jones HE, Andolina IM, Salt TE, Sillito AM. Functional alignment of feedback effects from visual cortex to thalamus. Nat Neurosci. 2006;9:1330–1336. doi: 10.1038/nn1768. [DOI] [PubMed] [Google Scholar]
- Weber AJ, Kalil RE, Behan M. Synaptic connections between corticogeniculate axons and interneurons in the dorsal lateral geniculate nucleus of the cat. J Comp Neurol. 1989;289:156–164. doi: 10.1002/cne.902890113. [DOI] [PubMed] [Google Scholar]
- Zhu JJ, Heggelund P. Muscarinic regulation of dendritic and axonal outputs of rat thalamic interneurons: A new cellular mechanism for uncoupling distal dendrites. J Neurosci. 2001;21:1148–1159. doi: 10.1523/JNEUROSCI.21-04-01148.2001. [DOI] [PMC free article] [PubMed] [Google Scholar]
- Zhu JJ, Lo F-S. Three GABA receptor-mediated postsynaptic potentials in interneurons in the rat lateral geniculate nucleus. J Neurosci. 1999;19:5721–5730. doi: 10.1523/JNEUROSCI.19-14-05721.1999. [DOI] [PMC free article] [PubMed] [Google Scholar]
- Zhu JJ, Lytton WW, Xue JT, Uhlrich DJ. An intrinsic oscillation in interneurons of the rat lateral geniculate nucleus. J Neurophysiol. 1999a;81:702–711. doi: 10.1152/jn.1999.81.2.702. [DOI] [PubMed] [Google Scholar]
- Zhu JJ, Uhlrich DJ, Lytton WW. Burst firing in identified rat geniculate interneurons. Neuroscience. 1999b;91:1445–1460. doi: 10.1016/s0306-4522(98)00665-4. [DOI] [PubMed] [Google Scholar]
- Zucker RS, Regehr WG. Short-term synaptic plasticity. Annu Rev Physiol. 2002;64:355–405. doi: 10.1146/annurev.physiol.64.092501.114547. [DOI] [PubMed] [Google Scholar]