Abstract
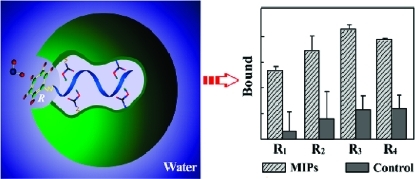
A new interfacial nano and molecular imprinting approach is developed to prepare spherical molecularly imprinted polymers with well-controlled hierarchical structures. This method is based on Pickering emulsion polymerization using template-modified colloidal particles. The interfacial imprinting is carried out in particle-stabilized oil-in-water emulsions, where the molecular template is presented on the surface of silica nanoparticles during the polymerization of the monomer phase. After polymerization, the template-modified silica nanoparticles are removed from the new spherical particles to leave tiny indentations decorated with molecularly imprinted sites. The imprinted microspheres prepared using the new interfacial nano and molecular imprinting have very interesting features: a well-controlled hierarchical structure composed of large pores decorated with easily accessible molecular binding sites, group selectivity toward a series of chemicals having a common structural moiety (epitopes), and a hydrophilic surface that enables the MIPs to be used under aqueous conditions.
Introduction
Molecular imprinting is a powerful synthetic method for creation of specific binding sites in cross-linked polymer materials.(1) The highly specific binding sites are formed by using molecular template to control the distribution of functional monomers during a cross-linking polymerization.(2) Because of their very high selectivity and robustness, molecularly imprinted polymers (MIPs) are being increasingly used as specific recognition materials for analytical separation, development of assays, construction of chemical sensors, and as enzyme mimics to catalyze chemical reactions.(3) Development of new synthetic methodologies has brought in unprecedented new structures of MIPs, especially those with well-controlled hierarchical structures that promise very fast molecular binding and releasing kinetics.(4) In many cases, the hierarchical structures are created by carrying out molecular imprinting in the presence of a structural template, which is sacrificed after the polymerization to introduce well-defined pores and flow channels in the final MIPs.(5)
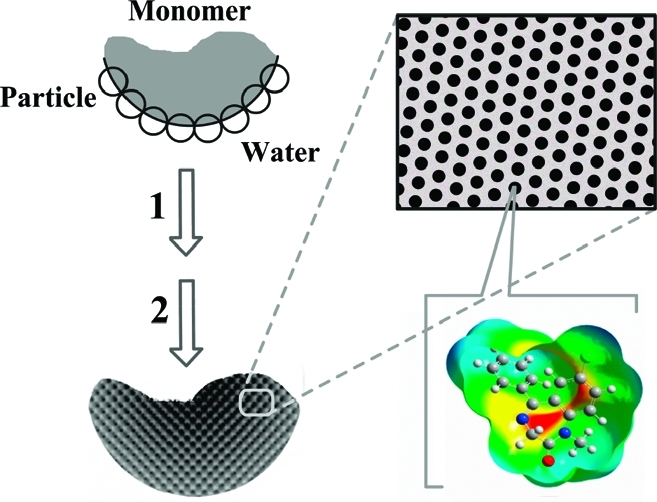
In this work, we introduce a new interfacial nano and molecular imprinting approach to prepare spherical MIPs with well-controlled hierarchical structures. This method is based on Pickering emulsion polymerization using template-modified colloidal particles. The interfacial imprinting is carried out in particle-stabilized oil-in-water emulsions, where the molecular template is presented on the surface of silica nanoparticles during the polymerization of the monomer phase (Scheme 1).
Scheme 1. Interfacial Molecular Imprinting Procedure in Nanoparticles-Stabilized Emulsions: Step 1, Polymerization; Step 2, Removal of Silica and Template.
In Pickering emulsion, dispersed liquid droplets are stabilized by solid particles instead of conventional surfactants. The stabilizing particles are located at the interface between the two immiscible liquids, thereby preventing coalescence of the droplets.(6) The basic principle of droplet stabilization is the partitioning of solid particles between the two immiscible liquids. Depending on the surface tension of the solid particles, Pickering emulsions may be prepared as either oil-in-water or water-in-oil systems.(7) Since first being described in 1907,(8) Pickering emulsions have found use in several applications, including oil recovery, cosmetic preparations, and wastewater treatment. Recently, the interest in Pickering emulsions has shifted toward fabrication of advanced materials with complex architectures, such as colloidosomes for use as permeable vehicles for controlled drug delivery.(9) Pickering emulsions are in many cases more stable than emulsions obtained using small molecule surfactants and are therefore easier to use for fabrication of complex micro- and nanostructures.
By employing Pickering emulsion polymerization, we hereby develop interfacial nano and molecular imprinted microspheres having (i) a well-controlled hierarchical structure composed of large pores decorated with easily accessible molecular binding sites, (ii) group selectivity toward a series of chemicals having a common structural moiety (epitopes), and (iii) a hydrophilic surface that enables the MIPs to be used under aqueous conditions.
Experimental Section
Materials
Methacrylic acid (MAA, 98.5%) and 3-glycidyloxypropyltrimethoxysilane (GPTMS, 97%) were purchased from Acros (Geel, Belgium). Azobis(isobutyronitrile) (AIBN, 98%) was purchased from Merck (Darmstadt, Germany). Silica nanoparticles (nanopowder, diameter 10 nm), isopropylamine, ethylene glycol dimethacrylate (EGDMA, 98%), tetraethyl orthosilicate (TEOS, 99%), atenolol (98%), metoprolol (+)-tartrate (97%), timolol maleate (98%), pindolol (98%), and 1-naphthol (99%) were purchased from Sigma-Aldrich (Gillingham, UK). 1-Amino-3-(naphthalen-1-yloxy)-propan-2-ol hydrochloride (ANPO) was purchased from Aurora Fine Chemicals (San Diego, CA). (R,S)-Propranolol hydrochloride (99%), acriflavin (AFN, ≥90%), and fluorescein isothiocyanate (FITC, ≥90%) were supplied by Fluka (Dorset, UK). [3H]-(S)-Propranolol (specific activity 555 GBq mmol–1, 66.7 μM in ethanol solution) was purchased from NEN Life Science Products, Inc. (Boston, MA). The scintillation liquid Ecoscint A was obtained from National Diagnostics (Atlanta, GA). AIBN was recrystallized from methanol before use, while other materials and inorganic salts were of analytical reagent grade and were used without further purification.
Synthesis of Silica Nanoparticles
Silica nanoparticles (diameter 330 nm) were synthesized using a one-step Stöber procedure.(10) Briefly, 100 mL of methanol, 33 mL of water, and 22.4 mL of ammonia (25%) were mixed in a 1000 mL glass beaker and agitated using a magnetic stirrer. A mixture of 130 mL of methanol containing 13.8 mL of TEOS was quickly added to this solution. The reaction mixture was stirred at room temperature for 10 h. The silica nanoparticles were isolated by centrifugation, washed with water, and dried in a vacuum chamber.
Silica nanoparticles with a diameter of 150 nm were prepared following a growth process(11) in which small silica particles (10 nm in diameter) were used as seeds. The seed particles (1.8 g) and 2 mL of ammonia (25%) were quickly added to 80 mL of methanol containing 16 mL of water at room temperature. The mixture was sonicated for 3 min in a laboratory ultrasound cleaner before 2 mL of TEOS was added while stirring. The reaction mixture was stirred for 8 h at room temperature. The silica nanoparticles were isolated by centrifugation, washed with water, and dried in a vacuum chamber. Silica nanoparticles with a diameter of 220 nm were prepared using the same seeded growth procedure, except that the amounts of ammonia and TEOS were changed to 4 and 5 mL.
The size of the synthesized silica nanoparticles was determined using the dynamic light scattering (DLS) technique on a Zetasizer Nano ZS instrument equipped with the DTS Ver. 4.10 software package (Malvern Instruments Ltd., Worcestershire, UK). The silica particles were dispersed in ethanol to a concentration of ∼10 μg mL–1 prior to measurement. The mean value of the particle size was calculated from the results of three measurements on each sample (Supporting Information, Figure S1).
Preparation of Isopropylaminopropanediol-Modified Silica Nanoparticles (Tem-I-SiO2)
Silica nanoparticles (3 g) and 3 mL of GPTMS were mixed in 20 mL of toluene. The mixture was purged with a gentle flow of nitrogen for 5 min and then stirred at 50 °C for 12 h. The silica particles were isolated by centrifugation, washed with toluene and methanol, and dried in a vacuum chamber. The GPTMS-modified silica (2.5 g) was mixed with 0.77 mL of isopropylamine in 15 mL of toluene. The mixture was purged with a gentle flow of nitrogen for 5 min and then stirred at 50 °C for 12 h. The silica particles were isolated by centrifugation, washed with toluene and methanol, and dried in a vacuum chamber.
Preparation of Aminopropanediol-Modified Silica Nanoparticles (Tem-II-SiO2)
The aminopropanediol-modified silica nanoparticles were prepared following the same procedure as used for Tem-I-SiO2, except that in the second reaction step 2 mL of ammonia (25%) was used instead of 0.77 mL of isopropylamine.
Preparation of Molecularly Imprinted Polymers (MIP-I and MIP-II) by Pickering Emulsion Polymerization
Template-modified silica nanoparticles (Tem-I-SiO2 or Tem-II-SiO2, 40 mg) were added to a mixture of MAA (0.136 mL) and water (5 mL), and the mixture was sonicated for 10 min to produce a stable suspension of colloidal particles in water (Supporting Information, Figure S2). After addition of EGDMA (0.864 mL) containing AIBN (30 mg), the pH value of the mixture was adjusted to 5.5 using 3 M NaOH. The mixture was again sonicated for 10 min and shaken vigorously for ∼1 min by hand to give a stable Pickering emulsion, where no coalescence of the oil droplets could be observed within 2 h. The resulting particle-stabilized emulsion was transferred into an oven and heated to 70 °C for 1 h and then maintained at 60 °C for 15 h without agitation. Following this polymerization procedure, composite polymer/silica particles were obtained.
To remove the soluble polyMAA, the particle suspension was mixed with 2 mL of tetrahydrofuran (THF), and the mixture was shaken vigorously. After decantation, the solid particles were washed with methanol and water. To remove the silica nanoparticles, the composite microspheres were transferred to a plastic tube and stirred in 3 mL of HF (30%) at room temperature for 12 h. After this step, the solid polymer microspheres were washed with methanol: acetic acid (90: 10) followed by pure methanol and then dried in a vacuum chamber.
ATR-FTIR Analysis
Attenuated total reflection (ATR) infrared spectra were recorded using a Perkin-Elmer FTIR instrument (Perkin-Elmer Instruments). All spectra were collected at 25 °C in the 4000–375 cm–1 region with a resolution of 4 cm–1 using 32 scans. To investigate the template-modified silica nanoparticles, the particles (20 μg) were dispersed in 1 mL of methanol, from which 20 μL was transferred onto the sample plate of the FTIR. The spectrum was collected after the methanol had completely evaporated.
Fluorescent Labeling with FITC
Different solid particles (2 mg) were added to 1 mL of aqueous solution of FITC (5 mg mL–1), and the mixture was stirred at room temperature in the dark for 8 h. The particles were separated by centrifugation and washed with methanol and water until no fluorescence could be observed from the supernatant. The particles were then dried in a vacuum chamber.
The fluorescence emission of FITC-labeled silica was measured using a QuantaMaster C-60/2000 spectrofluorimeter (Photon Technology International, Lawrenceville, NJ). The fine particles were dispersed in water to yield a particle concentration of 20 μg mL–1. The fluorescence measurement was carried out using an excitation wavelength of 492 nm and an emission wavelength of 519 nm. For the larger microspheres, the FITC-labeled particles were deposited on a glass slide and observed under a Nikon Eclipse E400 epifluorescence microscope equipped with a CCD camera.
Determination of Surface-Exposed Carboxyl Groups on MIP-I and MIP-II
The density of carboxyl groups on MIP-I and MIP-II was determined by titration with fluorescent acriflavin (AFN).(12) The imprinted polymer microspheres (10 mg) were added to 1 mL of AFN solution (1 mg L–1 in methanol) and stirred at room temperature in the dark for 16 h. After removing the solid particles (MIP-I or MIP-II) by centrifugation, the fluorescence intensity of the supernatant was measured. The difference in fluorescence intensity between the original AFN solution and the supernatant was used to calculate the number of carboxyl groups on the MIP microspheres.
Radioligand Binding Analysis
Imprinted polymer microspheres (5 mg) and [3H]-(S)-propranolol (246 fmol) were mixed in 1 mL of different solvents. For displacement experiments, an excess amount of competing compound was also added. The mixture was gently stirred at room temperature for 12 h. After centrifugation, the supernatant (500 μL) was collected, mixed with 10 mL of scintillation liquid (Ecoscint A), and measured using a Tri-Carb 2800TR liquid scintillation analyzer (PerkinElmer). The amount of [3H]-(S)-propranolol bound to the polymer particles was calculated by subtracting the amount of free radioligand from the total radioligand added.
Equilibrium Binding Analysis Using Fluorescence Measurement
Imprinted polymer microspheres (5 mg) and various test compounds were mixed in 1 mL water and stirred at room temperature for 12 h. After centrifugation, the supernatant was collected and the fluorescence intensity was measured using QuantaMaster C-60/2000 spectrofluorimeter. The amount of test compound bound to the particles was calculated from the reduction in fluorescence intensity resulting from addition of the solid particles. The fluorescence intensity was measured using the following parameters: propranolol, λex = 293 nm, λem = 352 nm; ANPO, λex = 293 nm, λem = 337 nm; atenolol, λex = 230 nm, λem = 302 nm; metoprolol, λex = 230 nm, λem = 300 nm; and pindolol, λex = 230 nm, λem = 287 nm.
Results and Discussion
Preparation and Characterization of MIPs
MIPs prepared using traditional methods are limited by the lack of group selectivity for analogous compounds. One important aim of this work was to prepare a new type of MIP using a structural moiety common to a group of target molecules as the template, so that the binding sites could be utilized to recognize a group of targets containing the same template structure. Here, we selected a group of β-blockers (propranolol and its structural analogues) as model targets and used the common isopropylaminopropanediol motif as the template (Tem-I, Figure 1a) to be immobilized on the silica nanoparticles. As a control, the slightly different aminopropanediol structure was used as a second template (Tem-II, Figure 1b). Silica particles with diameters of 10, 150, 220, and 330 nm were modified with Tem-I and Tem-II and used to prepare stable Pickering emulsions of monomer in water. After template immobilization, the obtained SiO2 particles are referred to as Tem-I-SiO2 and Tem-II-SiO2 (Figure 1).
Figure 1.
Structure of templates in Tem-I-SiO2 (a) and Tem-II-SiO2 (b).
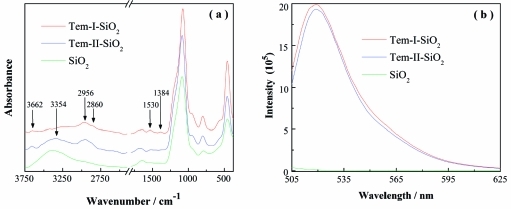
Successful immobilization of the templates was confirmed using ATR-FTIR analysis. In the spectrum depicted in Figure 2, the unmodified SiO2 has features at 3405 and 1635 cm–1, corresponding to the O–H vibration.(13) In contrast, Tem-I-SiO2 displays a new peak at 1530 cm–1 corresponding to the C–H bending vibration, two new peaks at 2860 and 2956 cm–1 corresponding to the CH2 symmetrical and unsymmetrical stretching, and a new peak at 3662 cm–1 due to O–H vibration in Tem-I. In addition, a new peak at 1384 cm–1 was assigned to the C–H bending vibration in the isopropyl group. These new IR signals suggest that Tem-I-SiO2 was successfully synthesized.(14) Similarly, Tem-II-SiO2 exhibits new IR signals corresponding to the −CH, −CH2, and OH of Tem-II as well as an NH2 stretching band at 3354 cm–1, indicating that Tem-II was successfully immobilized on the silica support.(15)
Figure 2.
ATR-FTIR spectra of silica nanoparticles (a) and fluorescence emission spectra of FITC-labeled nanoparticles (b). The fluorescence measurement was carried out using excitation wavelength at 492 nm and particle concentration of 20 μg mL–1.
The presence of the two template structures on silica was further verified using fluorescent labeling experiments. Tem-I-SiO2 and Tem-II-SiO2 were labeled with fluorescein isothiocyanate (FITC) through the amine groups. After thorough washing, the labeled nanoparticles were dispersed in methanol, and their fluorescence intensity was measured. As a control, the unmodified silica was treated under the same conditions followed by fluorescence measurement. Figure 2b contains the fluorescence spectra of nanoparticles labeled with FITC. Compared with the unmodified silica, Tem-I-SiO2 and Tem-II-SiO2 display significantly higher fluorescence intensity after being labeled with FITC, indicating the presence of amine groups on the surface of the two template-immobilized nanoparticles. The FITC labeling results (Figure 2b) suggest that Tem-I-SiO2 and Tem-II-SiO2 have approximately the same amount of amine groups. The density of template on Tem-I-SiO2 was also calculated from elemental analysis results. The content of carbon and nitrogen in Tem-I-SiO2 are 14.3% and 1.8%, respectively, suggesting that the molar ratio of C:N is approximately 9:1. This C:N ratio is in agreement with the structure of the organic fragment containing the isopropylaminopropanediol moiety. Based on the nitrogen content, the density of template immobilized on the silica NPs is ∼1.28 mmol g–1.
To prepare oil-in-water Pickering emulsions, Tem-I-SiO2 and Tem-II-SiO2 were employed as the stabilizing particles. A mixture of MAA and H2O was used as the water phase, and EGDMA containing the initiator (AIBN) formed the oil phase. Compared to unmodified SiO2, Tem-I-SiO2 and Tem-II-SiO2 are more hydrophilic and able to establish stable oil-in-water Pickering emulsions. The emulsions were subjected to thermal polymerization to produce polymer microspheres coated with either Tem-I-SiO2 or Tem-II-SiO2. The presence of Tem-I-SiO2 and Tem-II-SiO2 on the polymer microspheres was confirmed using fluorescence microscopy after FITC labeling. The composite microspheres prepared using Tem-I-SiO2 and Tem-II-SiO2 exhibited strong fluorescence after FITC labeling (Figure 3a,b). More specifically, the fluorescence intensity of the composite microspheres in Figure 3a increased by ∼103 times after FITC labeling. The strong fluorescence intensity suggests that the colloidal particles Tem-I-SiO2 and Tem-II-SiO2 are located on the surface of the composite microspheres.
Figure 3.
Fluorescence microscopy images of polymer microspheres: (a) FITC-labeled composite microspheres prepared using Tem-I-SiO2, (b) FITC-labeled composite microspheres prepared using Tem-II-SiO2, (c) unlabeled composite microspheres prepared using Tem-I-SiO2, and (d) FITC-labeled MIP-I, for which the surface-deposited silica colloids have been removed by treatment with HF. The maximum fluorescence intensities are approximately 1.5 × 10⁵ in (a) and (b), 150 in (c), and 200 in (d).
The composite microspheres were treated with HF to remove the surface-deposited silica nanoparticles. After thorough washing, the microspheres MIP-I and MIP-II were obtained, each imprinted using Tem-I or Tem-II. Treatment of MIP-I and MIP-II with FITC resulted in no obvious fluorescence being observed (Figure 3d), indicating that the colloidal silica particles together with the immobilized templates were completely removed. The MIP-I and MIP-II particles have almost identical sizes (Figure 3) and may therefore be used as controls for each other during evaluation of molecular binding properties. Unless otherwise indicated, the MIP-I or MIP-II particles discussed in this paper were synthesized using silica particles with a diameter of 10 nm.
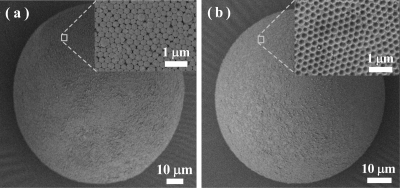
The size and surface morphologies of the microspheres before and after silica removal were examined using a scanning electron microscope. The microspheres prepared using 10 and 330 nm silica are both in the range of 80–240 μm (Supporting Information, Figure S3), which is in agreement with the results in Figure 3. To study the surface morphologies of the imprinted microspheres, we focused on the microspheres prepared using the large silica (330 nm) particles. Figure 4a reveals that the silica particles are located on the surface of the microspheres. After the silica was removed, open pores were created on the surface of the imprinted microspheres (Figure 4b), each containing easily accessible template-imprinted binding sites. This well-controlled hierarchical structure represents a new type of MIP that should have functional group selectivity and fast binding kinetics.
Figure 4.
SEM images of the polymer microspheres before (a) and after (b) the silica particles have been removed. The microspheres are prepared using 330 nm silica colloids in the Pickering emulsion polymerization.
Binding Profiles of the MIP Microspheres
The molecularly imprinted microspheres were evaluated for their specific binding to β-blockers containing the Tem-I template structure. We used tritium-labeled propranolol as a probe to investigate uptake by MIP-I, which was designed to bear specific binding sites for the isopropylaminopropanediol functional group. MIP-II was used as a control to evaluate nonspecific adsorption. Table 1 lists the uptake of [3H]-(S)-propranolol by MIP-I and MIP-II in various solvents. In all of the solvents tested, the uptake of [3H]-(S)-propranolol by MIP-I was in general higher than by MIP-II (Table 1, entries 1–5), suggesting that the new MIPs have successfully imprinted molecular binding sites. In pure acetonitrile, uptake of [3H]-(S)-propranolol by MIP-I was only slightly higher. By increasing water content, the nonspecific binding was significantly reduced, resulting in a binding ratio of 7.80 between MIP-I and MIP-II (Table 1, entries 2–4). Most importantly, MIP-I demonstrates the highest specific uptake of propranolol in pure water (Table 1, entry 5), which is dramatically different from all previously described MIPs.
Table 1. Radioligand Binding Analysis of MIP-I and MIP-II.
| uptake of propranolol (%) |
|||||
|---|---|---|---|---|---|
| entry | silica colloids (nm) | solvent | MIP-I | MIP-II | boundMIP-I/boundMIP-II |
| 1 | 10 | toluene | 1.53 | 1.28 | 1.20 |
| 2 | 10 | acetonitrile | 15.9 | 11.0 | 1.45 |
| 3 | 10 | mixturea | 16.1 | 7.24 | 2.22 |
| 4 | 10 | mixtureb | 16.0 | 2.05 | 7.80 |
| 5 | 10 | water | 24.9 | 1.94 | 12.8 |
| 6 | 150 | water | 19.5 | 2.08 | 9.37 |
| 7 | 220 | water | 11.8 | 1.32 | 8.93 |
| 8 | 330 | water | 8.10 | 1.28 | 6.32 |
Acetonitrile with 1% water.
Acetonitrile with 5% water.
The hierarchical MIPs described here have a hydrophilic surface and can be directly used in pure water without any noticeable particle aggregation. The hydrophilic nature of the MIP particles also resulted in unusual swelling behavior when tested in different solvents (Supporting Information). The amount of solvent adsorbed by MIP-I was 0.43, 0.47, 0.14, and 0.10 mL g–1 for water, 2-propanol, toluene, and cyclohexane, respectively. This is in contrast to traditional hydrophobic MIPs prepared using the same monomer composition (MAA and EGDMA). The hydrophilic characteristics of MIP-I and MIP-II were clearly demonstrated by measuring the surface-exposed carboxyl groups in these materials. By titration with fluorescent AFN, the surface-exposed COOH content of both MIP-I and MIP-II was found to be ∼0.9 μmol g–1 (Supporting Information, Figure S4). For microspheres with a diameter of 200 μm and a density of 1.19 g cm–3, this value is equivalent to a surface density of 22 COOH groups nm–2, similar to that of previously reported hydrophilic poly(MAA-co-EGDMA) microspheres.(16) The high density of COOH on the surface of the present microspheres may be explained by considering the partitioning of MAA between the water and oil phases during the Pickering emulsion polymerization: the fact that MAA is soluble in both EGDMA (the oil phase) and water enriches its concentration on the surface of the microspheres that are being formed. The interior of the microspheres is considered to be mainly composed of EGDMA and more hydrophobic. When used in aqueous solutions, the hydrophilic surface of MIP-I and MIP-II can prevent nonspecific adsorption(17) and make it possible for water molecules to participate in the selective binding of the target compounds.(18) The effect of the hierarchical structures generated by the various silica particles on propranolol binding was also studied. When small silica particles were used to form the Pickering emulsion, the MIP-I microspheres displayed much higher propranolol binding than the control (Table 1, entries 5–8). While a low nonspecific binding in water was observed for MIP-I samples, the uptake of [3H]-(S)-propranolol by MIP-I prepared using the smallest (10 nm) silica colloids was as high as 13 times the control polymer. The reason for the increased specific binding may be that when using smaller silica nanoparticles, more templates contribute to the formation of imprinted sites, leading to a higher density of specific binding sites in the final MIP.
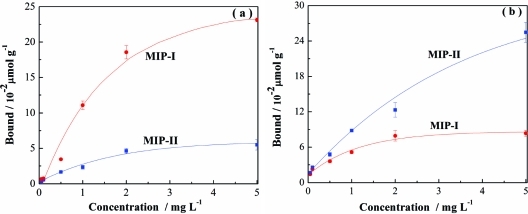
To confirm that molecularly imprinted sites may be created using both Tem-I and Tem-II as templates, we also studied the uptake of propranolol and its structural analogue 1-amino-3-naphthalen-1-yloxypropan-2-ol (ANPO) by MIP-I and MIP-II. On the basis of the structure of the two templates used during the imprinting reaction, MIP-I should preferentially bind propranolol and MIP-II should bind ANPO. The two imprinted polymers indeed displayed obvious specific binding for the test compounds containing the correct template structure (Figure 5).
Figure 5.
Uptake of propranolol (a) and ANPO (b) by 5 mg of MIP-I or MIP-II in water.
Binding Kinetics of Propranolol
The new MIPs prepared in this work have a well-controlled hierarchical structure, i.e., nanometer-sized pores containing surface-exposed molecular binding sites. The open diffusion channel and the accessible binding sites have been designed to provide fast molecular binding kinetics.(19) The kinetics of propranolol binding on MIP-I is illustrated in the inset of Figure 6, where MIP-II was used as a control. The maximum propranolol binding by MIP-I was significantly higher. Compared to traditional MIPs that require long incubation times (several hours) to reach binding equilibrium,(20) it took only 20 min for MIP-I to achieve maximum propranolol binding.
Figure 6.
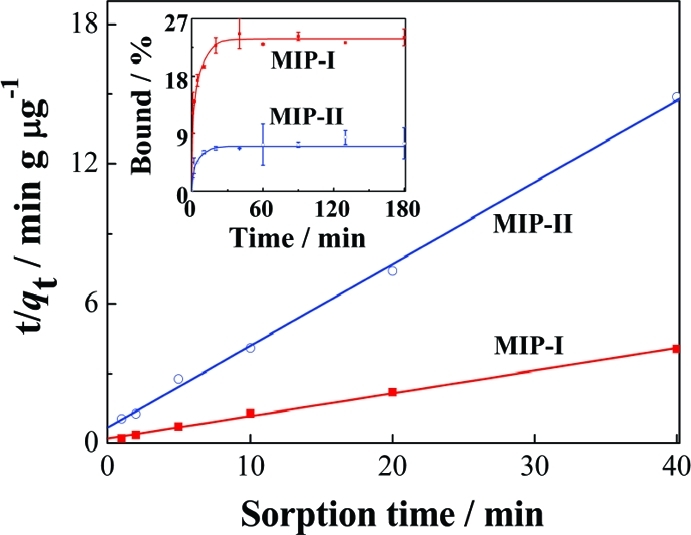
Analysis of kinetic binding data using a pseudo-second-order kinetic model. The inset is kinetics of propranolol binding with 5 mg of MIP-I and MIP-II. The initial propranolol concentration was 0.674 μM.
Supposing both high affinity and low affinity sites contribute to total propranolol binding, the sorption data in Figure 6 (between 0 and 40 min) may be fitted to a pseudo-second-order kinetic model (eq 1):
in which qt and qe are the amounts sorbed at time t and at equilibrium, and k2 (μg g–1 min–1) is the rate constant of the pseudo-second-order sorption.(21) If the initial sorption rate v = k2qe2, eq 1 may be modified to eq 2:(13)
The constant v and qe may be obtained by plotting t/qt vs t (Figure 6). For both MIP-I and MIP-II, the experimental data are well fitted to the pseudo-second-order model with a correlation coefficient (r2) >0.99. Under the experimental conditions, the qe value for MIP-I (10.3 μg g–1) was 3.61 times that for MIP-II (2.85 μg g–1) and the initial sorption rate on MIP-I (4.99 μg g–1 min–1) was 3.37 times that on MIP-II (1.48 μg g–1 min–1). The larger values of qe and ν for propranolol strongly indicate the presence of well-defined binding sites on the surface of MIP-I.
Group Selectivity of the Hierarchical MIPs
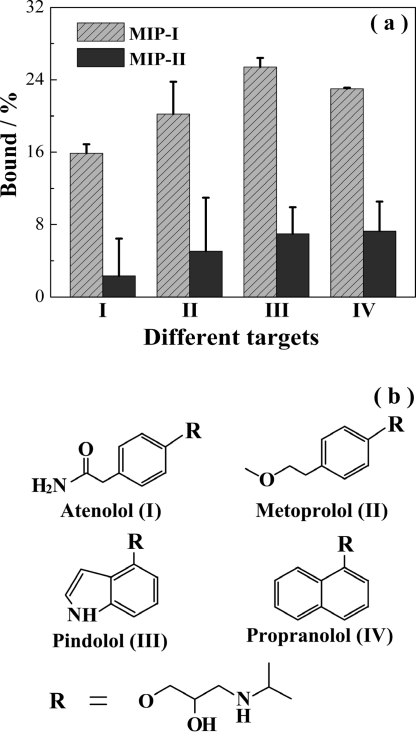
The group selectivity of the hierarchical MIPs was studied by measuring their uptake of several β-blockers containing the Tem-I moiety. The uptake of atenolol, metoprolol, pindolol, and propranolol by MIP-I and MIP-II in water is depicted in Figure 7. It is clear that for all of the β-blockers tested MIP-I exhibited significantly higher binding due to the presence of the specific sites, thereby demonstrating a general group selectivity to β-blockers having the isopropylaminopropanediol epitope.
Figure 7.
(a) Uptake of atenolol (I), metoprolol (II), pindolol (III), and propranolol (IV) by MIP-I and MIP-II. The initial concentration of the test compounds was 0.674 μM. (b) Structures of the test compounds.
To investigate the importance of the template structure on target binding, we also carried out competitive radioligand binding experiments in which an excess of various compounds (19.2 μM) were added to a mixture of MIP-I and [3H]-(S)-propranolol (246 pM) in water. Depending on the molecular similarity, the added compounds were expected to displace the radioactive propranolol from MIP-I to varying degrees. The potency of displacement for propranolol binding was in the order pindolol > timolol >1-naphthol (Table 2) and can be explained by the structural relationship between propranolol and the three competing compounds. It should be noted that isopropylamine had almost no effect on propranolol binding, suggesting that the imprinted sites are selective for the more extended Tem-I structure containing the additional propanediol moiety.
Table 2. Displacement of Bound [3H]-Propranolol from MIP-I with Different Competing Compounds.
The displacement of radioligand propranolol is calculated as displacement (%) = [(bound0 – bound)/bound0] × 100, where bound0 and bound are the amount of [3H]-(S)-propranolol bound by MIP-I in the absence and presence of the competing compounds, respectively.
Conclusion
We have developed a new interfacial nano and molecular imprinting method based on Pickering emulsion polymerization. In this method, a template structure is first immobilized on silica nanoparticles. The template-modified nanoparticles are then used to establish a stable oil-in-water emulsion, followed by radical polymerization of the functional and cross-linking monomer in the oil phase. The imprinted microspheres prepared using the new interfacial nano and molecular imprinting have the following interesting features: (1) a well-controlled hierarchical structure composed of large pores decorated with easily accessible molecular binding sites, (2) group selectivity toward a series of chemicals having a common structural moiety (epitopes), and (3) a hydrophilic surface that enables the MIPs to be used under aqueous conditions. Because of these outstanding performances, the new materials have enormous potential applications for bioseparation, chemical sensing, and catalysis. We believe that the interfacial imprinting method described in this work may be further extended to develop new hierarchical MIPs for recognition of large biomacromolecules (proteins), viruses, or even bacteria.
Acknowledgments
This work was supported by the Swedish Research Council (VR) and the Swedish Research Council for Environment, Agricultural Sciences and Spatial Planning (FORMAS).
Supporting Information Available
Experimental details including particle stability in water, DLS data, fluorescence spectra of AFN, SEM images of polymer microspheres, and swelling experiments. This material is available free of charge via the Internet at http://pubs.acs.org.
Supplementary Material
References
- a Ye L.; Mosbach K. Chem. Mater. 2008, 20, 859–869. [Google Scholar]; b Wulff G. Chem. Rev. 2002, 102, 1–28. [DOI] [PubMed] [Google Scholar]; c Sellergren B. Macromolecules 2006, 39, 6306–6309. [Google Scholar]; d Ye L.; Mosbach K. J. Am. Chem. Soc. 2001, 123, 2901–2902. [DOI] [PubMed] [Google Scholar]; e Zimmerman S. C.; Wendland M. S.; Rakow N. A.; Zharov I.; Suslick K. S. Nature 2002, 418, 399–403. [DOI] [PubMed] [Google Scholar]; f Shen X.; Zhu L.; Li J.; Tang H. Chem. Commun. 2007, 1163–1165. [DOI] [PubMed] [Google Scholar]
- a Hoshino Y.; Koide H.; Urakami T.; Kanazawa H.; Kodama T.; Oku N.; Shea K. J. J. Am. Chem. Soc. 2010, 132, 6644–6645. [DOI] [PMC free article] [PubMed] [Google Scholar]; b Yu Y.; Ye L.; Haupt K.; Mosbach K. Angew. Chem., Int. Ed. 2002, 41, 4459–4463. [DOI] [PubMed] [Google Scholar]; c Vlatakis G.; Andersson L. I.; Müller R.; Mosbach K. Nature 1993, 361, 645–647. [DOI] [PubMed] [Google Scholar]; d Piletska E. V.; Guerreiro A. R.; Whitcombe M. J.; Piletsky S. A. Macromolecules 2009, 42, 4921–4928. [Google Scholar]; e Frasconi M.; Tel-Vered R.; Riskin M.; Willner I. J. Am. Chem. Soc. 2010, 132, 9373–9382. [DOI] [PubMed] [Google Scholar]
- a Cutivet A.; Schembri C.; Kovensky J.; Haupt K. J. Am. Chem. Soc. 2009, 131, 14699–14702. [DOI] [PubMed] [Google Scholar]; b Liu J. Q.; Wulff G. J. Am. Chem. Soc. 2008, 130, 8044–8054. [DOI] [PubMed] [Google Scholar]; c Takeda K.; Kuwahara A.; Ohmori K.; Takeuchi T. J. Am. Chem. Soc. 2009, 131, 8833–8838. [DOI] [PubMed] [Google Scholar]
- a Dai S.; Burleigh M. C.; Ju Y. H.; Gao H. J.; Lin J. S.; Pennycook S. J.; Barnes C. E.; Xue Z. L. J. Am. Chem. Soc. 2000, 122, 992–993. [Google Scholar]; b Hu X.; An Q.; Li G.; Tao S.; Liu J. Angew. Chem., Int. Ed. 2006, 45, 8145. [DOI] [PubMed] [Google Scholar]; c Vandevelde F.; Belmont A.-S.; Pantigny J.; Haupt K. Adv. Mater. 2007, 19, 3717. [Google Scholar]; d Nematollahzadeh A.; Sun W.; Aureliano C. S. A.; Luetkemeyer D.; Stute J.; Abdekhodaie M. J.; Shojaei A.; Sellergren B. Angew. Chem., Int. Ed. 2011, 50, 495. [DOI] [PubMed] [Google Scholar]
- a Yilmaz E.; Haupt K.; Mosbach K. Angew. Chem., Int. Ed. 2000, 39, 2115–2118. [DOI] [PubMed] [Google Scholar]; b Yang H.-H.; Zhang S.-Q.; Tan F.; Zhuang Z.-X.; Wang X.-R. J. Am. Chem. Soc. 2005, 127, 1378–1379. [DOI] [PubMed] [Google Scholar]; c Nishino H.; Huang C.-S.; Shea K. J. Angew. Chem., Int. Ed. 2006, 118, 2452–2456. [Google Scholar]; d Titirici M. M.; Hall A. J.; Sellergren B. Chem. Mater. 2002, 14, 22–23. [Google Scholar]
- a Dinsmore A. D.; F. H. M.; Nikolaides M. G.; Marquez M.; Bausch A. R.; Weitz D. A. Science 2002, 298, 1006–1009. [DOI] [PubMed] [Google Scholar]; b Thompson K. L.; Armes S. P.; Howse J. R.; Ebbens S.; Ahmad I.; Zaidi J. H.; York D. W.; Burdis J. A. Macromolecules 2010, 43, 10466–10474. [Google Scholar]
- Colver P. J.; Colard C. A. L.; Bon S. A. F. J. Am. Chem. Soc. 2008, 130, 16850–16851. [DOI] [PubMed] [Google Scholar]
- Pickering S. U. J. Chem. Soc., Trans. 1907, 91, 2001–2021. [Google Scholar]
- Nie Z.; Park J.-I.; Li W.; Bon S. A. F.; Kumacheva E. J. Am. Chem. Soc. 2008, 130, 16508–16509. [DOI] [PubMed] [Google Scholar]
- Stöber W.; Fink A.; Bohn E. J. Colloid Interface Sci. 1968, 26, 62–69. [Google Scholar]
- Chen S.-L. Colloids Surf., A 1998, 142, 59–63. [Google Scholar]
- Ivanov V. B.; Behnisch J.; Hollander A.; Mehdorn F.; Zimmermann H. Surf. Interface Anal. 1996, 24, 257–262. [Google Scholar]
- Shen X.; Zhu L.; Huang C.; Tang H.; Yu Z.; Deng F. J. Mater. Chem. 2009, 19, 4843–4851. [Google Scholar]
- Šapić I. M.; Bistričić L.; Volovšek V.; Dananić V.; Furić K. Spectrochim. Acta, Part A 2009, 72, 833–840. [DOI] [PubMed] [Google Scholar]
- Sales J. A. A.; Prado A. G. S.; Airoldi C. Polyhedron 2002, 21, 2647–2651. [Google Scholar]
- Song J.-S.; Chagal L.; Winnik M. A. Macromolecules 2006, 39, 5729–5737. [Google Scholar]
- a Haginaka J.; Sanbe. H. Anal. Chem. 2000, 72, 5206–5210. [DOI] [PubMed] [Google Scholar]; b Puoci F.; Iemma F.; Cirillo G.; Curcio M.; Parisi O. I.; Spizzirri U. G.; Picci N. Eur. Polym. J. 2009, 45, 1634–1640. [Google Scholar]; c Haginaka J.; Takehira H.; Hosoya K.; Tanaka. N.; Haginaka J. J. Chromatogr. A 1999, 849, 331–339. [DOI] [PubMed] [Google Scholar]; d Yang K.; Berg M. M.; Zhao C.; Ye L. Macromolecules 2009, 42, 8739–8746. [Google Scholar]
- Jayasundera S.; Zeinali M.; Miller J. B.; Velea L. M.; Gaber B. P.; Markowitz M. A. J. Phys. Chem. B 2006, 110, 18121–18125. [DOI] [PubMed] [Google Scholar]
- Jung B. M.; Kim M. S.; Kim W. J.; Chang J. Y. Chem. Commun. 2010, 46, 3699–3701. [DOI] [PubMed] [Google Scholar]
- Andersson L. I. Anal. Chem. 1996, 68, 111–117. [DOI] [PubMed] [Google Scholar]
- Ofomaja A. E. Chem. Eng. J. 2008, 143, 85–95. [Google Scholar]
Associated Data
This section collects any data citations, data availability statements, or supplementary materials included in this article.


