Abstract
A classical nonpolarizable force field is presented for the simulation of aqueous alkali halide solutions (MX), where M = Li+, Na+, K+, Rb+, Cs+ and X = F−, Cl−, Br−, I−, and their interactions with biomolecules. The models are specifically designed to reproduce the experimental Kirkwood-Buff integrals, and thereby the solution salt activities, as a function of salt concentration. Additionally, we demonstrate that these models reasonably reproduce other experimental properties including ion diffusion constants, dielectric decrements, and the excess heats of mixing. The parameters are developed by considering the properties of aqueous NaX and MCl solutions using a previously established model for NaCl. Transferability of the parameters to other salts is then established by the successful simulation of additional aqueous salt solutions, KI and CsBr, not originally included in the parameterization procedure.
Introduction
Aqueous solutions of alkali metal halides are not only the simplest models for the aqueous electrolyte solutions, but they also play an important role in many biological systems. They can help to stabilize biomolecules, such as proteins, nucleic acids, and lipids, and are often involved in biological catalysis.1–3 Because of their importance in biological phenomena, and the desire to study these more complicated ternary systems using computer simulation, many force fields for alkali metal cations and halide anions have been reported in the literature.4–11 A recent comprehensive survey has also been provided Joung and Cheatham.4 The wide range of parameter sets available for salt systems is, in our opinion, a direct result of the fact that there is relatively little experimental data available that is both sensitive to changes in the ion parameters and also easily amenable to simulation. Furthermore, as our ability to access longer simulation timescales has improved a number of problems with many of the existing ion force fields have recently come to light.12,13 One approach to solving these problems is the use of models which explicitly include polarization effects.14–16 However, as this significantly increases the computational demand, the vast majority of biomolecular simulations still do not include explicit polarization effects. Therefore, there remains a need for simple but reliable ion force fields, especially for systems displaying slow relaxation times.
Recently, there have been three major attempts to develop force fields for all alkali metals and halide ions. Jensen and Jorgensen have developed TIP4P water compatible alkali halide parameters using the ion hydration free energies and ion-water contact distances as target data.11 Joung and Cheatham4 have also used the free energy of hydration for individual ions, as well as the lattice energies and the lattice constants of alkali metal halides and gas phase ion-water interaction energies, in order to produce force fields for all the alkali metal and halide ions which are compatible with three commonly used nonpolarizable water models; namely SPC/E, TIP3P, and TIP4PEW. Horinek et al.17 have used both the free energy and the entropy of hydration of the individual ions in order to parameterize their force fields, and focused on the nonpolarizable SPC/E water model. Horinek et al. argued that their force field would be more applicable for biomolecular simulations where the salt concentrations are low, while the Joung and Cheatham force fields would be more applicable when the salt concentrations are moderate. All three force fields attempt to reproduce a series of initial properties; including the free energies (and entropies) of hydration, the first peak of the ion-water radial distribution function (rdf), gas phase ion-water binding energies, and crystal lattice parameters. However, they were essential developed using properties that that do not directly probe ion-ion interactions in solution. A subsequent study has since evaluated the solute activity for two salts using the Joung and Cheatham force fields obtained using thermodynamic integration.18 This does probe ion-ion interactions. However, the study provided only moderate success – good results were obtained for KCl but significant deviations from experiment were observed for NaCl solutions above 0.5 m.18 The comparison of simulated and experimental diffusion constants and solubilities also provided mixed results.
We have taken a very different approach in an attempt to develop accurate force fields for solution mixtures. Our approach is based on the thermodynamics of solution mixtures as described by Kirkwood-Buff (KB) theory.19–26 Here, the central properties of interest are the Kirkwood-Buff integrals (KBIs) defined by,
| (1) |
where Gij is the KBI between species i and j, is the corresponding radial distribution function (rdf) in the grand canonical ensemble at the composition of interest, and r is the center of mass distance between the two species. An excess coordination number can be defined by Nij = ρjGij, where ρj = Nj/V is the number density of j particles. The physical meaning of the excess coordination number is the difference in the number of j species in the vicinity of a central i species on addition of the i species, from that found in an equivalent volume of bulk solution. Hence, a value of Nij significantly greater than zero indicates an excess of species j in the vicinity of species i (over the random bulk distribution), while a significant negative value corresponds to a depletion of species j surrounding i. Combinations of KBIs provide expressions for a variety of thermodynamic properties of the solution of interest.27,28
Kirkwood-Buff theory can then be used to relate solution structure, in terms of the KBIs, to the thermodynamic behavior of the solution.29–31 The expressions provided by KB theory are exact and the theory involves no approximations beyond the usual statistical mechanical assumptions (larger number of molecules, thermodynamic limit, etc). The expressions can be applied to study any stable solution mixture involving any number of components of any type (small molecules through to proteins) at any composition and any temperature and pressure. The analysis of experimental data for solution mixtures using KB theory is well established and provides quantitative information concerning species distributions in solutions and how they vary with composition.28,29,32 The resulting KBIs can also be obtained from computer simulations and thereby provide a rigorous test of the accuracy of current force fields.31,33
Our parameters were developed to reproduce the properties of solution mixtures and are therefore collectively known as Kirkwood-Buff derived force fields (KBFF).19–25 The parameters for the KBFF models are determined using a combination of molecular dynamics simulation, the Kirkwood-Buff (KB) theory of solutions, and available experimental data concerning activity coefficients and solution densities. This approach has several advantages. First, KB theory is exact and includes no approximations. Second, KB theory can be applied to any stable solution mixture. Third, the KB integrals are easily obtained from the radial distribution functions (rdf) provided by MD simulations and are quite sensitive to the force field parameters. Fourth, the KB integrals help quantify the distributions arising from the relative strengths of the solute-solute and solute-solvent interactions.25,34 Hence, the general philosophy of the Kirkwood-Buff derived force field approach is to use the KBIs obtained from an analysis of the experimental data as target values for the development of accurate force fields for a variety of solutes. The target data is composition dependent and this dependence is also used during the parameterization process. We have then argued that reasonable agreement with experiment is also obtained for other properties not included in the original parameterization.19,20,22–25 In doing so we favor the use of data for solution mixtures, primarily the KBIs, and are less influenced by gas phase data or infinite dilution data such as free energies of hydration. A model for aqueous NaCl solutions has already been developed using this type of approach,25 and here we simply generalize this initial model to include other alkali halide salts.
Recently, two research groups have also produced KB derived force fields for some of the alkali metal halides. Hess and van der Vegt used the SPC/E water model to develop KB-derived force fields for Li+ and K+ in order to explain the differential binding affinity of alkali metal ions to carboxylate ions.35 Klasczyk and Knecht used the SPC water model and the KBFF force field for the chloride ion to develop force fields for Li+, K+, Rb+, and Cs+, but not for halide ions.36 Therefore, the more extensive Klasczyk and Knecht force field is incomplete and, in principle, incompatible with our models because we use the SPC/E water model. In this paper we present a KB derived force field for a wide variety of alkali metal and halide ions. The models are intended to be applicable over the whole concentration range and are consistent with our previous models for a variety of solutes in both aqueous and nonaqueous solutions.
Methods
Kirkwood-Buff Analysis of Alkali Halide Solutions
The complete details concerning the extraction of the KBIs from the experimental data, the so called Kirkwood-Buff inversion procedure, have been provided elsewhere.27,28,37 For a binary solution consisting of water (w) and a salt cosolvent (c), a variety of thermodynamic quantities can be defined in terms of the KB integrals Gww, Gcc, and Gcw = Gwc, and the number densities (or molar concentrations) ρw and ρc.25 By use of the KB inversion procedure one can also extract the composition dependent KBIs from the corresponding experimental thermodynamic properties.28 Specifically, the KB inversion approach uses composition dependent experimental binary solution data for the isothermal compressibility, partial molar volumes, and cosolvent activity in order to extract the corresponding three KBIs using the expressions provided by KB theory. Hence, KB theory provides a link between measurable experimental data and the species distributions in solution, which are then quantified in terms of the KBIs. The relationships used for the present work are,27
| (2) |
where κT is the isothermal compressibility, are partial molar volumes, and μcc represents a chemical potential (or activity) derivative given by,
| (3) |
where γc = γ± is the molal activity coefficient of the salt and mi is the molality of i. Hence, the three KBIs can be obtained from a knowledge of the compressibility, partial molar volumes (or density), and activity as a function of composition (three equations in three unknowns).
Experimental activity coefficient data at 298.15 K and 1 atm were taken from the literature,38 and fitted to the following functional form,38,39
| (4) |
where ms is the salt molality and the a’s represent fitting parameters with no particular physical meaning. The first term on the right hand side of Equation 4 is a Debye-Hueckel term for 1:1 salts which is required to fully capture the correct behavior of salts at low salt concentrations. Issues associated with the quality of fit for the experimental activity coefficient data provide the main source of error in the KB analysis. The final fitting parameters are provided in the supporting information. Previously established polynomial fitting expressions for the experimental density data of salts,40 were used to determine partial molar volumes using standard approaches.41 The solution compressibility has a negligible effect on the resulting KBI values for solutions at moderate temperatures and pressure.32 Hence, the compressibility was assumed to follow the simple relationship, , where ϕi is the volume fraction and is the compressibility of the pure substance (water or salt). The compressibility of pure water was taken to be 4.6×10⁻¹⁰ m2/N,42 while the compressibilities of the salt crystals were taken to be zero. The experimental compressibility (approximated), partial molar volumes, and activity provided by Equation 4 were then used with the expressions provided in Equation 2 to isolate the experimental KBIs as a function of composition. The results of the KB inversion analysis are presented in Figure 1.
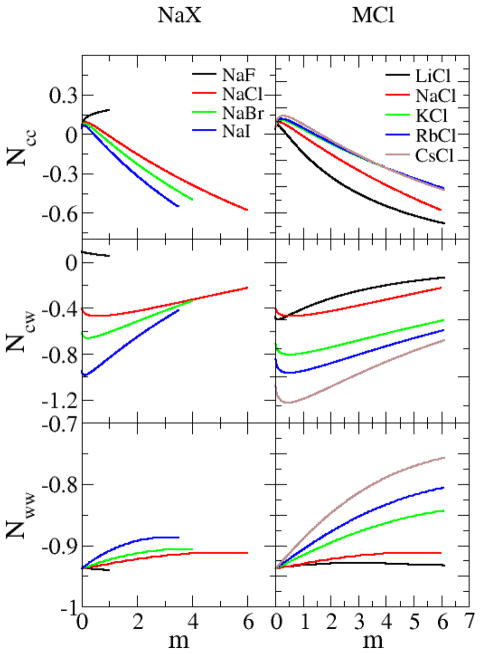
Figure 1.
Experimentally derived excess coordination numbers for aqueous alkali halide solutions as a function of salt molality at 298.15 K and 1 atm.
Kirkwood-Buff Theory of Salt Solutions
Some complications arise when applying KB theory to salt solutions.25,43 First, the salt can dissociate into free cations and anions (we will assume complete dissociation for the salts examined here). Second, electroneutrality constraints for regions of the solution surrounding each species provide additional relationships between the KBIs.43 Let us consider a salt containing at total of n ions which will fully dissociate to provide n+ cations and n− anions. If one chooses the salt as the relevant thermodynamic species then dμs = nRTdln(msγ±) and the activity derivatives provide a set of KBIs (Gss and Gsw) involving the salt “molecules” when using the KB inversion approach. However, this choice is rather awkward from the simulation point of view as we typically observe free ions for strong electrolytes, and therefore the rdfs between salt “molecules” are difficult, if not impossible, to determine. Consequently, in this work the salt solution is treated as a binary system of indistinguishable ions (c) and water (w), and we will distinguish between the cosolvent (total ion) concentration, mc or ρc, and the classic salt concentration, ms or ρs. Consequently, for a n+:n− salt one has nms = mc, nρs = ρc, , and yc = y±. In addition, the following relationships are also obeyed, dμs =ndμc, ρs dμs = ρc dμc, d lnms = d lnmc, and ρcdlnac +ρwdlnaw = ρs dlnas +ρwdlnaw =0, at constant p and T – the latter being the Gibbs-Duhem equation.
Hence, the experimental data can then be analyzed in terms of either salt molecules or a collection of indistinguishable ions. The resulting KBIs obtained from the two formalisms are related by,
| (5) |
The KBIs obtained from the indistinguishable ion approach (Gcc and Gcw) involve rdfs between the ions (and water molecules), which ignore the ion identity (cation or anion). The relationships between the KBIs using the cosolvent label and those involving the anion/cation label are provided by,
| (6) |
and were obtained in a similar manner as used previously.25 Here, the KBI denoted as G++ refers to the integral over the cation-cation rdf in solution. We note that the above relationships merely reflect a change in indices and do not invoke the electroneutrality conditions.
If one then assumes that electroneutrality must be obeyed in the local regions surrounding each molecule or ion,22,25,43 then one can show that the following relationships must also hold,
| (7) |
where ρ+ is the number density of cations, etc. Hence, all the ion-ion KBIs are related and there is only one independent KBI for a binary solution. We choose this to be Gcc for the present analysis.
Molecular dynamics simulations
All molecular dynamics simulations of alkali halide solutions were performed using the SPC/E water model44 in the isothermal isobaric (NpT) ensemble at 300 K and 1 atm as implemented in the GROMACS program (v3.3.1).45,46 A time-step of 2 fs was used and the geometry of the water molecules was constrained using SETTLE.47 The weak coupling technique was used to modulate the temperature and pressure with relaxation times of 0.1 and 0.5 ps, respectively.48 The particle mesh Ewald technique (PME) was used to evaluate electrostatic interactions using a cubic interpolation and a grid spacing of 0.1 nm for the reciprocal space sum, coupled with tin-foil boundary conditions.49 The initial cubic boxes for each solution at the required concentration were generated by randomly placing water molecules with ions starting from pure solvent boxes of length varying between 4 and 6 nm. During the simulations configurations were saved every 0.1 ps for analysis. Diffusion constants were determined using the mean square fluctuation approach,50,51 and relative permittivities were obtained from the dipole moment fluctuations.52,53 The excess enthalpy of mixing (ΔHmix) was determined by an established procedure which uses the average potential energies,54 and the configurational energies from the pure SPC/E water and the alkali halide lattice.
Kirkwood-Buff Analysis of the Simulation Data
Radial distribution functions were obtained for each system and composition. The pair rdfs thereby correspond to the ion-ion, ion-water, and water-water distributions after averaging over all other ions and water molecules at that particular composition. The indistinguishable ion treatment for salts involves the determination of ion-ion and ion-water rdfs which ignore the identity of the ions involved. For example, in NaCl solutions the ion-water rdf is determined after averaging over the ion-water distributions using both types of ion, sodium and chloride, at the origin. The Kirkwood-Buff integrals (KBIs) are defined for systems open to all the solution components. However, most simulations are performed in closed systems. Hence, one has to approximate the KBIs by truncating the integral after a certain distance,
| (8) |
where R represents a correlation distance within which the solution composition differs from the bulk composition. This approximation has been shown to be very reasonable as long as the systems are not too small (L > 4 nm) and sufficient sampling (> 5ns) is achieved.26,29,55 The values of Gij used here were determined by averaging the integral over a short range of distances (1.2 ~ 1.5 nm), taken as approximately one water-water solvation shell. The final values were relatively insensitive to the exact distance and range used, but this approach helps to reduce statistical fluctuations associated with the integrals. Once the three simulated KBIs have been obtained from the trajectory at a particular bulk composition, one can then use these values in a series of expressions which provide thermodynamic properties of the solution mixture. The partial molar volumes of the components ( ) are given by,41
| (9) |
Using the simulated KBIs one can determine a variety of derivatives of the chemical potential, depending on the concentration scale used. Here, we choose derivatives of the activity with respect to molarity.25 Of primary interest is the following activity derivative,
| (10) |
where ac and yc are the cosolvent (average ion) molar activity and molar activity coefficient, respectively. Hence, changes in the cosolvent activity can be determined directly from the simulations. Furthermore, accurate activity derivatives ensure reasonable activities are thereby obtained. The partial molar volumes and activities obtained in this manner have been shown to be in agreement with the results obtained using alternative computational approaches.21,56
Parameter development
The KBFF models used in this study involve a simple classical nonpolarizable description for each molecules. The intermolecular interactions are described by the Coulomb and Lennard-Jones (LJ) 6–12 potentials, which contain just two adjustable parameters for ions; namely the Lennard-Jones diameter (σ) and the interaction strength (ε). In this scheme, each pair of atoms i and j interact with an interaction energy given by,
| (11) |
Here, all the symbols have their usual meaning.1 This model was chosen so as to be computationally efficient, while maintaining compatibility with existing force fields and programs used for the simulation of biomolecules. The ion parameters are combined with the SPC/E model for water.44 Geometric combination rules were used for both σ and ε. In order to obtain parameters for the LJ term we have employed the same method described previously for NaCl.25 This approach requires three pieces of experimental data: ionic radii of alkali and halide ions that are consistent with the crystal lattice dimensions; crystal lattice unit cell dimensions; and the ion to water oxygen contact distances (see Table 1). This data was chosen in an effort to be both consistent with our previous force fields, and to help restrict the range of possible σ and ε values to be studied. However, satisfactory agreement with the experimental data was not possible for all ions using this simple approach (see below).
Table 1.
Experimental data used during the initial parameter development: r, the ionic radii of alkali halide ions which are consistent with the crystal lattice dimensions; a, the crystal lattice unit cell dimension; and d, the ion to water oxygen contact distance.
The first step was to parameterized the anions (F−, Br−, I−) by studying the crystal structures and several aqueous solutions of NaF, NaBr, and NaI, using the same Na+ parameters from our previous NaCl study.25 The values of σ-- were determined by scaling the ionic radii of each ion with the same scaling factor as used previously (2.43).25 The values of ε-- were then varied in an effort to reproduce the experimental lattice dimensions of the sodium halide crystals, and the anion-water contact distances, in the simulations. The final values determined for each ion were then used to provide the simulated KBIs for a variety of aqueous solutions. Unfortunately, in the case of the F− anion a reasonable value for σFF which reproduced the crystal lattice dimensions could not be obtained by a simple scaling approach. Hence, we decided to develop specific values of σFF (and εFF) which attempted to reproduce both the crystal lattice dimensions and solution KBIs.
Second, the initial cation parameters for Li+, K+, Rb+ and Cs+ were developed by reference to the crystal dimensions of LiCl, KCl, RbCl, and CsCl, and the relevant cation-water contact distances. After the values of σ++ were determined by scaling the ionic radii of each ion, the values of ε++ were varied to reproduce the crystal unit cell dimensions and the cation-water contact distances. Unfortunately, and in agreement with our earlier study of NaCl,25 we could not reproduce the experimental KBIs in aqueous solution by using standard combination rules for ε++ in aqueous solutions. Hence, modified ε parameters were developed specifically for the cation to water oxygen interactions. This interaction was subsequently modified by introducing a simple scale factor (s) for the interaction between metal ions and water oxygens such that εMO = s (εMM εOO)0.5. This parameter scales the repulsive part of the LJ potential controlling the contact distance between an ion and first shell water molecules. The scale factor was set to unity for all other interactions. The final scaling factors for the metal ion and to water interactions are provided in Table 2. Unfortunately, this simple approach did not work for LiCl. Hence, unique (not scaled) LJ values were determined for this salt by reference to the LiCl crystal dimensions and solution KBIs.
Table 2.
Final force field parameters describing the KBFF models for alkali halides.
| Model | Atom | σii (nm) | εii (kJ/mol) | εiO (kJ/mol) | q (e) |
|---|---|---|---|---|---|
| KBFF | Li | 0.182 | 0.7000 | 0.2700 | +1.0 |
| Na | 0.2450 | 0.3200 | 0.3420 | +1.0 | |
| K | 0.3340 | 0.1300 | 0.2327 | +1.0 | |
| Rb | 0.3620 | 0.1500 | 0.2655 | +1.0 | |
| Cs | 0.4130 | 0.0065 | 0.1954 | +1.0 | |
| F | 0.3700 | 1.0000 | −1.0 | ||
| Cl | 0.4400 | 0.4700 | −1.0 | ||
| Br | 0.4760 | 0.3000 | −1.0 | ||
| I | 0.535 | 0.2000 | −1.0 | ||
|
| |||||
| SPC/E | O | 0.3166 | 0.6506 | −0.8476 | |
| H | 0.0000 | 0.0000 | +0.4238 | ||
Results
The main goal for the force fields developed here is to reproduce, as far as possible, the experimental KBIs for aqueous salt solutions as a function of salt concentration. Hence, we present this comparison first. This is followed by a comparison of a series of additional properties of solution mixtures, not included in the original parameterization, which is presented in an effort to both fully characterize the models and to establish the range of applicability of the models. As the solutions involve a variety of highly polarizing ions the inherent many body interactions would be expected to vary substantially between different salts and also with concentration. Therefore, it should be obvious that it is essentially impossible to reproduce all the available experimental data using such a simple LJ 6–12 plus Coulomb model. Wherever possible we have attempted to highlight any disagreement with experiment and possible causes for these errors.
The experimental excess coordination numbers for sodium halides and alkali chlorides are displayed in Figure 1. The results presented in Figure 1 have been extracted from the experimental thermodynamic data on aqueous salt solutions and represent the primary target data for the current parameterization approach. The data display systematic trends between the different salts which provide information concerning the underlying molecular distributions. At low concentrations (< 0.1m) the distributions are dominated by the Debye-Hueckel behavior leading to positive values for the ion-ion excess coordination numbers (Ncc). This behavior reverses at higher salt concentrations and indicates, with the exception of NaF, an increase in ion solvation by water. Similar results have been observed in other studies.57,58
Table 2 shows the final Lennard-Jones parameters used in our simulations. The LJ parameters for Na+ and Cl− were taken from Weerasinghe and Smith.25 As the size of the cation increased the value of σ increased and that of ε essentially decreased. A similar trend is observed for the anions. Peng et al. have argued in favor of such trends in the LJ parameters, although the trend in ε parameters is opposite to that expected (decreasing with atomic number not increasing).6 Their work used a LJ 9–12 potential and hence the argument might not be so clear for the LJ 6–12 plus Coulomb models, or for systems with large polarization effects, where the ε parameter is linked to a scaling of the repulsive wall which resists the electrostatic attraction, rather than the usual relationship to dispersion interactions. The trend in the values of σ was also observed by both Joung and Cheatham4 and Horinek et al.17 However, any trend in the values of ε was absent from both these previous works.
Table 3 indicates the potential energy, density, and lattice constants obtained for the salt crystals studied in this work. The simulated crystal dimensions exhibit an average error of 3% with a maximum error of 10%. In the supporting data the lattice energies of the Kirkwood-Buff models are compared to the experimental data and the force fields developed by Peng et al.6 The KBFF models consistently overestimate the lattice energies. While reproducing the crystal lattice energies of salts was not a goal of the present parameterization, the results suggest that the current force fields may result in crystal lattices which are too stable with respect to the solution phase. This could be a concern for future simulations. However, a recent study of the KBFF model for NaCl indicates an approximate solubility of 7.9 m,59 compared to the experimental value of 6.1 m.60 The higher observed solubility suggests that, if anything, the opposite could be true. Some of these differences are probably related to the rather crude LJ 6–12 potential used in the current work which is known to fail for crystals.6 Our main aim in studying the salt crystal lattice properties was to guide the systematic development of anion and cation LJ σ parameters. Furthermore, the enthalpies of mixing appear to be well reproduced (see later) indicating good compatibility with the SPC/E water model. Hence, we have not considered any further attempts to significantly improve the current data.
Table 3.
Summary of the alkali halide crystal simulations using the final parameters. Symbols are: Epot, average total potential energy per molecule (Ns); ρ, mass density; and a, unit cell dimension. Subscript, sim and exp indicate simulation and experimental data,70 respectively.
| Epot (kJ/mol) | ρsim (g/cm3) | ρexp (g/cm3) | asim (nm) | aexp (nm) | |
|---|---|---|---|---|---|
| NaF | −1217.74 | 1.965 | 2.558 | 0.257 | 0.231 |
| NaCl | −808.24 | 2.108 | 2.163 | 0.285 | 0.281 |
| NaBr | −776.08 | 3.326 | 3.246 | 0.295 | 0.297 |
| NaI | −750.94 | 3.878 | 3.665 | 0.303 | 0.323 |
| LiCl | −1178.03 | 1.776 | 2.069 | 0.270 | 0.257 |
| KCl | −725.29 | 1.980 | 1.990 | 0.315 | 0.314 |
| RbCl | −692.73 | 2.800 | 2.859 | 0.325 | 0.327 |
| CsCl | −650.12 | 3.990 | 3.973 | 0.419 | 0.412 |
| KI | −663.23 | 3.406 | 3.125 | 0.343 | 0.353 |
| CsBr | −628.80 | 4.582 | 4.453 | 0.433 | 0.429 |
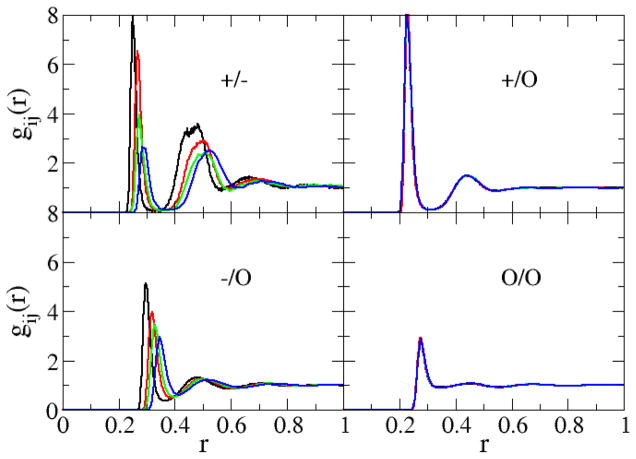
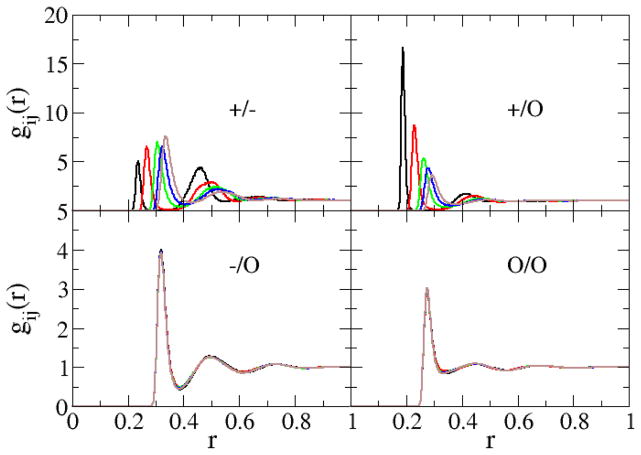
The radial distribution functions (rdfs) obtained from the 1 M salt simulations are displayed in Figure 2 for the sodium halides and in Figure 3 for the alkali metal chlorides. The sodium to halide anion-cation rdfs displayed a large first (ion pair) and a significant second (solvent separated ion pair) peak, which is in agreement with experiment.61 All rdfs approached unity beyond 1 nm. The first shell coordination numbers, nij, as well as the distances to the first rdf maximum (contact distance), Rmax, and the first rdf minimum (first solvation shell), Rmin, were calculated from the corresponding rdfs as a function of the solution molality and are presented in the supporting data. The final contact distances for Li+, Na+, K+, Rb+, Cs+, F−, Cl−, Br−, and I− were 0.19, 0.23, 0.26, 0.28, 0.29, 0.27, 0.32, 0.33 and 0.35 nm, respectively. As expected, the radius of the first hydration shell increased as the size of the cation and anion increased. The simulated contact distances agree with the experimental values of 0.20, 0.24, 0.28, 0.29, 0.31, 0.26, 0.32, 0.34, and 0.36,62 respectively, to within a 0.01 nm root mean square (rms) deviation - a similar deviation to that exhibited by the force field of Joung and Cheatham.4 The first water shell coordination numbers of Na+, K+, Rb+, and Cs+ in ≈ 4 M aqueous solutions were determined to be 4.9, 5.9, 6.2, and 6.4 respectively. As expected, and similar to the trend in the radii of the first hydration shell, the hydration numbers increase as the size of the cation increases. The predicted hydration numbers agree with those determined from X-ray and neutron scattering data under the same conditions61 - 4.9, 5.3, 6.9, and 7.5, respectively - to within a 0.2 rms deviation. The supporting data also indicate that the coordination numbers are not only sensitive to the size of the alkali metal ion, but also to changes in the salt concentration. The degree of ion pairing increases with increasing concentration. We note that no aggregation or crystallization was observed during any of the simulations.
Figure 2.
Radial distribution functions obtained from simulations of 1 m sodium salt solutions containing NaF (black lines), NaCl (red lines), NaBr (green lines), and NaI (blue lines). Cations, anions, and the water oxygen are denoted by the symbols +, −, and o, respectively.
Figure 3.
Radial distribution functions obtained from simulations of 1 m chloride salt solutions containing LiCl (black lines), NaCl (red lines), KCl (green lines), RbCl (blue lines), and CsCl (brown lines). Cations, anions, and the water oxygen are denoted by the symbols +, −, and o, respectively.
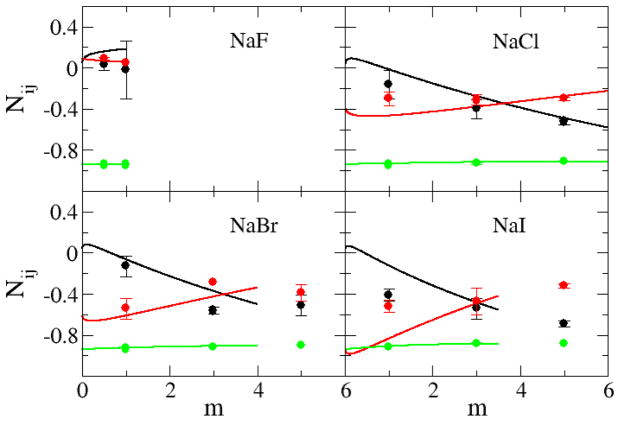
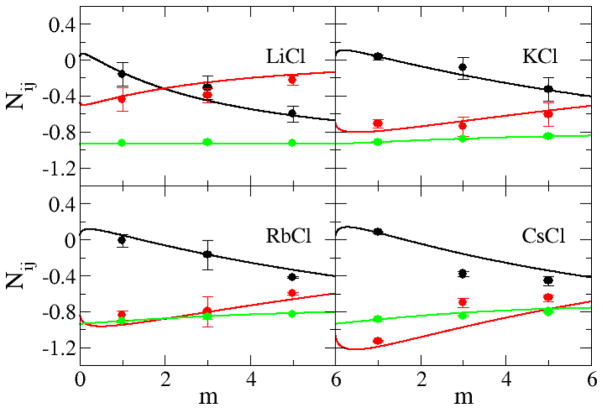
The simulated and experimental excess coordination numbers, Nij, are shown in Figure 4 for the sodium halides, and in Figure 5 for the alkali metal chlorides, as a function of salt molality. The KBFF models quantitatively reproduce the experimental data, although the simulated values were somewhat less accurate for NaI and CsCl solutions. The correct trends (with salt concentration) are reproduced for all salts. The ion-ion excess coordination numbers (black lines) did not vary significantly from salt to salt when compared to the variation in the ion-water excess coordination numbers (red lines), which is in agreement with the experimental data (see Figure 1). This suggests that changes to the ion-water and water-water distributions determine the solution behavior to a large extent. However, it is very difficult to clearly relate these composition dependent changes to the force field parameters used here. The relatively poor agreement for the NaI and CsCl solutions probably arises due to the high polarizability of the anion and cations, respectively, which would make the development of parameters suitable for both crystals and aqueous solutions quite challenging.
Figure 4.
Excess coordination numbers as a function of salt molality. The Ncc (black lines), Ncw (red lines), and Nww (green lines) are obtained from a KB analysis of the experimental data. The Ncc (black dots), Ncw (red dots), and Nww (green dots) are obtained from simulations performed with the KBFF models.
Figure 5.
Excess coordination numbers as a function of salt molality. The Ncc (black lines), Ncw (red lines), and Nww (green lines) are obtained from a KB analysis of the experimental data. The Ncc (black dots), Ncw (red dots), and Nww (green dots) are obtained from simulations performed with the KBFF models.
In Figure 6 and Figure 7 the simulated activity derivatives (acc) as a function of molality are compared to the experimental values.38 The KBFF model reproduced the correct increase in acc with concentration at higher salt concentrations as indicated by the experimental data. We note that acc plays an important role for solutions as it characterizes the change in activity (chemical potential) of the salt with concentration.31 Hence, accurate force fields are required to reproduce this data.25 An expression for the molar activity coefficient (yc = y±) provided by the current force fields was obtained by taking appropriate derivatives of the fitting equations adopted for the experimental data (Equation 4), and then obtaining parameters that best fit the simulated activity derivatives. The final fitting parameters are provided in the supplementary data for most of the salt solutions studied here. It should be noted that many common force fields do not correctly reproduce the experimental excess coordination numbers and activity derivatives.20,22,23,25 For instance, in our previous work we simulated 2m NaCl solutions using a variety of salt force fields.25 Many force fields provided values of acc < 0.5. Large deviations from experiment are also observed for other solutes.20,34,63 Hence, the data provided in Figure 6 and 7 for the present models, while not perfect, can be considered to be in good agreement with experiment relative to typical results for similar force fields.
Figure 6.
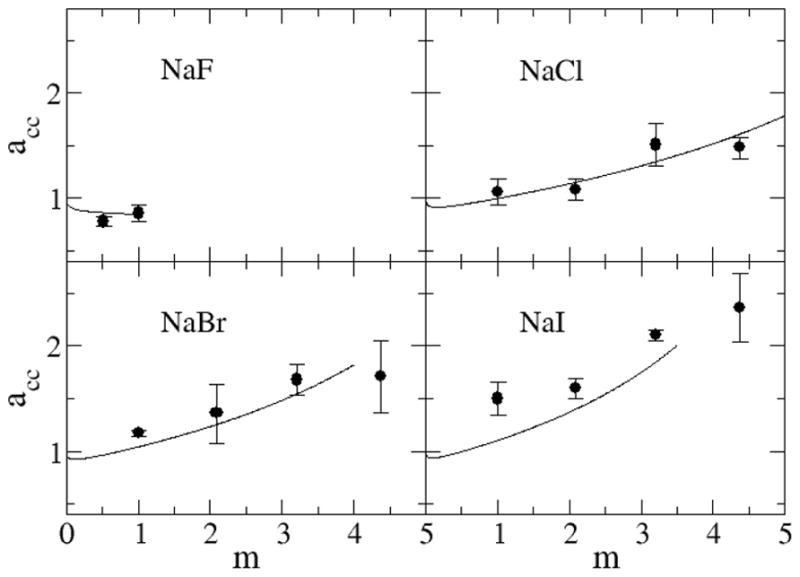
Activity derivatives for sodium salts as a function of salt molality. Lines are obtained from a KB analysis of the experimental data, while symbols correspond to the results obtained with the KBFF models.
Figure 7.
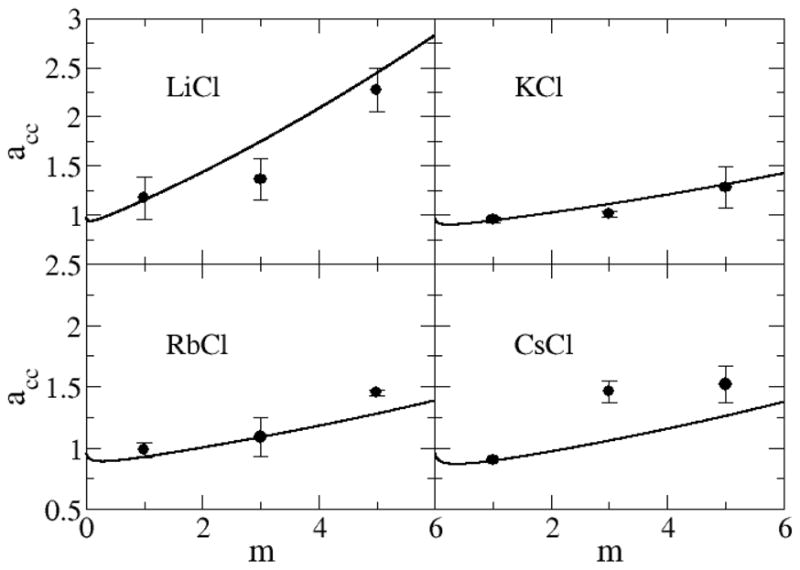
Activity derivatives for chloride salts as a function of salt molality. Lines are obtained from a KB analysis of the experimental data, while symbols correspond to the results obtained with the KBFF models.
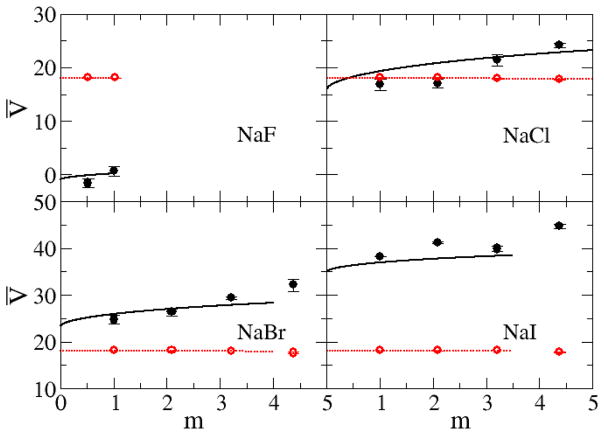
Figure 8 and Figure 9 show the experimental and simulated partial molar volumes of both the water and salt as a function of concentration. The experimental partial molar volumes of the salts generally increase monotonically, while that of water slightly decreases monotonically, as the salt concentration increases. The same trends were exhibited by the simulated values. Also, as expected, the partial molar volume of the salt increases as the size of the ions increases. The KBFF models reproduce the experimental data quantitatively except for LiCl for which the salt partial molar volume is too large, presumably due to an overestimation of the cation size. This is also consistent with the low simulated crystal density. However, it was not possible to develop parameters using a smaller σ parameter for Lithium, and still reproduce the experimentally observed cation to water oxygen contact distance. Hence, we chose to correctly model this latter data.
Figure 8.
Partial molar volumes (cm3/mol) for sodium salts as a function of salt molality. Lines are obtained from a KB analysis of the experimental data, while symbols correspond to the results obtained with the KBFF models. The partial molar volume of the salt is displayed in black with the partial molar volume of water displayed in red.
Figure 9.
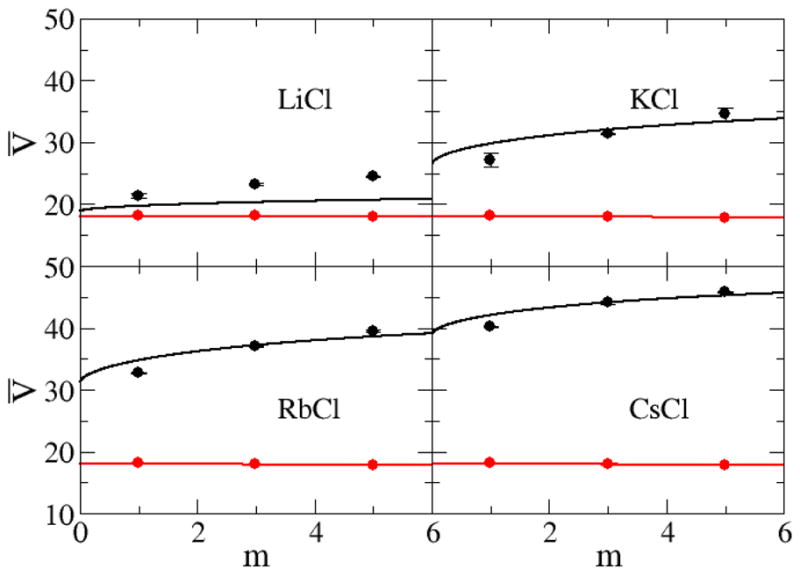
Partial molar volumes (cm3/mol) for chloride salts as a function of salt molality. Lines are obtained from a KB analysis of the experimental data, while symbols correspond to the results obtained with the KBFF models. The partial molar volume of the salt is displayed in black with the partial molar volume of water displayed in red.
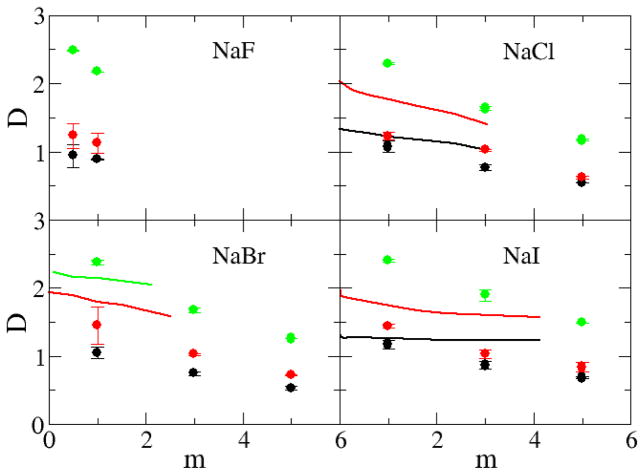
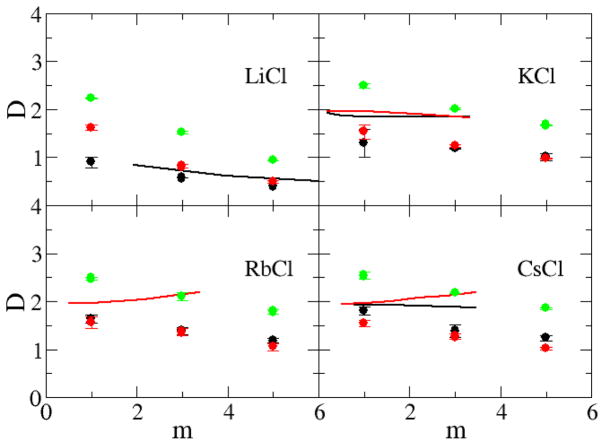
The current models reproduce the excess coordination numbers, and therefore chemical potential derivatives and partial molar volumes, of a variety of salt solutions as a function of concentration. This is the primarily goal for the KBFF models. However, it is important to test the models and their ability to reproduce other properties of salt solutions not included in the initial parameterization process, especially to see if they display significant deviations from experiment, and to fully characterize the models in order to develop the exact range of properties for which the models will provide reliable results. The self-diffusion constants, calculated using the mean square fluctuation approach,51 are displayed in Figure 10 and Figure 11 as a function of alkali halide molality. The majority of the water, cation and anion experimental diffusion constants all exhibit an essentially linear decrease with increasing salt molality. The notable exceptions are the diffusion constants for the chloride ion in RbCl and CsCl solutions. All the simulated diffusion constants decreased with salt concentration, but typically displayed a stronger concentration dependence compared to experiment. The self-diffusion constants of alkali metal cations increase with size even though the mass of the ions increases, confirming that the solvation of the cation is the most important factor for the diffusion constant.64 In contrast, the self-diffusion constants of halide ions do not display any apparent correlation with the size of the ion. We note, however, that it is difficult to obtain quantitative agreement with the experimental data for most solutions as even the diffusion constant of water varies considerably between water models and can be a factor of two too large.65 The agreement with experiment can be improved somewhat by correcting for finite size effects,66 not included here, which typically result in larger (5–10%) diffusion coefficients. However, the simulated results would still appear to be more sensitive to changes in concentration compared to experiment. It is unclear at present why this is the case. Comparison with diffusion data obtained for other models suggests the present models are reasonably competitive.18
Figure 10.
Diffusion constants (×10−9 m2/s) for sodium salts as a function of salt molality. The D+ (black lines), D− (red lines), and Dw (green lines) represent the experimental diffusion constant data,71–74 while the D+ (black dots), D− (red dots), and Dw (green dots) were obtained from simulations using the KBFF models.
Figure 11.
Diffusion constants (×10−9 m2/s) for chloride salts as a function of salt molality. The D+ (black lines), D− (red lines), and Dw (green lines) represent the experimental diffusion constant data,75 while the D+ (black dots), D− (red dots), and Dw (green dots) were obtained from simulations using the KBFF models.
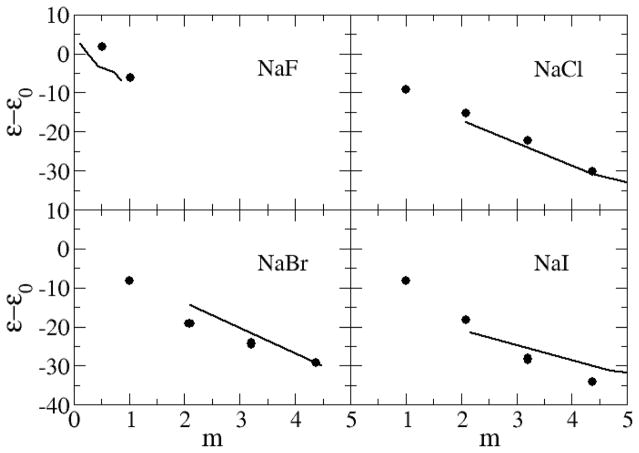
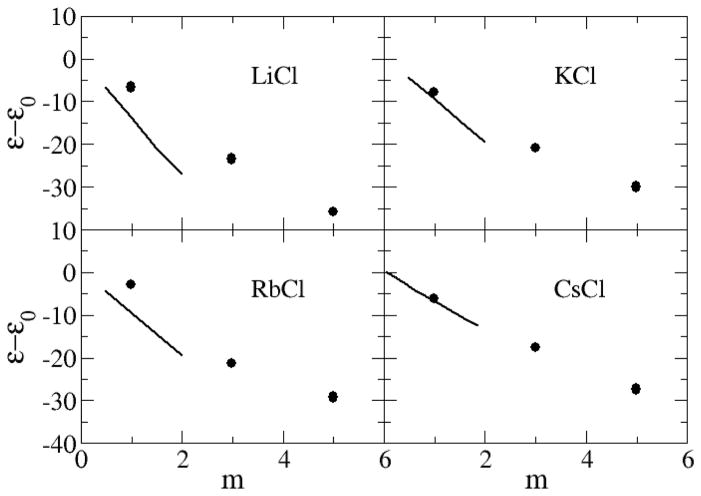
The dielectric decrements (ε − ε0) of alkali halides salts solutions, calculated from the dipole moment fluctuations,53 are displayed in Figure 12 and Figure 13. Here, ε is the relative permittivity of the solution and ε0 is the relative permittivity of pure water. The value of ε0 = 63 obtained for pure water using the SPC/E model67 is low compared to the experimental value of 78.68 Hence, quantitative agreement for the absolute permittivities is not possible with this water model. The experimental relative permittivity for all salt solutions decreases as a function of molality and this trend is clearly reproduced by the current models. The only exception appears to be NaF solutions at low concentrations where a small increase is observed. This increase was also reproduced in the present simulations. The KBFF models reproduce the experimental decrement data well, with the possible exception of LiCl solutions, compared to the simulated uncertainty of ±5.
Figure 12.
Dielectric decrements (ε − ε0) for a series of sodium salts as a function of salt molality. Lines were obtained from the experimental dielectric constant data,76–78 while the symbols correspond to data obtained from simulations using the KBFF models.
Figure 13.
Dielectric decrements (ε − ε0) for a series of chloride salts as a function of salt molality. Lines were obtained from the experimental dielectric constant data,76–78 while the symbols correspond to data obtained from simulations using the KBFF models.
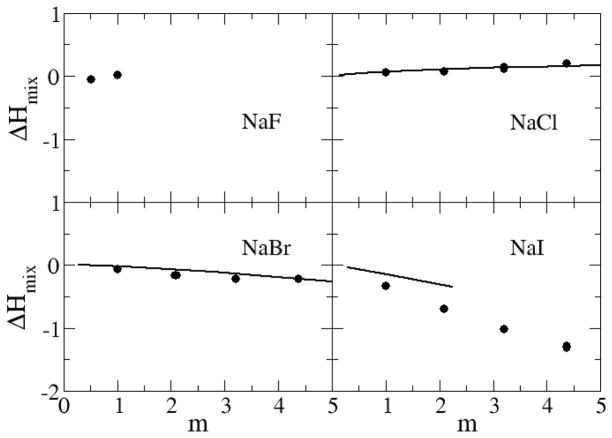
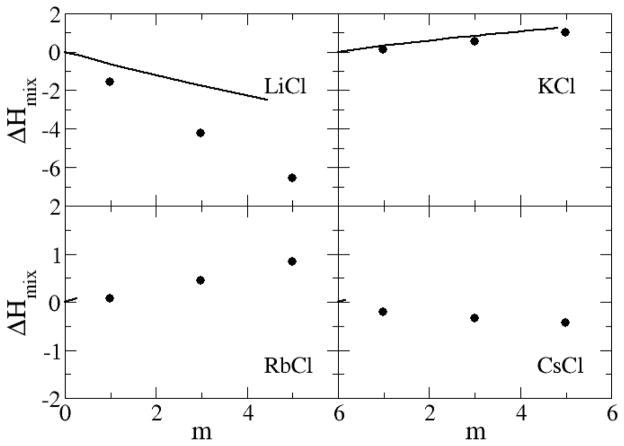
The excess enthalpies of mixing for the sodium halides as a function of salt molality are displayed in Figure 14 and Figure 15. The excess enthalpy of mixing for each sodium halide solution is calculated by the difference between the molar potential energy in the solution phase and in the crystal and pure water phases.54 The data indicate that the models reproduce the experimental mixing enthalpies in a quantitative manner for NaCl, NaBr and KCl, while the results for NaI and LiCl are somewhat too favorable. The simulated data for alkali chlorides become increasingly more unfavorable on moving from Li+ to Rb+, but then change sign for CsCl solutions. We presume this is due to a change in crystal structure from FCC to BCC for CsCl. It should be noted that reasonable agreement for both the free energy and enthalpy of mixing must therefore indicate good estimates for the entropy of mixing (data not shown).
Figure 14.
Excess enthalpy of mixing (kJ/mol) for sodium salts as a function of salt molality. Lines correspond to experimental data,79 while symbols were obtained from simulations using the KBFF models.
Figure 15.
Excess enthalpy of mixing (kJ/mol) for chloride salts as a function of salt molality. Lines correspond to experimental data,79 while symbols were obtained from simulations using the KBFF models.
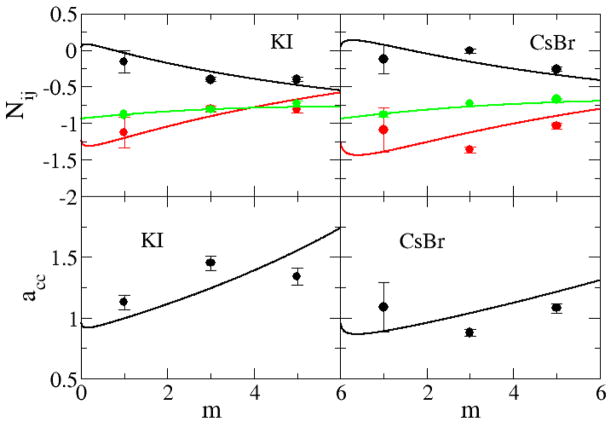
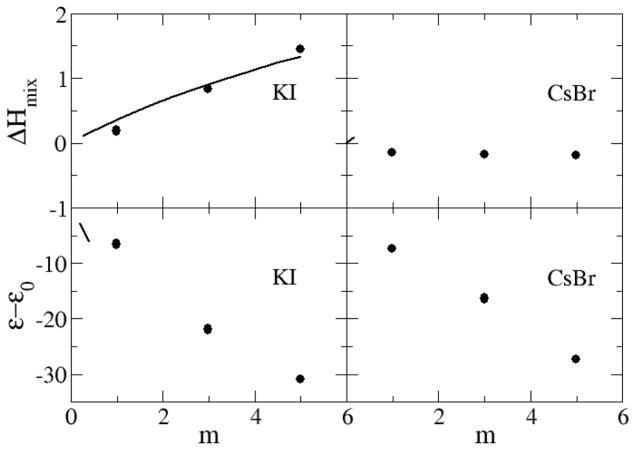
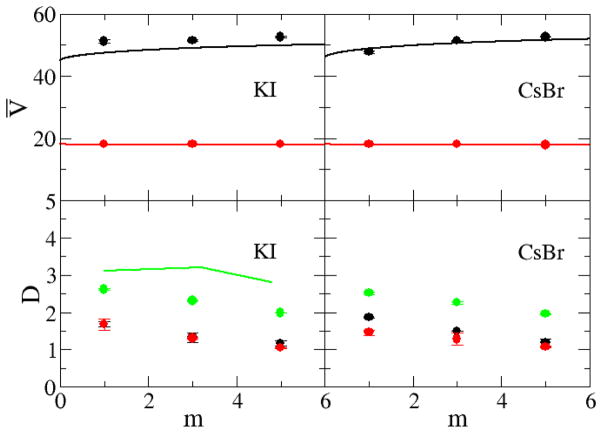
In the previous sections we have developed parameters for a series of sodium halides and alkali metal chlorides by using Kirkwood-Buff theory as a guide. In order to demonstrate the transferability of the parameters to a variety of alkali halides we have used the same ion parameters to study two other systems, aqueous KI and aqueous CsBr, which were not included in the previous parameterization and for which there are no longer any free parameters. The results are presented in Figure 16–18 and clearly suggest that, to a high degree of accuracy, the parameters developed here for the sodium and chloride salts are transferable to other alkali halide salts.
Figure 16.
Excess coordination numbers as a function of salt molality (top): The Ncc (black lines), Ncw (red lines), and Nww (green lines) are obtained from a KB analysis of the experimental data. The Ncc (black dots), Ncw (red dots), and Nww (green dots) are obtained from simulations. Activity derivatives as a function of salt molality (bottom): Lines are obtained from a KB analysis of the experimental data, while symbols correspond to results obtained using the KBFF models.
Figure 18.
Excess enthalpy of mixing (kJ/mol) as a function of salt molality (top), and dielectric decrements as a function of salt molality (bottom): Lines correspond to the experimental data,79 while symbols were obtained from simulations using the KBFF models.
Conclusions
A series of models for aqueous alkali halide solutions have been developed by attempting to reproduce the experimentally derived Kirkwood-Buff integrals using molecular dynamics simulation. A major advantage of this type of approach is the ability to provide insight into salt activities in a computationally efficient manner, and to ensure a reasonably accurate balance between solute-solute (Ncc) and solute-solvent (Ncw) distributions and, by inference, their interactions. Other physical and thermodynamic properties such as ion diffusion constants, relative permittivity, density, and heat of mixing have also been reasonably well reproduced. In addition, by examining the results obtained for aqueous KI and CsBr solutions, it has been clearly demonstrated that the parameters developed for sodium and chloride salts are transferable to other alkali halide salts. Unfortunately, not all the models provide good agreement for all the experimental data. To some degree this is expected when using such simple models. The major issues involved the most highly polarizing ions (Li+ an F−). While the diffusion constant data also provided only modest agreement with experiment. Hence, care should be taken when using the current models for these types of applications. The models are specifically designed to be used with the SPC/E water model although, according to previous studies,25,69 other simple point charge models should provide similar results. The resent models contribute to a consistent set of parameters that can eventually be used to study salt effects on peptides and proteins.
The solutions studied in this work include a variety of polarizable and polarizing anions and cations over a range of compositions. It is encouraging that one can reproduce much of the experimental data with the simple nonpolarizable models used here. However, to achieve this goal it was necessary to break the standard combination rules when determining the cation-water interactions. The modified ε parameters actually lead to an increase in the cation-water interaction and can be thought of, to some degree, as a crude approach to incorporate polarization effects, which undoubtedly play a significant role in these solutions.
The present models provide an alternative to other recent ion force fields developed using more traditional approaches - such as the free energy of hydration. We have argued that the use of the experimental KBIs provides a rigorous test of force field accuracy and thereby provides ideal target data for the parameterization.31 Furthermore, this can be achieved without a significant sacrifice in agreement with other solution properties. Whether the current models are substantially better than other, more traditional, models remains to be seen. This issue requires a more thorough and comprehensive study than is feasible here. The present models should be viewed as providing a reasonable balance between solute-solute, solute-solvent and solvent-solvent interactions, as inferred by their resulting distributions, and are therefore suitable for studies of solute activities and cosolvent interactions with biomolecules.30,63 Of course, one should always test that any potential model reasonably reproduces any specific properties of interest before use.
Supplementary Material
Figure 17.
Partial molar volumes (cm3/mol) as a function of salt molality (top): Lines are obtained from a KB analysis of the experimental data, while symbols correspond to results obtained using the KBFF models. The black lines and symbols represent the partial molar volume of the salt, while red lines and symbols indicate partial molar volume of water. Diffusion constants (×10−9 m2/s) as a function of salt molality (bottom): The D+ (black lines), D− (red lines), and Dw (green lines) are obtained from experimental diffusion constant data,80 while the D+ (black ●), D− (red ○), and Dw (green x) were obtained from simulations performed using the KBFF models.
Acknowledgments
The project described was supported by Grant Number R01GM079277 from the National Institute of General Medical Sciences. The content is solely the responsibility of the authors and does not necessarily represent the official views of the National Institute of General Medical Sciences or the National Institutes of Health.
Footnotes
Supporting information is provided which includes tables containing a summary of all the simulations performed in this study, first shell coordination numbers, fitting constants for both the experimental and simulated activity data (Equation 4), and a comparison of the present lattice energies with experimental and other simulation data. Additional figures are provided illustrating the rdfs as a function of composition. This information is available free of charge via the Internet at http://pubs.acs.org/.
References
- 1.Mclaughlin S. Annu Rev Biophys Bio. 1989;18:113–136. doi: 10.1146/annurev.bb.18.060189.000553. [DOI] [PubMed] [Google Scholar]
- 2.Anderson CF, Record MT. Annu Rev Phys Chem. 1995;46:657–700. doi: 10.1146/annurev.pc.46.100195.003301. [DOI] [PubMed] [Google Scholar]
- 3.Baldwin RL. Biophys J. 1996;71:2056–2063. doi: 10.1016/S0006-3495(96)79404-3. [DOI] [PMC free article] [PubMed] [Google Scholar]
- 4.Joung IS, Cheatham TE. J Phys Chem B. 2008;112:9020–9041. doi: 10.1021/jp8001614. [DOI] [PMC free article] [PubMed] [Google Scholar]
- 5.Aqvist J. J Phys Chem. 1990;94:8021–8024. [Google Scholar]
- 6.Peng ZW, Ewig CS, Hwang MJ, Waldman M, Hagler AT. J Phys Chem A. 1997;101:7243–7252. [Google Scholar]
- 7.Rasaiah JC. J Chem Phys. 1970;52:704–715. [Google Scholar]
- 8.Lee SH, Rasaiah JC. J Chem Phys. 1994;101:6964–6974. [Google Scholar]
- 9.Du H, Rasaiah JC, Miller JD. J Phys Chem B. 2007;111:209–217. doi: 10.1021/jp064659o. [DOI] [PubMed] [Google Scholar]
- 10.Lamoureux G, Roux B. J Phys Chem B. 2006;110:3308–3322. doi: 10.1021/jp056043p. [DOI] [PubMed] [Google Scholar]
- 11.Jensen KP, Jorgensen WL. J Chem Theory Comput. 2006;2:1499–1509. doi: 10.1021/ct600252r. [DOI] [PubMed] [Google Scholar]
- 12.Chen AA, Pappu RV. J Phys Chem B. 2007;111:11884–11887. doi: 10.1021/jp0765392. [DOI] [PubMed] [Google Scholar]
- 13.Auffinger P, Cheatham TE, Vaiana AC. J Chem Theory Comput. 2007;3:1851–1859. doi: 10.1021/ct700143s. [DOI] [PubMed] [Google Scholar]
- 14.Smith DE, Dang LX. J Chem Phys. 1994;100:3757–3766. [Google Scholar]
- 15.Dang LX. J Chem Phys. 1992;96:6970–6977. [Google Scholar]
- 16.Dang LX, Garrett BC. J Chem Phys. 1993;99:2972–2977. [Google Scholar]
- 17.Horinek D, Mamatkulov SI, Netz RR. J Chem Phys. 2009;130:124507. doi: 10.1063/1.3081142. [DOI] [PubMed] [Google Scholar]
- 18.Joung IS, Cheatham TE. J Phys Chem B. 2009;113:13279–13290. doi: 10.1021/jp902584c. [DOI] [PMC free article] [PubMed] [Google Scholar]
- 19.Bentenitis N, Cox NR, Smith PE. J Phys Chem B. 2009;113:12306–12315. doi: 10.1021/jp904806f. [DOI] [PMC free article] [PubMed] [Google Scholar]
- 20.Kang M, Smith PE. J Comput Chem. 2006;27:1477–1485. doi: 10.1002/jcc.20441. [DOI] [PubMed] [Google Scholar]
- 21.Weerasinghe S, Smith PE. J Phys Chem B. 2005;109:15080–15086. doi: 10.1021/jp051773i. [DOI] [PubMed] [Google Scholar]
- 22.Weerasinghe S, Smith PE. J Chem Phys. 2004;121:2180–2186. doi: 10.1063/1.1768938. [DOI] [PubMed] [Google Scholar]
- 23.Weerasinghe S, Smith PE. J Chem Phys. 2003;118:10663–10670. [Google Scholar]
- 24.Weerasinghe S, Smith PE. J Phys Chem B. 2003;107:3891–3898. [Google Scholar]
- 25.Weerasinghe S, Smith PE. J Chem Phys. 2003;119:11342–11349. [Google Scholar]
- 26.Chitra R, Smith PE. J Phys Chem B. 2002;106:1491–1500. [Google Scholar]
- 27.Smith PE. J Chem Phys. 2008;129:124509. doi: 10.1063/1.2982171. [DOI] [PMC free article] [PubMed] [Google Scholar]
- 28.Ben-Naim A. J Chem Phys. 1977;67:4884–4890. [Google Scholar]
- 29.Ben-Naim A. Statistical Thermodynamics for Chemists and Biochemists. Plenum Press; New York: 1992. [Google Scholar]
- 30.Pierce V, Kang M, Aburi M, Weerasinghe S, Smith PE. Cell Biochem Biophys. 2008;50:1–22. doi: 10.1007/s12013-007-9005-0. [DOI] [PMC free article] [PubMed] [Google Scholar]
- 31.Weerasinghe S, Gee MB, Kang M, Bentenitis N, Smith PE. In: Modeling Solvent Environments. Feig M, editor. Wiley-VCH; Weinheim: 2010. [Google Scholar]
- 32.Matteoli E, Lepori L. J Chem Phys. 1984;80:2856–2863. [Google Scholar]
- 33.Ploetz EA, Bentenitis N, Smith PE. Fluid Phase Equilib. 2010;290:43–47. doi: 10.1016/j.fluid.2009.11.023. [DOI] [PMC free article] [PubMed] [Google Scholar]
- 34.Chitra R, Smith PE. J Chem Phys. 2001;115:5521–5530. [Google Scholar]
- 35.Hess B, van der Vegt NFA. Proc Natl Acad Sci USA. 2009;106:13296–13300. doi: 10.1073/pnas.0902904106. [DOI] [PMC free article] [PubMed] [Google Scholar]
- 36.Klasczyk B, Knecht V. J Chem Phys. 2010;132:024109. doi: 10.1063/1.3273903. [DOI] [PubMed] [Google Scholar]
- 37.Ben-Naim A. Molecular Theory of solutions. Oxford University Press; New York: 2006. [Google Scholar]
- 38.Robinson RA, Stokes RH. Electrolyte Solutions. 2. Butterworths; London: 1959. [Google Scholar]
- 39.Rosgen J, Pettitt BM, Perkyns J, Bolen DW. J Phys Chem B. 2004;108:2048–2055. [Google Scholar]
- 40.Sohnel O, Novotny P. Densities of Aqueous Solutions of Inorganic Substances. Amsterdam - Oxford - New York - Tokyo: 1985. [Google Scholar]
- 41.Kirkwood JG, Buff FP. J Chem Phys. 1951;19:774–777. [Google Scholar]
- 42.Fine RA, Millero FJ. J Chem Phys. 1973;59:5529–5536. [Google Scholar]
- 43.Kusalik PG, Patey GN. J Chem Phys. 1987;86:5110–5116. [Google Scholar]
- 44.Berendsen HJC, Grigera JR, Straatsma TP. J Phys Chem. 1987;91:6269–6271. [Google Scholar]
- 45.Van der Spoel D, Lindahl E, Hess B, Groenhof G, Mark AE, Berendsen HJC. J Comput Chem. 2005;26:1701–1718. doi: 10.1002/jcc.20291. [DOI] [PubMed] [Google Scholar]
- 46.Lindahl E, Hess B, van der Spoel D. J Mol Model. 2001;7:306–317. [Google Scholar]
- 47.Ryckaert JP, Ciccotti G, Berendsen HJC. J Comput Phys. 1977;23:327–341. [Google Scholar]
- 48.Berendsen HJC, Postma JPM, van Gunsteren WF, Dinola A, Haak JR. J Chem Phys. 1984;81:3684–3690. [Google Scholar]
- 49.Darden T, York D, Pedersen L. J Chem Phys. 1993;98:10089–10092. [Google Scholar]
- 50.Chandrasekhar S. Rev Mod Phys. 1943;15:1–89. [Google Scholar]
- 51.Chitra R, Smith PE. J Phys Chem B. 2000;104:5854–5864. [Google Scholar]
- 52.Allen MP, Tildesley DJ. Computer Simulation of Liquids. Oxford University Press; Oxford: 1987. [Google Scholar]
- 53.Smith PE, van Gunsteren WF. J Chem Phys. 1994;100:577–585. [Google Scholar]
- 54.Walser R, Mark AE, van Gunsteren WF, Lauterbach M, Wipff G. J Chem Phys. 2000;112:10450–10459. [Google Scholar]
- 55.Chitra R, Smith PE. J Chem Phys. 2001;114:426–435. [Google Scholar]
- 56.Kokubo H, Rosgen J, Bolen DW, Pettitt BM. Biophys J. 2007;93:3392–3407. doi: 10.1529/biophysj.107.114181. [DOI] [PMC free article] [PubMed] [Google Scholar]
- 57.Newman KE. Chem Soc Rev. 1994;23:31–40. [Google Scholar]
- 58.Shimizu S, Boon CL. J Chem Phys. 2004;121:9147–9155. doi: 10.1063/1.1806402. [DOI] [PubMed] [Google Scholar]
- 59.Smith PE. Fluid Phase Equilib. 2010;290:36–42. doi: 10.1016/j.fluid.2009.08.006. [DOI] [PMC free article] [PubMed] [Google Scholar]
- 60.Weast RC. CRC Handbook of Chemistry and Physics. 66. CRC Press, Inc; Boca Raton, Florida: 1985. [Google Scholar]
- 61.Ansell S, Barnes AC, Mason PE, Neilson GW, Ramos S. Biophys Chem. 2006;124:171–179. doi: 10.1016/j.bpc.2006.04.018. [DOI] [PubMed] [Google Scholar]
- 62.Marcus Y. Chem Rev. 1988;88:1475–1498. [Google Scholar]
- 63.Kang M, Smith PE. Fluid Phase Equilib. 2007;256:14–19. [Google Scholar]
- 64.Atkins PW, De Paula J. Physical Chemistry. 7. W.H. Freeman; New York: 2002. [Google Scholar]
- 65.Mark P, Nilsson L. J Phys Chem A. 2001;105:9954–9960. [Google Scholar]
- 66.Yeh IC, Hummer G. J Phys Chem B. 2004;108:15873–15879. [Google Scholar]
- 67.Smith PE, van Gunsteren WF. J Chem Phys. 1994;100:3169–3174. [Google Scholar]
- 68.Heger K, Uematsu M, Franck EU. Berich Bunsen Phys Chem. 1980;84:758–762. [Google Scholar]
- 69.Patra M, Karttunen M. J Comput Chem. 2004;25:678–689. doi: 10.1002/jcc.10417. [DOI] [PubMed] [Google Scholar]
- 70.Davey WP. Phys Rev. 1923;21:143–161. [Google Scholar]
- 71.Wang JH, Kennedy JW. J Am Chem Soc. 1950;72:2080–2083. [Google Scholar]
- 72.Nelson F, Marcinkowsky AE, Kraus KA. Research and development progress report/office of saline water. 302. 1968. [Google Scholar]
- 73.Tyrrell HJV, Harris KR. Diffusion in Liquids. Butterworths; London: 1984. [Google Scholar]
- 74.Easteal AJ, Woolf LA. J Phys Chem. 1986;90:2441–2445. [Google Scholar]
- 75.Kumamoto E, Kimizuka H. Bull Chem Soc Jpn. 1979;52:2145–2146. [Google Scholar]
- 76.Haggis GH, Hasted JB, Buchanan TJ. J Chem Phys. 1952;20:1452–1465. [Google Scholar]
- 77.Harris FE, Okonski CT. J Phys Chem. 1957;61:310–319. [Google Scholar]
- 78.Buchner R, Hefter GT, May PM. J Phys Chem A. 1999;103:1–9. [Google Scholar]
- 79.Beggerow G. Landolt-Boernstein. Vol. 2 Springer-Verlag; Berlin: 1976. [Google Scholar]
- 80.Matyash IV, Toryanik AI, Yashkichev VI. Zh Strukt Khim. 1964;5:777–778. [Google Scholar]
Associated Data
This section collects any data citations, data availability statements, or supplementary materials included in this article.


