Abstract
ABI’s SOLiD system1 is a commonly used massively parallel DNA sequencing platform for applications including genotyping and structural variation analysis1 to transcriptome quantification and reconstruction2. Like other sequencing technologies, it measures fluorescence intensities from dye-labeled molecules to determine the sequence of DNA fragments. Ultimately, sequences are determined by complicated statistical manipulations of noisy intensity measurements but systematic biases may mislead downstream analysis3. A number of proposed methods improve base-calling and quality metrics for other sequencing technologies3-5 and we now present Rsolid, software implementing an intensity normalization strategy for the SOLiD platform that substantially improves yield and accuracy at small computational costs (7% increase in total matches, 13% in perfect matches, 5% reduced error rate, and substantial reduction in false-positive SNP calls).
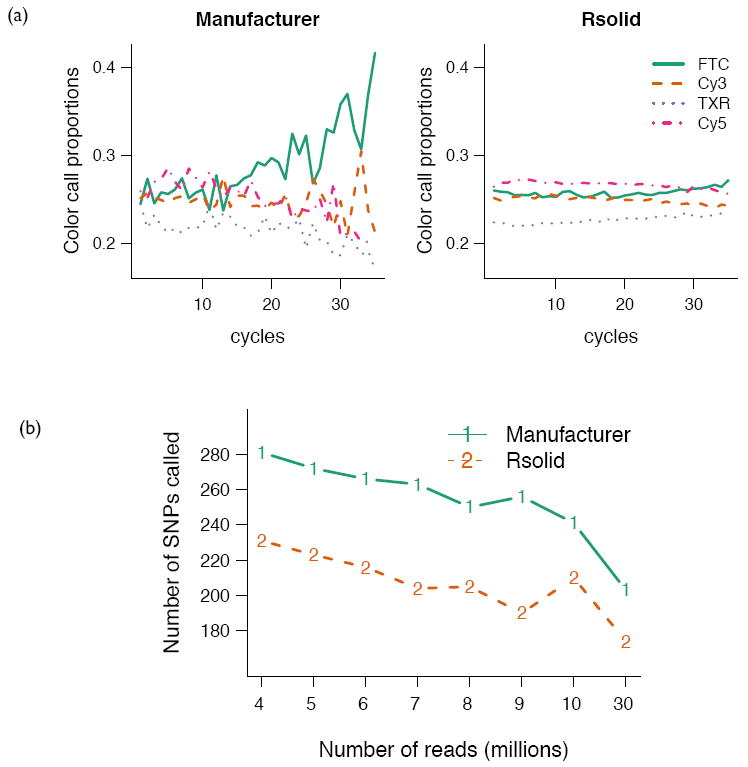
In the SOLiD system, the proportions of color-calls across sequencing cycles are extremely variable (Fig. 1a), even though they should be equal across sequencing cycles and proportional to the dinucleotide content of the library (Supplementary Methods). This bias can be traced to the fluorescence intensity measurements used to make the color-calls (Supplementary Fig. 1). The distributions of intensities are similar across channels in early sequencing cycles but a color-bias starts to appear in later cycles. The Rsolid method uses a simple and computationally efficient procedure to normalize the color-channel intensity distributions while taking into account dinucleotide frequencies (Supplementary Methods). This ensures that the intensity distributions across channels are comparable in later cycles, as they are in earlier cycles (Supplementary Fig. 1), removing a substantial amount of the color-call bias seen in later cycles (Fig. 1a).
Figure 1. Effect of normalization on color proportions and SNP calling.

(a) Color proportions in sample of E. coli genomic DNA on each sequencing cycle. Color calls as reported by the SOLiD 2 system (left panel), and after normalization by Rsolid (right panel), (b) Number of false-positive SNPs called in E. coli as coverage increases. Observe that after normalization fewer SNPs are called even at high coverage (30 M reads corresponds to ~100x coverage).
We report results on E. coli and H. sapiens genomic DNA samples, processed by independent laboratories and machines. Mapping and accuracy statistics before and after normalization (Table 1 and Supplementary Tables 1-4) reveal a substantial improvement. We observed a 2-6% reduction in the rate of valid adjacent color errors, which is particularly important since SOLiD’s two-base encoding is not able to correct for this type of error. This manifests as a substantial reduction in the number of false-positive SNP calls made (Fig. 1b).
Table 1.
Improvement in accuracy and mapping provided by normalization. These samples were processed on two different labs, with independent library preparations and sequencing machines.
| Metric | E. coli | H. sapiens |
|---|---|---|
| Total mapped reads | +6.35% | +4.43% |
| Perfectly mapped reads | +12.97% | +7.21% |
| Uniquely mapped reads | +6.37% | +7.24% |
| Overall errors per mapped read | -4.92% | -1.82% |
| Valid adjacent errors per mapped read | -6.42% | -2.20% |
The recently released SOLiD 3plus system, using smaller beads, produces as much as 10 times more intensity data. Data from this new system has similar statistical properties (data not shown) and our normalization algorithm scales as expected (Supplementary Methods). While increased yield is less of a concern with the new system, the need for accurate color-calls are still of paramount importance in applications such as genotyping, bisulfite sequencing and assembly, where single base-resolution data is required. There is still a need for accurate color calls to avoid false positive variant calls even at high coverage (Fig. 1b). Rsolid is publically available from http://rafalab.jhsph.edu/ Rsolid and runs on the R computing environment making it straightforward to include in existing data pipelines.
Supplementary Material
References
- 1.McKernan KJ, et al. Genome Res. 2009;19:1527–1541. doi: 10.1101/gr.091868.109. [DOI] [PMC free article] [PubMed] [Google Scholar]
- 2.Tang F, et al. Nat Methods. 2009;6(5):377–382. doi: 10.1038/nmeth.1315. [DOI] [PubMed] [Google Scholar]
- 3.Bravo HC, Irizarry RA. Biometrics. 2009 doi: 10.1111/j.1541-0420.2009.01353.x. epub ahead of print. [DOI] [PMC free article] [PubMed] [Google Scholar]
- 4.Quinlan AR, Stewart DA, Stromberg MP, Marth G. Nat Methods. 2008;5(2):179–181. doi: 10.1038/nmeth.1172. [DOI] [PubMed] [Google Scholar]
- 5.Kao WC, Stevens K, Song YS. Genome Res. 2009;19(10):1884–1895. doi: 10.1101/gr.095299.109. [DOI] [PMC free article] [PubMed] [Google Scholar]
- 6.Hayden EC. Nature. 2008;451(7177):378–379. doi: 10.1038/451378b. [DOI] [PubMed] [Google Scholar]
Associated Data
This section collects any data citations, data availability statements, or supplementary materials included in this article.


