Abstract
Rationale
Purkinje cells (Pcell) are characterized by different electrophysiologic properties and Ca2+ cycling processes than ventricular myocytes (Vcell), and are frequently involved in ventricular arrhythmias. Yet, the mechanistic basis for their arrhythmic vulnerability is not completely understood.
Objective
(1) Characterize Pcell electrophysiology, Ca2+ cycling and their rate dependence. (2) Investigate mechanisms underlying Pcell arrhythmogenicity. (3) Compare Pcell and Vcell electrophysiology, Ca2+ cycling and arrhythmic properties.
Methods and Results
We developed a new mathematical model of Pcell. The Ca2+ subsystem includes spatial organization and receptors distribution unique to Pcell. Results: (1) in Pcell and Vcell, Na+ accumulation via its augmentation of repolarizing INaK dominates APD adaptation; in Pcell, INaL contributes additional APD shortening at short CL; (2) Steep Pcell restitution is due to slow recovery of INaL; (3) Pcell's biphasic CaT reflects delay between Ca2+ release from JSR and CSR; (4) Pcell Ca2+ alternans, unlike Vcell, can develop without inducing AP alternans; (5) Pcell AP alternans develops at a shorter CL than Vcell, with increased subcellular heterogeneity of Ca2+ cycling due to refractoriness of Ca2+ release from CSR and JSR; (6) Greater Pcell vulnerability to DADs is due to higher SR Ca2+ content and ionic currents that reduce excitation threshold and promote triggered activity; (7) EAD generation in Pcell is mostly due to reactivation of INaL2, while ICaL plays this role in Vcell.
Conclusions
Steeper rate dependence of AP and CaT, central-peripheral heterogeneity of Ca2+ cycling and distinct ion channel profile underlie greater arrhythmic vulnerability of Pcell compared to Vcell.
Keywords: Purkinje, electrophysiology, calcium, modeling, arrhythmia
It has been suggested that under similar conditions, cardiac Purkinje cells (Pcell) are more vulnerable to development of delayed afterdepolarizations (DAD) and arrhythmic activity than ventricular myocytes (Vcell)1. Pcell participation in arrhythmia was recently reported in studies of catecholaminergic polymorphic ventricular tachycardia (CPVT)2,3 and ventricular fibrillation4. On cessation of rapid pacing (5Hz) to load the sarcoplasmic reticulum (SR), Pcell exhibits higher frequency and amplitude of spontaneous Ca2+ release events than Vcell1. It is unclear why Pcell is more arrhythmogenic than Vcell and what is the role of electrophysiologic properties and Ca2+ handling in its greater arrhythmogenicity. Answering these questions requires quantitative comparison of specific ionic mechanisms that underlie the action potential (AP) and calcium cycling in Pcell and Vcell.
Electrophysiologic characteristics and intracellular Ca2+ handling of Pcell are considerably different from Vcell. Pcell AP is distinguished from Vcell by its faster depolarization upstroke, sloping repolarization time course during phase-2, and longer AP duration (APD)5–7. Ultrastructurally, Pcell is devoid of transverse tubular (T-tubule) network8. Pcell exhibits biphasic Ca2+ transients (CaT) in response to normal membrane depolarization9,10; it has a complex, triple-layered spatial distribution of Ryanodine receptor subtype 2 (RyR2) and subtype 3 (RyR3), and Inositol trisphosphate receptor subtype 1 (IP3R1)11 (Figure 1B). These unique electrophysiological and ultra-structural characteristics likely underlie the differences in rate dependence and arrhythmic vulnerability between Pcell and Vcell.
Figure 1.
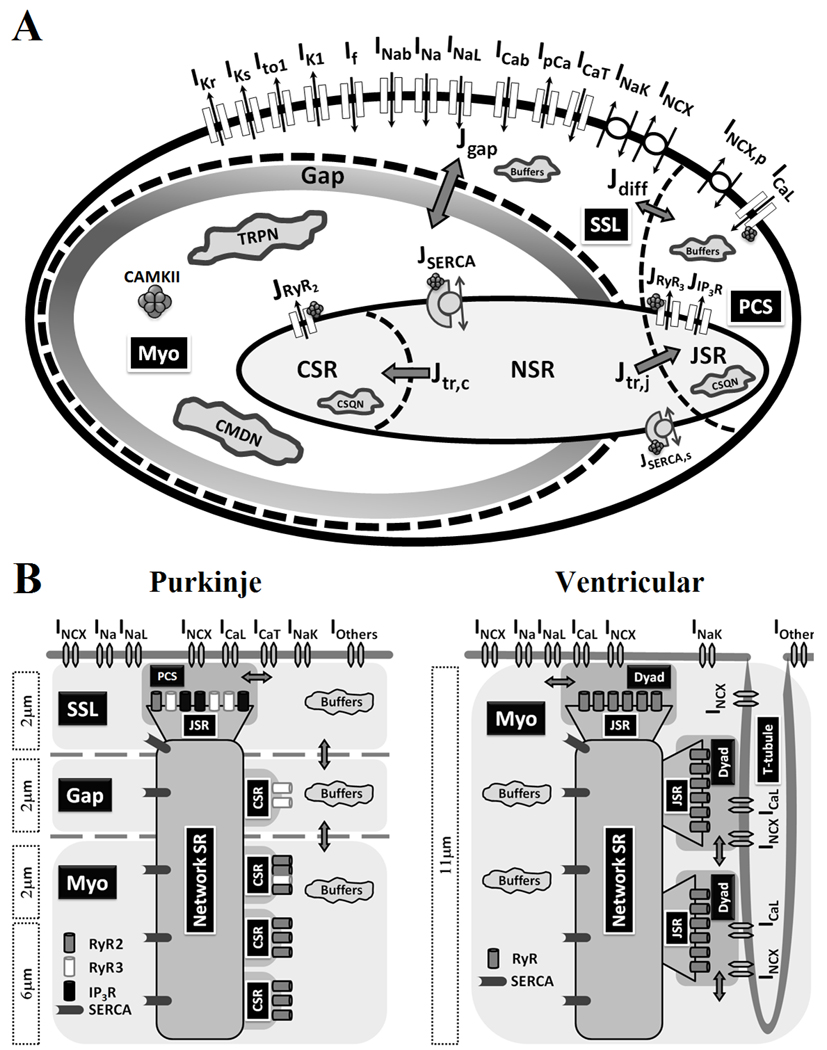
(A) Canine cardiac Purkinje cell (PRd) model. Model details and parameter definitions are provided in Supplement. The compartmental cell model contains the following compartments (from periphery to center): PCS (peripheral coupling subspace), SSL (sub-sarcolemma), Myo (bulk myoplasm), SR (sarcoplasmic retibulum), JSR (junctional SR), NSR (network SR) and CSR (corbular SR). (B) Comparison of ultra-structure between canine cardiac Purkinje and ventricular cells. Intracellular Ca2+ cycling components are based on Stuyvers et al11 (Pcell) and Decker et al14 (Vcell). Lack of T-tubular network and compartmental localization of RyR2, RyR3 and IP3R, create spatial heterogeneity of Ca2+ cycling in Purkinje cells.
Computational modeling of cardiac myocytes has been an important tool in advancing our understanding of cardiac electrophysiology and excitation-contraction (EC) coupling. Current cardiac Purkinje cell models12,13 are limited by lacking a realistic description of intracellular Ca2+ dynamics. They adopt the ventricular Ca2+ cycling models and do not incorporate the receptor types and spatial organization that are unique to Pcell. This can lead to inaccurate simulation of electrophysiological processes due to the strong coupling between the electrical and Ca2+ subsystems via Ca2+ dependent ionic currents and dynamic ionic concentrations. In this study, we developed a mathematical model (the PRd model) of the canine cardiac Purkinje AP and Ca2+ cycling (Figure 1A). The model includes an accurate representation of sarcolemmal ionic currents and a detailed description of the distinct Pcell intracellular Ca2+ dynamics. Formulation was based on careful validation over a wide range of pacing rates. The model was used to gain new mechanistic insights into specific ionic processes underlying rate-dependent AP and CaT properties of Pcell. Through a comparative simulation study of Pcell and Vcell behaviors, we identified Pcell properties that could explain its greater vulnerability to arrhythmogenesis.
METHODS
General Approach
The newly developed canine cardiac Purkinje cell model (P-model) includes a physiologically-based representation of intracellular Ca2+ cycling specific to Pcell, and of major membrane ionic currents. The model is compartmental (Figure 1) and its formulation is based on un-diseased canine experimental data at 37 °C. Description and validation of model formulation, equations and parameter definitions are provided in Supplement (validation is in Online Figures I–VII). The model code can be downloaded from the research section of http://rudylab.wustl.edu. The recent canine ventricular epicardial cell model (V-model)14 is used in Purkinje-ventricular comparative simulation studies.
Cell geometry and subcellular compartments
The Pcell is represented as a cylinder, 164 µm in length and 17.5 µm in radius, based on experimental measurements15. The SR is divided into three compartments: junctional SR (JSR), corbular SR (CSR) and network SR (NSR)8. The cytoplasm is divided into the peripheral coupling subspace (PCS), sub-sarcolemmal region (SSL), and bulk myoplasm (Myo) (Figure 1A). PCS is the functional coupling domain between sarcolemmal Ca2+ entry (via ICaL) and peripheral JSR Ca2+ release (mostly via RyR3 and IP3R); it is the equivalent of a dyad in ventricular myocytes. The term "dyad" does not apply in Purkinje cells due to absence of a T-tubular network8. The SSL compartment is the layer of cytoplasm underneath the sarcolemmal membrane (about 2µm deep)11. All membrane ionic currents that are not in PCS are located in SSL. There is a "void" region (about 2 µm) between SSL and Myo, with virtually no expression of RyR2 and IP3R11, and reduced expression of RyR3 compared to SSL (Figure 1B). Based on the model compartmental structure, each receptor type is placed in the model compartment where its expression level is high. With this compartmental design, the void region is modeled functionally by Ca2+ diffusion flux (Jgap) that connects the SSL and Myo compartments. CSR, located in Myo, represents SR terminal cisternae that are not in close proximity to the cell membrane. CSR Ca2+ receptors are not exposed to sarcolemmal Ca2+ influxes; they can only respond to cytoplasmic Ca2+ elevation in the Myo compartment. The P-model compartmentalization is based on the "triple-layered" structure introduced by Stuyvers et al11 (Figure 1B, left); compartmentalization of Ca2+ cycling in the V-model14 is depicted in Figure 1B, right, for comparison.
Intracellular Ca2+ fluxes
Three types of Ca2+ receptors are included in the P-model: IP3R, RyR2 and RyR3. RyR2 is located on the membrane surface of CSR and responds to [Ca2+]i elevation in Myo. RyR3 is co-localized with IP3R in PCS (Figure 1). Bidirectional Ca2+ diffusion fluxes, Jdiff (between SSL and PCS) and Jgap (between SSL and Myo), connect the cytoplasmic compartments. JSERCA is Ca2+ uptake (via SERCA) into NSR. Ca2+ translocation from NSR to JSR and CSR is via Jtr,j and Jtr,c, respectively.
Membrane ionic currents
P-model membrane ionic currents (Figure 1) were formulated using the Hodgkin-Huxley (HH) scheme, based on un-diseased canine-specific experimental data at 37 °C (Supplement).
Simulation protocols
Steady state results are for 60 minutes of pacing at a given cycle length (CL). Restitution curve is obtained with an additional paced beat at variable coupling intervals from the last steady state AP. APD is determined as APD90 (90% repolarization). State variable clamp protocols were used to quantify individual contributions of selected ion channels or ionic concentrations to the AP. Standard programming language C was used. Forward Euler method with an adaptive time step was used for numerical integration.
RESULTS
AP morphology and rate adaptation
In Figure 2A, simulated Pcell AP morphology and APD during steady state pacing (CL of 500ms) reproduce closely experimental recordings16–18, with APD90 of 293.2ms, maximum upstroke velocity (dV/dtmax) of 461Vs−1 and membrane resting potential of −84.6mV. Simulated drug effects (TTX, nifedipine and TEA) on Pcell AP morphology are consistent with experiments (Online Figure VIII). Simulated Pcell APD adaptation curve (Figure 2B; CLs from 300ms to 2000ms) is also in agreement with experimental measurements19–20,6.
Figure 2.
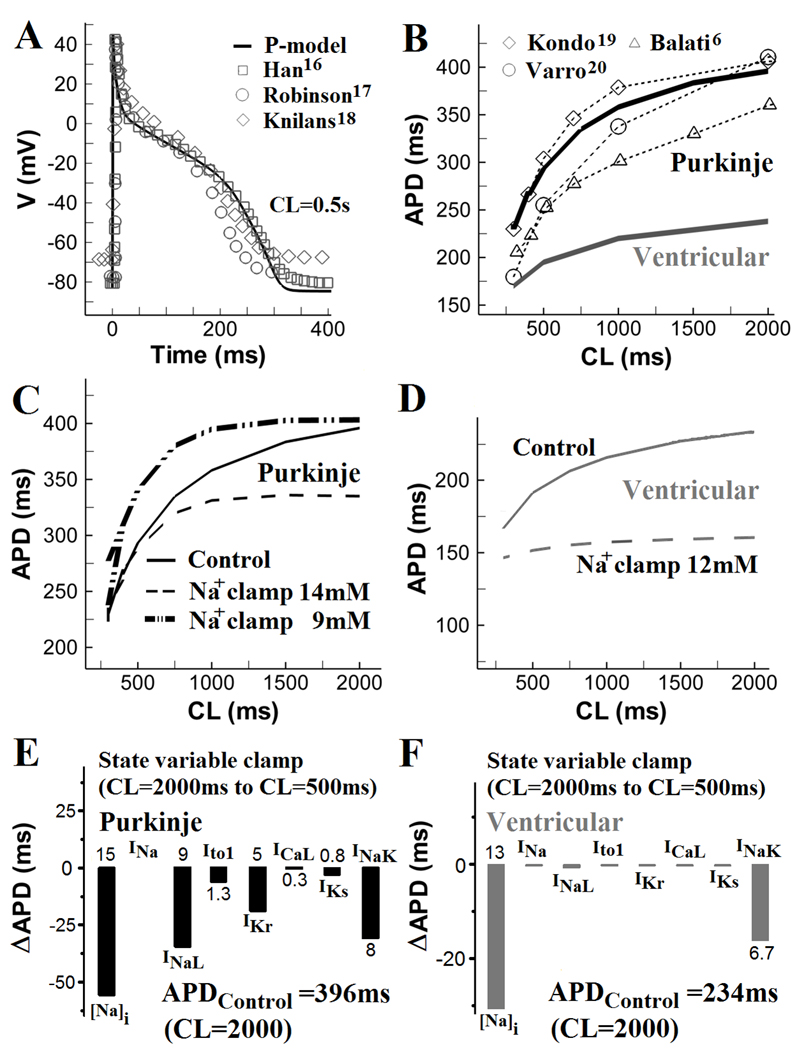
AP morphology and APD rate dependence. (A) Simulated Purkinje AP (solid line) during steady state pacing at cycle length (CL) = 500ms and corresponding experimental recordings (symbols)16–18. (B) APD rate adaptation curves for Pcell (simulated and measured) and Vcell. (C) Effects of [Na+]i clamp at 14mM or 9mM on Pcell APD rate adaptation. (D) Effects of [Na+]i clamp at 12mM on Vcell APD rate adaptation. (E) Changes in Pcell APD (ΔAPD) when [Na+]i and selected currents (INa, INaL, Ito1, IKr, ICaL, IKs and INaK) at steady-state CL of 2000ms are reset to their values at CL of 500ms. (F) Same as (E) for Vcell.
Specific ionic mechanisms of APD rate adaptation in Pcell and Vcell were investigated using state variable clamp protocols (Figure 2C–2F). In control (no clamp), steady sate intracellular [Na+]i is 9.4mM at CL=2000ms and 13.5mM at CL=500ms (Online Figure IX). In Figure 2C, [Na+]i clamp to either 9mM or 14mM considerably alters Pcell APD adaptation. For [Na+]i clamp at 9mM, APD alternans develops at CL=300ms due to excessive prolongation of APD and short diastolic interval between APs. In Vcell (Figure 2D), [Na+]i is 7.4mM at CL=2000ms, and 8.8mM at CL=500mM; [Na+]i clamp at 12mM largely reduces the steepness of APD adaptation. To quantify the role of individual ionic currents or concentrations in APD adaptation, values of state variables (channel gates or ionic concentrations) at CL=2000ms were reset to their values at CL=500ms. ΔAPDs (difference between control APD at CL=2000ms and APD at CL=2000ms with selected state variables reset to their values at CL=500ms) are presented. In Pcell (Figure 2E), intracellular Na+ accumulation is most important in causing APD shortening at short CL ([Na+]i reset shortens APD by 15%). The [Na+]i-dependent APD shortening is mediated via an increased outward INaK. However, INaK clamp alone, without [Na+]i reset, causes only 8% APD shortening, indicating additional contribution from INCX ([Na+]i reset causes only 10% APD shortening when INCX is clamped to its value at CL=2000ms). INaL clamp causes 9% APD shortening. Thus, INaK, INaL and INCX participate in Pcell APD shortening at short CLs. In Vcell (Figure 2D and 2F), intracellular [Na+]i accumulation (13% shortening with [Na+]i reset) and INaK (6.7% shortening with INaK clamp alone) are the major determinants of APD shortening between CL=2000ms and CL=500ms. Effects of clamping other currents are small. Thus, APD adaptation in both Pcell and Vcel is mostly determined by [Na+]i accumulation and INaK; however, in Pcell, INaL is also a major participant in APD shortening at short CL, due to its slower recovery from inactivation in this cell21.
APD restitution
For S1 pacing at CLS1=500ms, simulated Pcell APD restitution agrees well with experimental data in isolated canine Purkinje cells17 (Figure 3A, top panel). At short S2 coupling interval (CLS2 =340ms), Pcell APD and AP plateau potentials are considerably decreased from the CLS1 AP. The simulated Pcell APD restitution curve matches experimental data18,20 (Figure 3B). Pcell APD depends strongly on CLS2 variation between 340ms and 1000ms. However, this dependence is much weaker in Vcell (Figure 3A, bottom). Figure 3C compares Pcell and Vcell APD restitution curves for CLS1 of 500ms, 1000ms and 2000ms. More pronounced APD shortening at DI<300ms is observed in Pcell compared to Vcell (box in Figure 3C). Pcell dynamic restitution curve is provided in Online Figure X.
Figure 3.
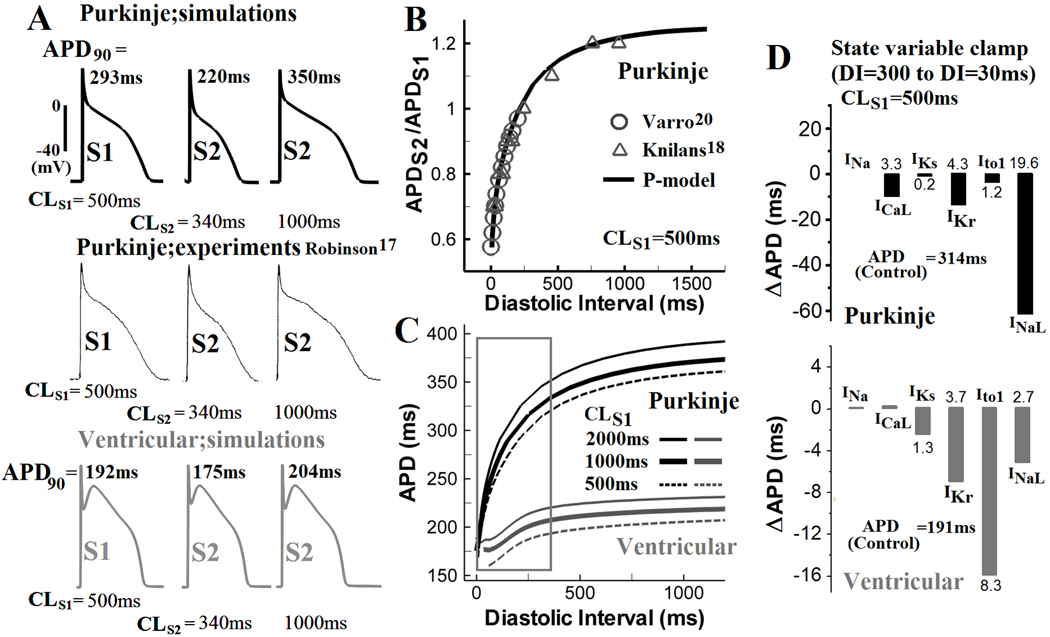
APD restitution. (A) After steady state was reached during pacing at CL of 500ms (S1), an additional stimulus (S2) was applied at a coupling interval of 340ms or 1000ms from the last S1 stimulus. Simulated Pcell S1 and S2 APs (top) are compared with experimental recordings (middle)17 and with Vcell APs (bottom). (B) Simulated and experimentally measured20,18 Pcell APD restitution curves (CLS1=500ms). (C) Comparison of APD restitution in Pcell (black) and Vcell (gray) for S1 pacing at 500ms, 1000ms and 2000ms. Restitution is steep for S2 coupling interval <300ms in Pcell (box). (D) Top: Changes in Pcell (top) and Vcell (bottom) APD (ΔAPD) when INa, ICaL, IKs, IKr, Ito1, and INaL at diastolic interval (DI) of 300ms were reset to their values at DI of 30ms, for CLS1= 500ms. Bottom: same as top for Vcell.
Specific ionic mechanisms of APD restitution in Pcell and Vcell were examined using state variable clamp protocols (Figure 3D). At CLS1=500ms, values of selected state variables at DI=300ms were reset to their values at DI=30ms. ΔAPDs (the difference between control APD at DI=300ms and APD with selected state variables clamped to their values at DI=30ms) are presented. In Pcell (Figure 3D, top), INaL clamp shortens APD the most (by 19.6%). ICaL (3.3%) and IKr (4.3%) clamps also contribute. Intracellular Ca2+ concentration or SR Ca2+ content clamp lead to minor APD abbreviation by 2% or 0.8%, respectively (not shown). In Vcell, Ito1 clamp contributes most to APD shortening (8.3%). IKr, INaL and IKs clamp cause APD shortening of 3.7%, 2.7% and 1.3%, respectively. The much greater maximal APD shortening in Pcell (19.6%; INaL clamp) compared to Vcell (8.3%; Ito1 clamp) at CLS1=500ms is consistent with the steeper Pcell restitution.
CaT morphology and rate dependence
Hess and Wier9 measured intracellular Ca2+ using aequorin fluorescence in canine cardiac Purkinje fibers. The aequorin fluorescence signal provides an estimate of spatially-averaged CaT; its time course has two components, L1 and L2 (Figure 4B, inset). At CL of 1000ms, simulated steady state [Ca2+]avg (spatially averaged Ca2+ concentration in PCS, SSL and Myo), exhibits similar L1–L2 morphology (Figure 4B, top). The L1 and L2 components of CaT appear 25ms and 85ms after the stimulus, respectively. These delays are in quantitative agreement with experimental measurements (30ms for L1 and 80ms for L29). For [Ca2+]o=2.0mM at CL=1000ms, the simulated amplitude of CaT (0.24 µM) is consistent with calibrated fluorescence imaging measurements (0.27 µM) by Boyden et al10. The simulated CaT decay rate (time constant for half relaxation τ=156ms) is also in agreement with Boyden et al's confocal microscopic recordings (τ = 150ms)10. Interestingly, the simulated [Ca2+]avg displays much slower decay than the Hess and Wier9 aequorin signal (τ = 40ms) (Figure 4B, inset), likely due to the sensitivity threshold of aequorin to local Ca2+.
Figure 4.
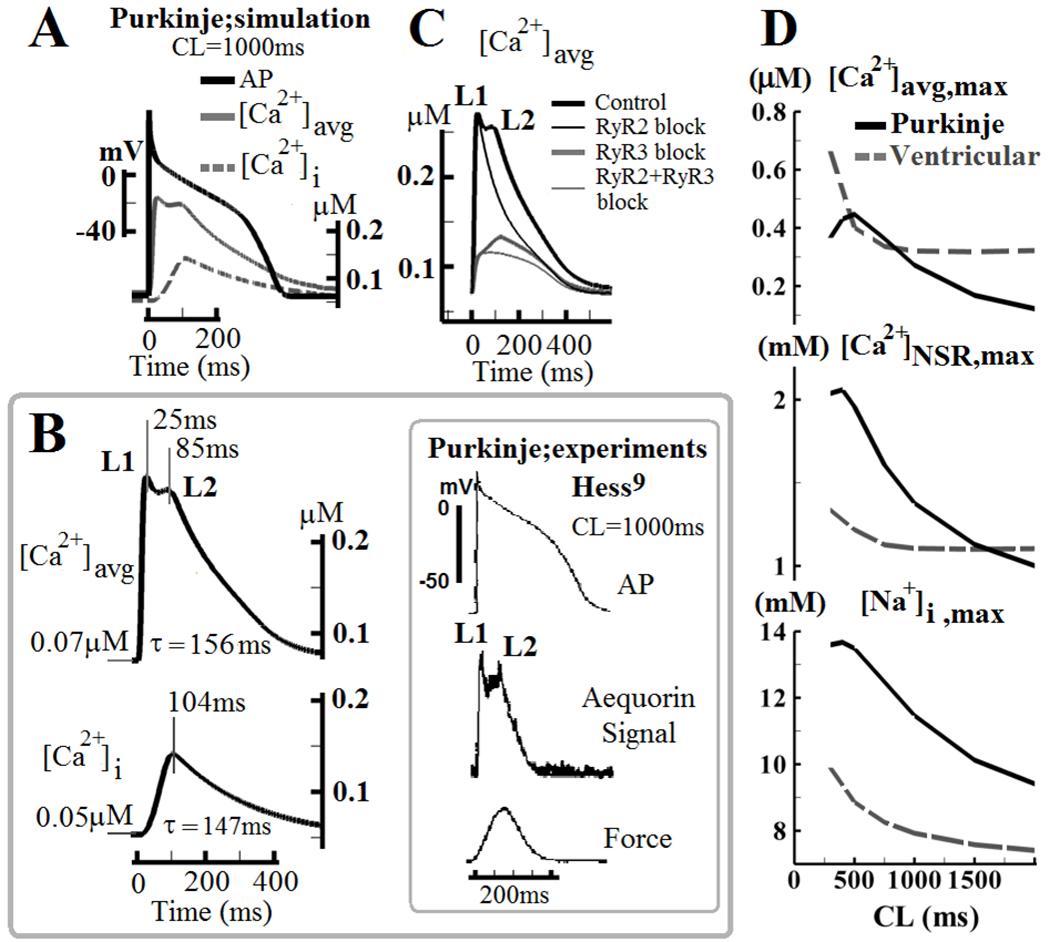
Purkinje CaT morphology and rate dependence. (A) Simulated steady state (CL=1000ms) AP, CaT ([Ca2+]avg, the spatial average of Ca2+ in PCS, SSL and Myo), and [Ca2+]i (Myoplasmic Ca2+) during the AP. (B) Comparison of simulated CaT with Aequorin luminescent signal (an estimate for spatially averaged CaT) and of simulated [Ca2+]i with force recorded from canine Purkinje fibers (gray box)9. τ is time constant for half relaxation. (C) Contributions of RyR2 and RyR3 to CaT. During steady state pacing (CL=1000ms) RyR2 and RyR3 are either blocked individually or together. (D) Rate dependence of CaT (top), [Ca2+]NSR,max (middle), [Na+]i,max (bottom) in Pcell (black); corresponding simulated data for Vcell are shown for comparison (dash-grey).
To investigate the specific roles of RyR2 and RyR3 in determining the L1–L2 morphology of Pcell CaT, RyR2 and RyR3 were blocked individually or in combination during steady state pacing at CL of 1000ms. The simulations in Figure 4C identify Ca2+ release from RyR3 (in PCS) and RyR2 (in Myo) as the major contributors to the L1 and L2 components of [Ca2+]avg, respectively. Interestingly, there is "cross talk" between these processes - RyR3 block has a strong effect on L2. This is because Ca2+ release via RyR3 from JSR in PCS is required for Ca2+-induced-Ca2+-release from RyR2 in Myo. In other words, Ca2+ influx from SSL to Myo acts as both a source of Ca2+ and a trigger of Ca2+ release from CSR.
Rate dependence of CaT is shown in Figure 4D. Generally, Pcell has a smaller CaT than Vcell (peak CaT Pcell=0.45 µM; Vcell=0.67 µM). The stronger rate dependence of Pcell CaT and SR loading (Figure 4D, top and middle) shows strong correlation with the faster intracellular [Na+]i accumulation (Figure 4D, bottom). Pcell has a higher [Na+]i concentration than Vcell, about 9mM in quiescent cells and 11mM during pacing at CL of 1000ms22. As CL decreases, [Na+]i accumulates faster in Pcell due to larger Na+ influx via INaL. For CL below 500ms, [Na+]i plateaus (Figure 4D, bottom), mostly due to a smaller INaL at short CL. The correlation between [Na+]i and CaT rate dependence is due to coupling via INCX and SR loading; at high [Na+]i, intracellular Ca2+ extrusion via INCX is reduced, leading to Ca2+ loading, greater SR Ca2+ content and larger CaT.
AP and Ca2+ alternans
CaT alternans (stimulus-to-response ratio of 2:2) develops in Pcell at CL = 300ms. At this rate, AP alternans is not present, and the CaT alternans is driven by refractoriness of SR Ca2+ release (Figure 5A). The L2 (gray) component of [Ca2+]avg occurs every other beat, indicating high amplitude of alternans. The L1 (black) component appears on every beat and alternates with a smaller amplitude. Simulated traces of Ca2+ in JSR and CSR during CaT alternans show that Ca2+ depletion of JSR alternates with a small amplitude, while Ca2+ depletion of CSR (stimulus-to-response ratio of 2:1) occurs only every other beat. These compartment-specific alternations correspond to the alternans of the L1 and L2 components of CaT. It is interesting that subcellular Ca2+ alternans with such large amplitude (occurrence of L2 component every other beat) is not affecting the Pcell AP. Lack of t-tubular system in Pcell is probably responsible for the Ca2+-AP dissociation, because it spatially dissociates Ca2+ variations in the center of the cell from the membrane ionic transport subsystem.
Figure 5.
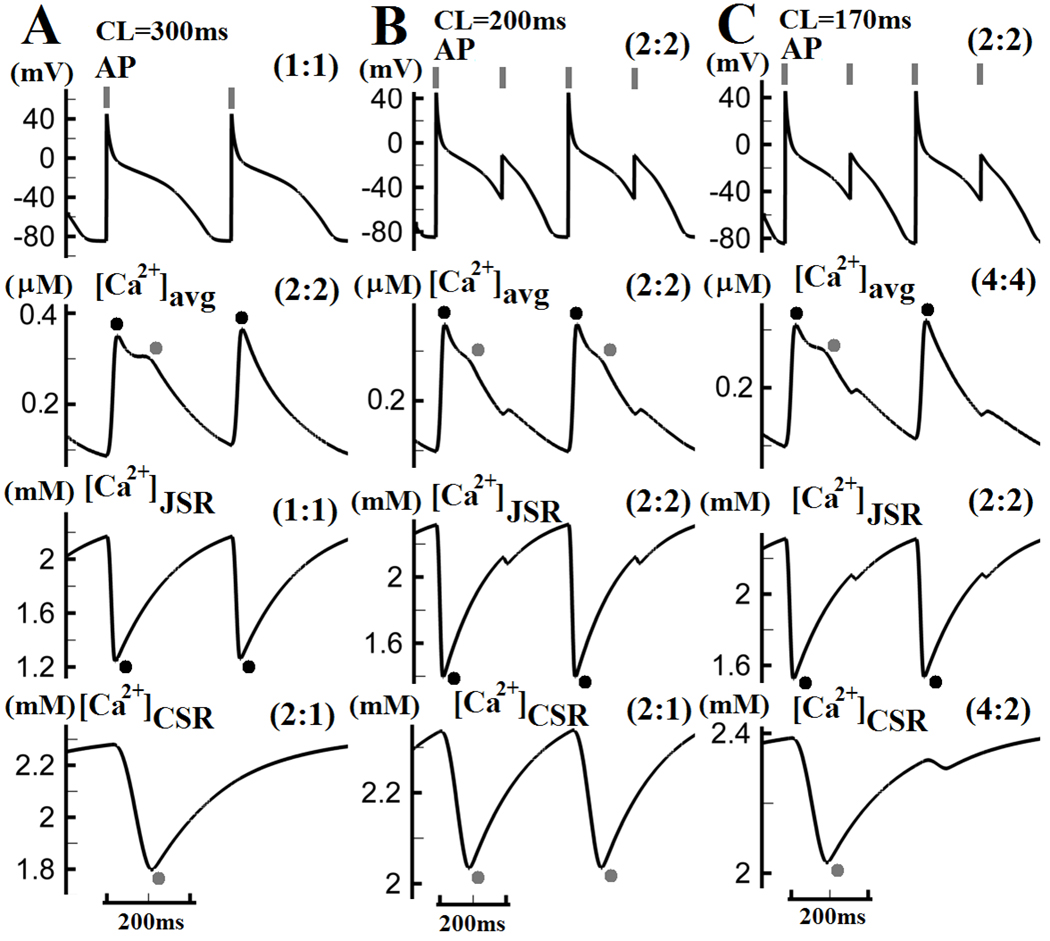
(A) Subcellular Ca2+ alternans develops in Pcell at CL of 300ms without APD alternans. The L1 component (black dots) of [Ca2+]avg alternates with small amplitude from beat to beat, while the L2 component (gray dots) is only present on every other beat. (B) At CL=200ms, AP alternans also develops. Both L1 and L2 components of [Ca2+]avg appear only every other beat. (C) At CL=170ms, the L1 component of [Ca2+]avg occurs every other beat, while the L2 component only every fourth beat. Pacing stimuli are indicated by gray vertical bars on top. Black or gray dots indicate L1 or L2 component of CaT (and associated processes), respectively. Stimulus-to-response ratios are indicated in brackets in each panel.
During steady state pacing at CL=200ms, APD alternans develops with a large amplitude (Figure 5B, top), and is accompanied by very large CaT alternans (stimulus-to-response ratio of 2:2) (Figure 5B, second row). Ca2+ depletion of JSR alternates with a large amplitude and CSR release occurs only every other beat. At CL=170ms (Figure 5C), [Ca2+]avg exhibits a more complex pattern (4:4), where the L1 component of CaT occurs every other beat (black dots) and L2 only every fourth beat (gray dots), reflecting increased subcellular heterogeneity of Ca2+ cycling. In summary: (1) [Ca2+]CSR is more responsive to CL shortening than [Ca2+]JSR, but has minimal effect on AP due to spatially mediated Ca2+-AP dissociation; (2) AP and [Ca2+]JSR always display the same stimulus-to-response ratio due to strong coupling between the JSR and the cell membrane; (3) As pacing rate increases, subcellular heterogeneity of Ca2+ cycling increases as well.
DAD and arrhythmic vulnerability of Pcell
Ionic mechanisms underlying Pcell arrhythmic vulnerability due to the development of DAD and triggered activity are investigated in Figure 6. Hypersensitivity of RyR2 (e.g. due to RyR2 or calsequestrin mutation)23 in Pcell and Vcell is phenomenologically modeled by a decrease of release time constant (by 66%) and increased sensitivity to luminal Ca2+ content (by 75%). With normal RyR2, after cessation of steady state pacing at CL=300ms, no spontaneous depolarizations are observed in either Pcell or Vcell (Figure 6A). With hypersensitive RyR2 at the same pacing rate, Pcell develops afterdepolarizations and triggered activity (7 subthreshold DADs and 5 triggered APs) after cessation of pacing, but Vcell does not (Figure 6B). Occurrence of DADs in Pcell exhibits positive rate dependence, mostly due to higher SR content at short CL, which is consistent with experiments23, 24. In Figure 6C, to investigate the underlying cause of the Pcell greater arrhythmic vulnerability, selected Pcell ionic currents or concentrations (ICaT, INaL, IK1, If and [Ca2+]NSR) are modified (individually or in combination) to be "ventricular-like". Specifically, relative to Pcell, Vcell has a mucher smaller INaL, larger IK1, smaller SR Ca2+ content, and no ICaT and If currents. In the simulations, block of ICaT reduced the number of spontaneous events (6 DADs and 3 triggered APs), while block of INaL eliminated all triggered APs. 50% increase of IK1 or block of If also eliminated triggered APs. 30% reduction of SR Ca2+ content reduced the number of spontaneous events by 60%. Combination of all above changes ("ventricular-like" cell) led to quiescent and stable resting potential. From these simulations, we conclude that the greater Pcell vulnerability to DADs and triggered activity is due to: (1) higher SR Ca2+ content; (2) membrane ion channel profile that reduces excitation threshold and resting potential stability (i.e. reduced IK1 expression and presence of If); (3) depolarizing ion channels that promote triggered activity (i.e. presence of ICaT and larger INaL).
Figure 6.
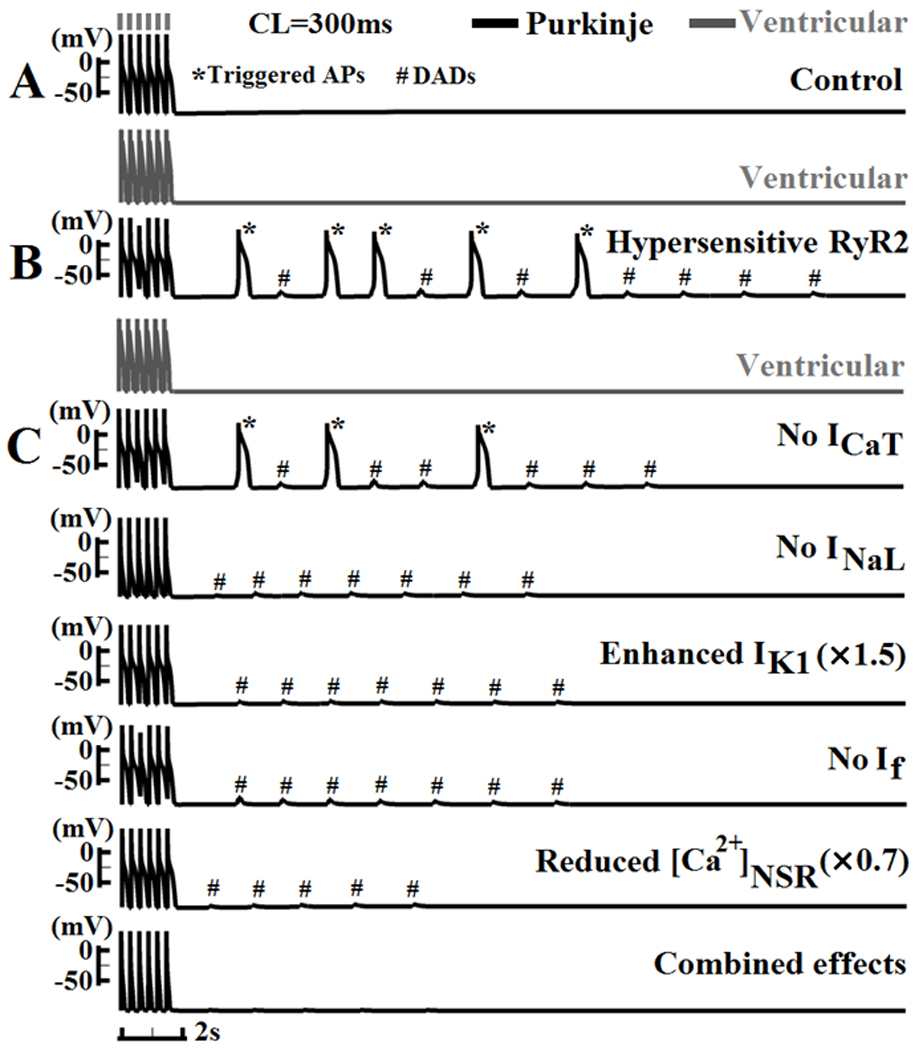
DADs and triggered activity. (A) After cessation of steady state pacing at CL=300ms, no spontaneous activity is observed in Pcell or Vcell under control conditions. (B) With increased RyR2 sensitivity, Pcell develops DADs and triggered APs, while Vcell remains quiescent. (C) Ionic currents or concentrations (Top to bottom: ICaT, INaL, IK1, If and [Ca2+]NSR) are ajusted either individually or together to resemble their ventricular counterparts. * indicates triggered AP; # indicates sub-threshold DAD. See details in text.
Early afterdepolarization (EAD) and its underlying mechanisms
With application of quinidine25–27 or IKr block19 during slow pacing, canine Purkinje fibers develop EADs that depolarize from plateau potentials of about −20mV. Earlier studies suggested that recovery from inactivation of ICaL is responsible for genesis of EADs in both Pcell26,28 and Vcell29. However, recent experimental reports proposed a role for INaL in Purkinje fibers EADs30, 31. The ionic mechanism of EADs is investigated in Figure 7. At CL=4000ms with complete block of IKr, large amplitude EADs develop starting from the 127th beat (Figure 7A, top). Simulated tracings of INaL2, INaL3 and ICaL are shown in Figure 7A (bottom three traces). Reactivation of INaL2 coincides with the EADs. In panel B, with only 50% IKr block, 80% reduction of Ito1 (simulating reduced ito1 expression in heart failure32 or myocardial infarction33) elevates the plateau potentials, leading to more severe EAD activity that starts earlier (at the 17th beat, Figure 7B, top). Persistent EAD events are observed starting at the 42th beat (Figure 7B, middle). Again, EAD occurrences and patterns are in synchrony with INaL2 reactivation (Figure 7B, bottom). Two consecutive APs (#41 and #42) and ionic currents (INaL2 and ICaL) are overlaid in Figure 7C. Recovery and reactivation of INaL produce current of much larger amplitude than ICaL. Furthermore, INaL2 reactivation always precedes both ICaL reactivation (by 10ms) and the EAD upstroke (by 50ms) (Figure 7C, right), providing depolarizing charge for EAD generation. These results indicate that INaL2 plays the major role in the genesis of EADs in canine Purkinje cells, due to its high current density and voltage range for activation (I–V curve peaks at about −20mV, the EADs takeoff potential). ICaL also reactivates during the EAD upstroke, but its contribution is much smaller than that of INaL. Thus, EAD formation in Pcell or Vcell relies on recovery and reactivation of different ion channels during a prolonged plateau; INaL is the major depolarizing current of Pcell EAD, while for Vcell EAD it is ICaL.
Figure 7.
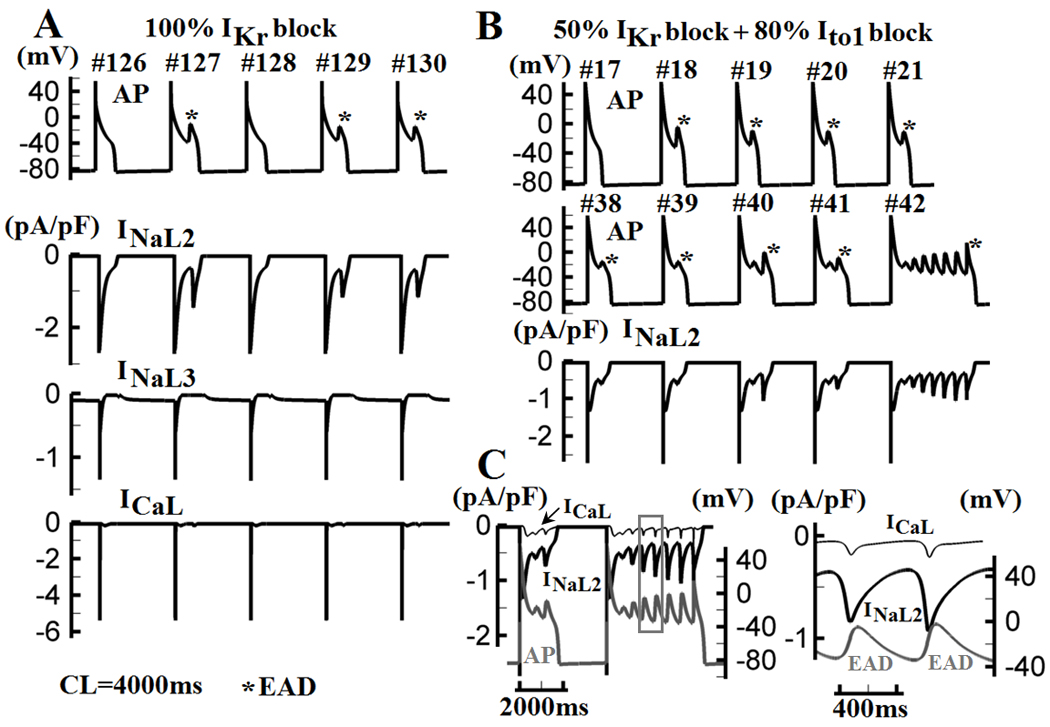
Purkinje EADs and underlying mechanism. (A) At CL=4000ms with complete IKr block, EADs develop starting from beat #127 (top panel). Simulated tracings of INaL2, INaL3 and ICaL (bottom panel) identify reactivations of INaL2 as the mechanism of EAD generation. (B) 80% block of Ito1 and 50% block of IKr lead to increased EAD activity due to elevation of plateau potential. EADs are observed starting from beat #18 and persist from beat #42. (C) Two consecutive APs (beats #41 and #42 in (B)) are overlaid with INaL2 and ICaL. A portion of beat #42 (box in left panel) is enlarged in the right panel. Reactivated INaL2 is of much larger amplitude than ICaL and precedes the reactivation of ICaL and the EAD upstroke.
DISCUSSION
We present a new mathematical model for the canine cardiac Purkinje AP and Ca2+ cycling, validated with recent experimental data. Importantly, the model incorporates not only electrophysiological components that are specific to Purkinje cell, but also Ca2+ cycling properties that differ greatly from those of ventricular myocyte, both in receptor types and spatial organization. These properties, which affect the amplitude and time courses of the CaT and consequently the AP, were not incorporated in recently published Purkinje cell models12,13, which retained the calcium cycling representation from models of ventricular myocytes (see Models Comparison table in Supplement). The model is used to investigate mechanisms of AP and CaT rate dependence, including APD adaptation and restitution, SR loading, and alternans. Arrhythmic triggered activity due to DADs and EADs is also explored.
Through a comparative study of behaviors and mechanisms between a Purkinje cell and ventricular myocyte, we found that: (1) In both Pcell and Vcell, intracellular Na+ accumulation at fast rate and its enhancement of outward INaK dominate rate-dependent APD shortening during steady state pacing (adaptation). In Pcell, INaL contributes additional APD shortening at short CL due to incomplete recovery from inactivation, causing steeper adaptation than Vcell; contributions to APD adaptation from currents other than INaK are minimal in Vcell. (2) Pcell APD restitution is steeper than that of Vcell. At short coupling intervals, INaL inactivation is most important in causing APD shortening in Pcell; in Vcell, Ito1 underlies APD shortening. (3) Pcell exhibits a biphasic CaT, reflecting a delay between Ca2+ release from JSR (via RyR3 and IP3R) and CSR (via RyR2). Rate dependence of CaT and SR loading is stronger in Pcell than Vcell, mostly due to faster [Na]i accumulation. (4) In contrast to Vcell, Pcell Ca2+ alternans can occur without causing AP alternans because of spatial dissociation between [Ca2+]i and membrane ion channels. (5) Pcell AP alternans develops at a shorter CL than Vcell, with an increased subcellular heterogeneity of Ca2+ cycling. (6) Greater Pcell vulnerability to DADs is due to higher SR content, and the presence of membrane currents that reduce excitation threshold and rest potential stability (IK1, If) and currents that promote triggered activity (ICaT, INaL). (7) EAD generation in Pcell is mostly due to reactivation of INaL2, while ICaL plays this role in Vcell.
The above findings provide new insights into the arrhythmogenic potential of Purkinje fibers. Recent studies have demonstrated greater arrhythmic vulnerability in Purkinje compared to ventricular myocardium1–4. This could result from properties at the tissue scale, such as high expression of connexin, loading conditions due to frequent branching and highly variable fiber cross-sections, and asymmetrical electrical properties at Purkinje-muscle junctions34. The single cell results presented here show that Purkinje fibers are intrinsically more arrhythmogenic than ventricular myocytes. The Purkinje cell has a steeper rate dependence of AP and CaT, it operates at a higher SR Ca2+ load, and is more prone to develop triggered activity due to its different ion-channel profile.
A recent study in isolated canine Purkinje cells by Lee et al35 reported complex beat-to-beat variations of CaT at fast pacing rate and negative rate dependence of CaT and SR loading. Consistent with the complex beat-to-beat CaT pattern, our simulations demonstrate increased subcellular heterogeneity of Ca2+ cycling at short CL, mostly due to Ca2+-AP dissociation and refractoriness of Ca2+ release from both CSR and JSR (Figure 5). However, unlike the experiment34, the model exhibits positive rate dependence of both CaT and SR loading. This dependence is stronger in Pcell than in Vcell (for CLs between 2000ms and 500ms) due to faster Na+ accumulation. There is paucity of direct measurements of CaT rate dependence in canine Purkinje fibers. Indirect evidence supports a positive relationship; for example, DADs appear earlier with greater amplitudes as pacing rate is increased24, suggesting an increased SR content. A positive CaT rate dependence was observed experimentally in sheep Purkinje fibers36. The different results of Lee et al35 could possibly reflect different temperature in model (37 °C, body temperature) and experiment (22–24 °C, room temperature), as reduced Na+ current at lower temperature decreases Na+ accumulation and consequently Ca2+ loading.
The Pcell model was formulated as a compartmental model, capturing properties of Ca2+ cycling in distinct compartments. While this constitutes an important step forward in modeling Pcell physiology, it does not represent spatially distributed processes at the scale of Ca2+ release units and spark formation. Further model development is required to simulate spatially distributed phenomena such as formation of Ca2+ waves and their electrophysiologic consequences.
NOVELTY AND SIGNIFICANCE.
What Is Known?
Cardiac Purkinje cells (Pcell) are thought to be more prone to arrhythmic activity than ventricular myocytes (Vcell).
Documented Pcell participation in arrhythmia includes catecholaminergic polymorphic ventricular tachycardia (CPVT) and ventricular fibrillation (VF).
The electrophysiologic profile and calcium (Ca) cycling properties of Pcell are considerably different from Vcell.
What New Information Does This Article Contribute?
We developed a mathematical model of Pcell that represents its unique electrophysiologic and Ca handling properties, and conducted a Pcell – Vcell comparison.
Rate dependence of action potential (AP) and Ca transient (CaT) is steeper in Pcell; consistent with greater vulnerability to arrhythmia.
Pcells are more prone to the development of arrhythmogenic delayed afterdepolarizations (DADs).
Pcell mechanisms and properties of AP and CaT alternans, and of early afterdepolarizations (EADs) differ from those of Vcell.
The cardiac Pcell is thought to be more prone to develop arrhythmic activity than Vcell. The P cell has been implicated as an important contributor to CPVT and VF. However, the mechanistic basis for its greater arrhythmia vulnerability is not completely understood. Electrophysiologic characteristics and intracellular Ca handling of Pcell are considerably different from Vcell. Importantly, Pcell is devoid of transverse tubules and has a complex spatial distribution of Ca release sites. We developed a mathematical model of the canine Pcell that incorporates these unique properties. The model was used to obtain new mechanistic insights into rate-dependence of Pcell AP and CaT, and to compare Pcell and Vcell properties. The simulations demonstrated that Pcell is intrinsically more arrhythmogenic than Vcell. It has steeper rate dependence of AP (due to contribution from the late sodium current) and CaT (due to stronger rate dependence of sarcoplasmic reticulum (SR) Ca loading). It operates at higher SR Ca load, which together with its different ion-channel profile, makes it more prone to develop DADs and triggered activity than Vcell. Recognizing the important role of Pcell in arrhythmogenesis and understanding its underlying mechanisms is a first step towards the development of novel antiarrhythmic strategies.
Supplementary Material
ACKNOWLEDGEMENTS
The authors thank members of the Rudy lab: Leonid M. Livshitz, Thomas O'Hara, Namit Gaur, Ali Nekouzadeh, Ashwin Mohan, Jiajing Xu and Smiruthi Ramasubramanian for most helpful discussions.
SOURCES OF FUNDING
This work was supported by NIH - National Heart, Lung and Blood Institute Grants RO1-HL-49054-19 and RO1-HL-33343-26, by the National Science Foundation under Grant CBET-0929633, and by Foundation Leducq Award to the Alliance for Calmodulin Kinase Signaling in Heart Disease (Grant 08CVD01) to Y. Rudy. Y. Rudy is the Fred Saigh Distinguished Professor at Washington University.
Abbreviations
- AP
Action Potential
- APD90
Action Potential Duration (at 90% repolarization) (ms)
- CL
Cycle Length (ms)
- DI
Diastolic Interval (ms): time from 90% repolarization of previous AP
- CaT
Ca2+ Transient (µM/L)
- PCS
Peripheral Coupling Subspace
- SSL
Sub-Sarcolemmal compartment
- Myo
Bulk Myoplasm compartment
- JSR
Junctional Sarcoplasmic Reticulum
- CSR
Corbular Sarcoplasmic Reticulum
- NSR
Network Sarcoplasmic Reticulum
- RyR
Ryanodine Receptor
- IP3R
Inositol trisphosphate receptor
- CPVT
Catecholaminergic polymorphic ventricular tachycardia
- DAD
Delayed afterdepolarization
- EAD
Early afterdepolarization
- Pcell
Cardiac Purkinje cell
- Vcell
Ventricular myocyte
Footnotes
Publisher's Disclaimer: This is a PDF file of an unedited manuscript that has been accepted for publication. As a service to our customers we are providing this early version of the manuscript. The manuscript will undergo copyediting, typesetting, and review of the resulting proof before it is published in its final citable form. Please note that during the production process errors may be discovered which could affect the content, and all legal disclaimers that apply to the journal pertain.
DISCLOSURES
None.
REFERENCES
- 1.Herron TJ, Milstein ML, Anumonwo J, Priori SG, Jalife J. Purkinje Cell Calcium Dysregulation Is the Cellular Mechanism that Underlies Catecholaminergic Polymorphic Ventricular Tachycardia. Heart Rhythm. 2010;7:1122–1128. doi: 10.1016/j.hrthm.2010.06.010. [DOI] [PMC free article] [PubMed] [Google Scholar]
- 2.Cerrone M, Noujaim SF, Tolkacheva EG, Talkachou A, O'Connell R, Berenfeld O, Anumonwo J, Pandit SV, Vikstrom K, Napolitano C, Priori SG, Jalife J. Arrhythmogenic mechanisms in a mouse model of catecholaminergic polymorphic ventricular tachycardia. Circulation research. 2007;101:1039. doi: 10.1161/CIRCRESAHA.107.148064. [DOI] [PMC free article] [PubMed] [Google Scholar]
- 3.Kang G, Giovannone SF, Liu N, Liu FY, Zhang J, Priori SG, Fishman GI. Purkinje cells from RyR2 mutant mice are highly arrhythmogenic but responsive to targeted therapy. Circulation research. 2010;107:512–519. doi: 10.1161/CIRCRESAHA.110.221481. [DOI] [PMC free article] [PubMed] [Google Scholar]
- 4.Tabereaux PB, Walcott GP, Rogers JM, Kim J, Dosdall DJ, Robertson PG, Killingsworth CR, Smith WM, Ideker RE. Activation patterns of Purkinje fibers during long-duration ventricular fibrillation in an isolated canine heart model. Circulation. 2007;116:1113–1119. doi: 10.1161/CIRCULATIONAHA.107.699264. [DOI] [PubMed] [Google Scholar]
- 5.Dun W, Boyden PA. The Purkinje cell; 2008 style. Journal of molecular and cellular cardiology. 2008;45:617–624. doi: 10.1016/j.yjmcc.2008.08.001. [DOI] [PMC free article] [PubMed] [Google Scholar]
- 6.Balati V. Comparison of the cellular electrophysiological characteristics of canine left ventricular epicardium, M cells, endocardium and Purkinje fibres. Acta Physiologica Scandinavica. 1998;164:181–190. doi: 10.1046/j.1365-201X.1998.00416.x. [DOI] [PubMed] [Google Scholar]
- 7.Burashnikov A, Antzelevitch C. Differences in the electrophysiologic response of four canine ventricular cell types to α1-adrenergic agonists. Cardiovascular research. 1999;43:901. doi: 10.1016/s0008-6363(99)00124-8. [DOI] [PubMed] [Google Scholar]
- 8.Sommer JR, Johnson EA. Cardiac muscle. The Journal of Cell Biology. 1968;36:497. doi: 10.1083/jcb.36.3.497. [DOI] [PMC free article] [PubMed] [Google Scholar]
- 9.Hess P, Wier WG. Excitation-contraction coupling in cardiac Purkinje fibers. Effects of caffeine on the intracellular [Ca2+] transient, membrane currents, and contraction. The Journal of general physiology. 1984;83:417. doi: 10.1085/jgp.83.3.417. [DOI] [PMC free article] [PubMed] [Google Scholar]
- 10.Boyden PA, Pu J, Pinto J, Keurs H. Ca2+ transients and Ca2+ waves in purkinje cells: role in action potential initiation. Circulation research. 2000;86:448. doi: 10.1161/01.res.86.4.448. [DOI] [PMC free article] [PubMed] [Google Scholar]
- 11.Stuyvers BD, Dun W, Matkovich S, Sorrentino V, Boyden PA, ter Keurs H. Ca2+ sparks and waves in canine purkinje cells: a triple layered system of Ca2+ activation. Circulation research. 2005;97:35. doi: 10.1161/01.RES.0000173375.26489.fe. [DOI] [PMC free article] [PubMed] [Google Scholar]
- 12.Aslanidi OV, Stewart P, Boyett MR, Zhang H. Optimal velocity and safety of discontinuous conduction through the heterogeneous Purkinje-ventricular junction. Biophysical journal. 2009;97:20–39. doi: 10.1016/j.bpj.2009.03.061. [DOI] [PMC free article] [PubMed] [Google Scholar]
- 13.Sampson KJ, Iyer V, Marks AR, Kass RS. A computational model of Purkinje fibre single cell electrophysiology: implications for the long QT syndrome. The Journal of physiology. 2010;588:2643–2655. doi: 10.1113/jphysiol.2010.187328. [DOI] [PMC free article] [PubMed] [Google Scholar]
- 14.Decker KF, Heijman J, Silva JR, Hund TJ, Rudy Y. Properties and ionic mechanisms of action potential adaptation, restitution, and accommodation in canine epicardium. American Journal of Physiology- Heart and Circulatory Physiology. 2009;296:H1017. doi: 10.1152/ajpheart.01216.2008. [DOI] [PMC free article] [PubMed] [Google Scholar]
- 15.Sheets MF, January CT, Fozzard HA. Isolation and characterization of single canine cardiac purkinje cells. Circulation research. 1983;53:544. doi: 10.1161/01.res.53.4.544. [DOI] [PubMed] [Google Scholar]
- 16.Han W, Wang Z, Nattel S. A comparison of transient outward currents in canine cardiac Purkinje cells and ventricular myocytes. American Journal of Physiology- Heart and Circulatory Physiology. 2000;279:H466. doi: 10.1152/ajpheart.2000.279.2.H466. [DOI] [PubMed] [Google Scholar]
- 17.Robinson RB, Boyden PA, Hoffman BF, Hewett KW. Electrical restitution process in dispersed canine cardiac Purkinje and ventricular cells. American Journal of Physiology- Heart and Circulatory Physiology. 1987;253:H1018. doi: 10.1152/ajpheart.1987.253.5.H1018. [DOI] [PubMed] [Google Scholar]
- 18.Knilans TK, Varró A, Nánási PP, Murray RJ, Kaiser FC, Lathrop DA. Electrophysiologic effects of FPL 13210 on canine Purkinje fiber action potential duration and Vmax comparison to disopyramide. Cardiovasc Drugs Ther. 1991;5:139–146. doi: 10.1007/BF03029809. [DOI] [PubMed] [Google Scholar]
- 19.Kondo M, Tsutsumi T, Mashima S. Potassium channel openers antagonize the effects of class III antiarrhythmic agents in canine Purkinje fiber action potentials. Implications for prevention of proarrhythmia induced by class III agents. Japanese heart journal. 1999;40:609–619. doi: 10.1536/jhj.40.609. [DOI] [PubMed] [Google Scholar]
- 20.Varro A, Nakaya Y, Elharrar V, Surawicz B. Effect of antiarrhythmic drugs on the cycle length-dependent action potential duration in dog Purkinje and ventricular muscle fibers. Journal of cardiovascular pharmacology. 1986;8:178. doi: 10.1097/00005344-198601000-00026. [DOI] [PubMed] [Google Scholar]
- 21.Bocchi L, Vassalle M. Characterization of the slowly inactivating sodium current INa2 in canine cardiac single Purkinje cells. Experimental physiology. 2008;93:347–361. doi: 10.1113/expphysiol.2007.040881. [DOI] [PubMed] [Google Scholar]
- 22.Lee CO, Dagostino M. Effect of Strophanthidin on Intracellular Na ion Activity and Twitch Tension of Constantly Driven Canine Cardiac Purkinje Fibers. Biophysical journal. 1982;40:4. doi: 10.1016/S0006-3495(82)84474-3. [DOI] [PMC free article] [PubMed] [Google Scholar]
- 23.Liu N, Rizzi N, Boveri L, Priori SG. Ryanodine receptor and calsequestrin in arrhythmogenesis: what we have learnt from genetic diseases and transgenic mice. Journal of molecular and cellular cardiology. 2009;46:149–159. doi: 10.1016/j.yjmcc.2008.10.012. [DOI] [PubMed] [Google Scholar]
- 24.Moak JP, Rosen MR. Induction and termination of triggered activity by pacing in isolated canine Purkinje fibers. Circulation. 1984;69:149. doi: 10.1161/01.cir.69.1.149. [DOI] [PubMed] [Google Scholar]
- 25.Davidenko JM, Cohen L, Goodrow R, Antzelevitch C. Quinidine-induced action potential prolongation, early afterdepolarizations, and triggered activity in canine Purkinje fibers. Effects of stimulation rate, potassium, and magnesium. Circulation. 1989;79:674. doi: 10.1161/01.cir.79.3.674. [DOI] [PubMed] [Google Scholar]
- 26.Nattel S, Quantz MA. Pharmacological response of quinidine induced early afterdepolarisations in canine cardiac Purkinje fibres: insights into underlying ionic mechanisms. Cardiovascular research. 1988;22:808. doi: 10.1093/cvr/22.11.808. [DOI] [PubMed] [Google Scholar]
- 27.Roden DM, Hoffman BF. Action potential prolongation and induction of abnormal automaticity by low quinidine concentrations in canine Purkinje fibers. Relationship to potassium and cycle length Circulation research. 1985;56:857. doi: 10.1161/01.res.56.6.857. [DOI] [PubMed] [Google Scholar]
- 28.January CT, Riddle JM. Early afterdepolarizations: mechanism of induction and block. A role for L-type Ca2+ current. Circulation research. 1989;64:977. doi: 10.1161/01.res.64.5.977. [DOI] [PubMed] [Google Scholar]
- 29.Zeng J, Rudy Y. Early afterdepolarizations in cardiac myocytes: mechanism and rate dependence. Biophysical journal. 1995;68:949–964. doi: 10.1016/S0006-3495(95)80271-7. [DOI] [PMC free article] [PubMed] [Google Scholar]
- 30.Orth PMR, Hesketh JC, Mak CKH, Yang Y, Lin S, Beatch GN, Ezrin AM, Fedida D. RSD1235 blocks late INa and suppresses early afterdepolarizations and torsades de pointes induced by class III agents. Cardiovascular research. 2006;70:486. doi: 10.1016/j.cardiores.2006.01.026. [DOI] [PubMed] [Google Scholar]
- 31.Fedida D, Orth PMR, Hesketh JC, Ezrin AM. The role of late INa and antiarrhythmic drugs in EAD formation and termination in Purkinje fibers. Journal of cardiovascular electrophysiology. 2006;17:S71–S78. doi: 10.1111/j.1540-8167.2006.00386.x. [DOI] [PubMed] [Google Scholar]
- 32.Kaab S, Nuss HB, Chiamvimonvat N, O'Rourke B, Pak PH, Kass DA, Marban E, Tomaselli GF. Ionic mechanism of action potential prolongation in ventricular myocytes from dogs with pacing-induced heart failure. Circulation research. 1996;78:262. doi: 10.1161/01.res.78.2.262. [DOI] [PubMed] [Google Scholar]
- 33.Jeck C, Pinto J, Boyden P. Transient outward currents in subendocardial Purkinje myocytes surviving in the infarcted heart. Circulation. 1995;92:465. doi: 10.1161/01.cir.92.3.465. [DOI] [PubMed] [Google Scholar]
- 34.Kleber AG, Rudy Y. Basic mechanisms of cardiac impulse propagation and associated arrhythmias. Physiological reviews. 2004;84:431. doi: 10.1152/physrev.00025.2003. [DOI] [PubMed] [Google Scholar]
- 35.Lee YS, Dun W, Boyden PA, Sobie EA. Complex and rate-dependent beat-to-beat variations in Ca2+ transients of canine Purkinje cells. Journal of molecular and cellular cardiology. 2011;50:662–669. doi: 10.1016/j.yjmcc.2010.12.023. [DOI] [PMC free article] [PubMed] [Google Scholar]
- 36.Lado MG, Sheu SS, Fozzard HA. Changes in intracellular Ca2+ activity with stimulation in sheep cardiac Purkinje strands. American Journal of Physiology-Heart and Circulatory Physiology. 1982;243:H133. doi: 10.1152/ajpheart.1982.243.1.H133. [DOI] [PubMed] [Google Scholar]
Associated Data
This section collects any data citations, data availability statements, or supplementary materials included in this article.


