

Abstract
The heterogeneous and chaotic nature of osteosarcoma has confounded accurate molecular classification, prognosis, and prediction for this tumor. The occurrence of spontaneous osteosarcoma is largely confined to humans and dogs. While the clinical features are remarkably similar in both species, the organization of dogs into defined breeds provides a more homogeneous genetic background that may increase the likelihood to uncover molecular subtypes for this complex disease. We thus hypothesized that molecular profiles derived from canine osteosarcoma would aid in molecular subclassification of this disease when applied to humans. To test the hypothesis, we performed genome wide gene expression profiling in a cohort of dogs with osteosarcoma, primarily from high-risk breeds. To further reduce inter-sample heterogeneity, we assessed tumor-intrinsic properties through use of an extensive panel of osteosarcoma-derived cell lines. We observed strong differential gene expression that segregated samples into two groups with differential survival probabilities. Groupings were characterized by the inversely correlated expression of genes associated with G2/M transition and DNA damage checkpoint and microenvironment-interaction categories. This signature was preserved in data from whole tumor samples of three independent dog osteosarcoma cohorts, with stratification into the two expected groups. Significantly, this restricted signature partially overlapped a previously defined, predictive signature for soft tissue sarcomas, and it unmasked orthologous molecular subtypes and their corresponding natural histories in five independent data sets from human patients with osteosarcoma. Our results indicate that the narrower genetic diversity of dogs can be utilized to group complex human osteosarcoma into biologically and clinically relevant molecular subtypes. This in turn may enhance prognosis and prediction, and identify relevant therapeutic targets.
Keywords: osteosarcoma, gene expression profiling, cell cycle, DNA damage checkpoint, tumor microenvironment, canine
1. Introduction
Etiological similarities have been observed between human and canine tumors for a number of cancers [1]. Indeed, we have shown that orthologous molecular abnormalities drive homologous, cytogenetically stable tumors such as chronic myelogenous leukemia [2] in both species, but whether the evolutionary conservation of driver abnormalities also can be identified in cytogenetically chaotic tumors such as osteosarcoma remains an open question. Discreet and reproducible molecular subtypes have been described previously for various human tumors such as diffuse large B-cell lymphoma [3] and breast cancer [4]; however, multiple studies using genome-wide approaches have failed to show consistent, orthologous signatures that define molecularly distinct subtypes of osteosarcoma [5–11]. Nonetheless, recent studies identified (1) a minimal common predictive gene signature in human soft tissue sarcomas [12], (2) predictable commonalities between humans and dogs when gene expression profiles from normal liver, kidney, and lymph node were compared to those from osteosarcoma [13], and (3) differential gene expression among dog tumors with differential times to metastasis [14]. Here, we conducted gene expression analysis using a subset of canine osteosarcoma samples, applying diverse strategies to further reduce complexity and genetic heterogeneity, and then used these data to identify functionally and biologically significant subtypes of human osteosarcoma.
2. Materials and Methods
2.1 Canine sample accrual
Samples were obtained from dogs with naturally occurring primary appendicular osteosarcoma recruited over a time period of 10 years (1999–2009). Tumor samples represented every geographical region in the United States, with a recruitment strategy designed around two breeds (Rottweilers and Golden Retrievers), but including samples from other high-risk breeds. Specimens were obtained as part of medically necessary clinical procedures prior to initiation of therapy with owner consent and under protocols approved by the University of Minnesota Institutional Animal Care and Use Committee and the Colorado Multiple Institutional Review Board. All samples were obtained prior to any treatment with cytotoxic chemotherapy drugs (naïve disease). For five dogs, metastatic lung tumor samples were obtained at necropsy. A summary of demographics and tumor morphology for the 79 dogs recruited in this time period, and indicating the 27 samples used for microarray analyses, are shown in Supplementary Table 1.
2.2 Derivation and maintenance of cultured cells, and cytotoxicity assays
Processing of tumor specimens and culture of cells derived from these tumors has been described [15, 16]. All cell lines were derived in the Modiano lab from primary specimens with a verified histopathologic diagnosis. The ontogeny of the cell lines was authenticated by immunostaining for expression of alkaline phosphatase and osteocalcin. Canine origin was confirmed cytogenetically using metaphase and array-based comparative genomic hybridization and fluorescence in situ hybridization with canine specific probes in the Breen lab. Half maximal inhibitory concentrations for paclitaxel were determined using the MTT assay in cells cultured for 72 hr in the presence or absence of the drug [17].
2.3 RNA isolation and array hybridization
RNA was isolated from cryopreserved cells and tissue samples, quantified, and assessed for quality as described previously [18]. The twenty-seven cell lines and six primary tumors used were all suitable for microarray analysis based on cell viability and RNA quality (RIN >6.5). Samples were hybridized to Affymetrix Canine_2.0 gene chips as described [18]. Two samples (OSCA-25 and OSCA-71) were done in duplicate, prepared by different operators at different times and run on different microarray batches to control for intrinsic variance in cell lines, for variance in operator technique, and for batch effects. The correlation coefficient (r2) for expression values between duplicate samples was >0.95 in both cases. To minimize redundancy, the values shown for these two samples are averages from the two microarrays for each.
2.4 Data Analysis
Following hybridization, each chip passed quality assurance and control procedures using Affymetrix quality control algorithms provided in Expressionist Refiner module (Genedata, Basel, Switzerland, v. 5.2 and 5.3). Probe signal levels were quantile-normalized and summarized using the GeneChip - Robust Multichip Averaging algorithm [19]. Resulting normalized files were imported into Expressionist Analyst module (v. 5.3). Affymetrix probe IDs were mapped to corresponding canine Entrez Gene IDs using Affymetrix NetAffx EntrezGene Annotation. Canine Entrez Gene IDs were mapped to 17,482 gene names using data obtained from Entrez Gene FTP server update Dec 21, 2009. Canine gene names were mapped to their associated human gene names by direct name matching.
Prior to unsupervised hierarchical clustering, normalized chip data were median-centered and log2-transformed. Clustering was done using Gene Cluster 3.0 for Mac OS X (C Clustering Library 1.47) correlation based on average linkage. Gene Cluster 3.0 data were visualized in Java TreeView version 1.1.3. Two group T-tests were done to determine genes that were differentially expressed between the two groups. Multiple testing correction was done using the Benjamini-Hochberg (BH) correction. Genes with a p-value <0.0068 (BH p-value ≤0.05) and average fold-change >3 were identified for further analysis. Gene expression data were deposited in GEO (accession # GSE27217).
2.5 Canine osteosarcoma data
Two additional sets of data files with 15 canine osteosarcoma samples each were imported from GEO into Expressionist Analyst module for analysis. One set (GSE16088) was profiled on the Affymetrix Canine_1.0 platform [13], and the other (GSE24251) on the Affymetrix Canine_2.0 platform [14].
2.6 Human osteosarcoma data
Five sets of data files from human osteosarcoma were imported into Expressionist Analyst module for analysis. A set of 31 samples [8] was retrieved from the Translational Genomics Research Institute website (http://tgen.org/research/index.cfm?pageid=663). The second set of 20 samples of normal bone and osteosarcoma profiled on the Illumina bead array was from patient samples originating at the University of Minnesota. The third set of 24 osteosarcoma samples was from Cleton-Jansen et al [9], available at http://www.nature.com/bjc/journal/v101/n11/suppinfo/6605405s1.html?url=/bjc/journal/v101/n11/full/6605405a.html. The fourth set of 27 osteosarcoma samples [11] and the fifth set of 34 samples [13] were obtained from GEO (GSE14827 and GSE16091, respectively). For all five independent sets, significantly differentially expressed canine genes were mapped to human genes by name. All corresponding human genes were used for unsupervised clustering of experiments as described above.
2.7 Network identification and canonical pathway analysis of differently expressed genes
Ingenuity Pathway Analysis (IPA) software v8.6 (Ingenuity Systems, Redwood City, CA) was used to define functions and canonical pathways specifically enriched in the sets of genes using BH multiple testing corrections to assess significance.
2.8 Real-time quantitative reverse transcriptase PCR
Elimination of genomic DNA and reverse transcription were both carried out using QuantiTect Reverse Transcription Kit (Qiagen, Valencia, CA). Real-time quantitative reverse transcriptase PCR (qRT-PCR) was performed on an Eppendorf Mastercycler ep realplex with FastStart SYBR Green Master Mix Protocol (Roche, Indianapolis, IN). Primer sequences are provided in Supplementary Table 2. GAPDH was used as the reference standard for normalization and relative levels of steady state mRNA were established using the comparative [delta][delta]Ct method [20]. The transcript levels in cells from the osteomyelitis sample (OSCA-41) were adjusted to 1 and served as the reference. The relationship between array and qRT-PCR values for the three transcripts of interest were analyzed using Pearson s correlation.
2.9 Immunostaining
Decalcified, fixed and paraffin embedded tissues from which cell lines were derived were used to stain sections as described (IHC Services, Smithville, TX) [21]. Cyclin B2 expression was detected using antibody sc-22776 (H-105) (Santa Cruz Biotechnology, Santa Cruz, CA).
2.10 Statistics
Descriptive statistics for variables of breed, gender, age at diagnosis, histological subtype and treatment regimen were performed. Categorical data are expressed as percentages, while continuous data are expressed as medians (ranges). Fisher s exact test was performed to compare data from the two sample subgroups (Branch A and Branch B). Overall survival times were known for 21 of 26 osteosarcoma dogs included in the gene expression profiling analysis. Five dogs were lost to follow up and the dog identified as OSCA 41 was successfully treated for osteomyelitis. Survival time was defined as the interval from diagnosis until death. All deaths were disease-related and none of the dogs had secondary rescue after the diagnosis of metastatic disease. Kaplan-Meier analysis was done using Prism5 from GraphPad software Inc. (San Diego, CA). Statistical significance was calculated using the log rank test and a p< 0.05 was considered significant.
3. Results
3.1 Gene expression profiling segregates canine osteosarcoma into two distinct molecular groups
Osteosarcoma is a morphologically and clinically heterogeneous disease. Specifically, the molecular events responsible for the onset and progression of osteosarcoma are incompletely understood. Osteosarcoma occurs naturally in dogs, with a strong breed preference, providing opportunities to assess the role of heritable factors in causation and tumor behavior [22]. To take advantage of this opportunity, we prospectively recruited a cohort of 79 dogs and used a subset of 27 representative samples, including 26 osteosarcomas and one sample from a dog with osteomyelitis (Table 1) to generate genome-wide gene expression profiles using the Affymetrix Canine 2.0 platform.
Table 1.
Metadata data from complete cohort of 79 dogs (78 recruited with primary appendicular osteosarcoma and 1 with osteomyelitis) and restricted group of 27 dogs analyzed by gene expression profiling
| Variable | Recruited Cohort (N =79) | GEP Analysis Group (N= 27) |
|---|---|---|
| Number (%3) | Number (%) | |
| Male | 38 (48%) | 15 (56%) |
| Female | 39 (49%) | 11 (41%) |
| Unknown | 2 (3%) | 1 (3%) |
| Median Age at Diagnosis (Years) | 8.03 | 6.14 |
| Range of Age (Years) | 1–13.91 | 2–11.2 |
| Golden Retrievers | 15 (19%) | 7 (26%) |
| Other | 27 (34%) | 7 (30%) |
| Osteoblastic | 45 (57%) | 18 (66%) |
| Fibroblastic | 16 (20%) | 4 (15%) |
| Chondroblastic | 9 (11%) | 3 (11%) |
| Mixed | 4 (5%) | 1 (4%) |
| Osteomyelitis | 1 (1%) | 1 (4%) |
| Unknown | 4 (5%) | 0 (0%) |
| Median Survival (months) | ||
| All Dogs | 4.06 | 4.96 |
| Standard of care1 | 10.36 | 11.01 |
| Limb amputation | 3.85 | 1.18 |
| Palliative care2 | 1.15 | 0.18 |
Removal of primary tumor by amputation or limb-sparing surgery with adjuvant chemotherapy
Pain medication, radiation therapy, or alternative therapies (herbal, homeopathic, etc.)
Percents may not add to 100 due to rounding
We focused our attention on tumor cell-autonomous gene signatures by using low-passage cell lines, effectively reducing the intrinsic sample heterogeneity by filtering out the stromal contributions [23]. Past studies of genome wide profiling in osteosarcoma have primarily used supervised analyses according to pre-set criteria (“normal” vs. tumor, chemosensitivity or percent necrosis, patient survival, anatomic location, primary vs. metastatic site, etc.). Here, we used an unbiased approach to analyze genome wide gene expression data and reveal biologically distinct sub-types of osteosarcoma. Specifically, we did not pre-assign samples into groups, but instead allowed samples to cluster according to the degree with which they shared similar gene expression profiles. Tumor cell line samples segregated into two distinct branches (Figure 1A), Branch A (N=16 osteosarcoma) and Branch B (N=10 osteosarcoma and the osteomyelitis sample). Statistical analyses between these two groups identified 282 genes with a BH p value ≤0.05 and showing a 200% (3-fold) average change that were responsible for the clustering (Supplementary Table 3). Two reciprocally expressed gene clusters were observed, represented as “Gene Cluster 1” and “Gene Cluster 2” in a standard heat map (Figure 1B).
Figure 1. Unsupervised hierarchical clustering defines two osteosarcoma subtypes characterized by two reciprocal gene clusters.

(A) Unsupervised Clustering using expression data corresponding to 17,482 Entrez Gene IDs reveals two major branches in 26 dogs with osteosarcoma and one dogs with non-malignant osteomyelitis (OSCA 41), identified respectively as Branch A and Branch B in the toe bar. (B) Heat map showing 282 differentially expressed transcripts (p ≤0.0068, mean average fold-change >3) divided into two reciprocally expressed gene clusters (Gene Cluster 1 and Gene Cluster 2) between dogs in Branch A and Branch B. Heat map colors represent median-centered fold change expression following log2 transformation (a quantitative representation of the colors is provided in the scale at the bottom). Up-regulated genes are shown in red and down-regulated genes are shown in green.
The segregation of samples into distinct groups was robust. Whether we used the most variable genes or included all genes profiled, we observed the same grouping of the samples, suggesting that only a few biological processes drove this separation of osteosarcoma into subgroups. Ingenuity Pathways analysis (IPA) was used to systematically identify functional processes associated with the 282 genes. The top functional annotations, corrected by BH multiple testing, indicate that these genes as a group are strongly associated with cancer related pathways (Table 2).
Table 2.
Ingenuity pathway analysis of 282 transcripts showing significant association with functional cancer pathways
| IPA Function Annotation | B-H p-value |
|---|---|
| Cell division process | 3.21E-21 |
| Cell division process of chromosomes | 5.78E-18 |
| Cell stage | 6.95E-18 |
| Mitosis | 7.49E-16 |
| Cell stage of cervical cancer cell lines | 7.88E-14 |
| Cell cycle progression | 8.98E-14 |
| Segregation of chromosomes | 4.93E-13 |
| Neoplasia | 6.50E-11 |
| Tumorigenesis | 6.50E-11 |
| Cell division process of eukaryotic cells | 1.44E-10 |
| Cell division process of tumor cell lines | 1.52E-10 |
| Ploidy | 3.55E-10 |
| Mitosis of tumor cell lines | 5.43E-10 |
| Cancer | 6.43E-10 |
| Delay in cell stage | 1.33E-09 |
| Colon cancer | 1.33E-09 |
| Alignment of chromosomes | 1.36E-09 |
| Cell division process of cell lines | 6.47E-09 |
| Colorectal cancer | 7.46E-09 |
| Metabolism of DNA | 1.30E-08 |
| Primary tumor | 2.31E-08 |
| Carcinoma | 3.68E-08 |
| Malignant tumor | 4.60E-08 |
| Tumor | 5.04E-08 |
| Initiation of replication of DNA | 6.95E-07 |
| Formation of mitotic spindle | 1.03E-06 |
| Segregation of sister chromatids | 1.32E-06 |
| Proliferation of cells | 1.41E-05 |
| Checkpoint control | 2.42E-05 |
| Cytokinesis | 6.51E-05 |
To further validate the array data, we selected a gene that showed significantly different expression, with ~13-fold higher expression in Branch A (CCNB2), another with ~3-fold higher expression in Branch A (CHEK2), and a third where the difference in expression between Branch A and Branch B was <3-fold (CAD6), and assessed the levels for each in nine samples run on the array using qRT-PCR. We then plotted the normalized array signal (relative to GAPDH) for each gene as a function of its relative qRT-PCR-based mRNA level (relative to GAPDH). Correlation values (R2) for these three genes were, respectively, 0.86, 0.72, and 0.83 (Figure 2). We then established the relevance of gene expression to intact tumors using immunohistochemical staining for Cyclin B, using expression of the intermediate filament Vimentin as a control, in three representative primary tumors selected for “high”, “intermediate”, and “low” expression, and in the sample from the dog with osteomyelitis (Figure 3). The data show that, while Vimentin expression in osteoblasts and osteocytes was similar among all the samples, expression of Cyclin B2 protein was consistent with the levels predicted from the arrays and the qRT-PCR experiment.
Figure 2. Correlation between qRT-PCR and array data in a subset of nine osteosarcoma cell lines.
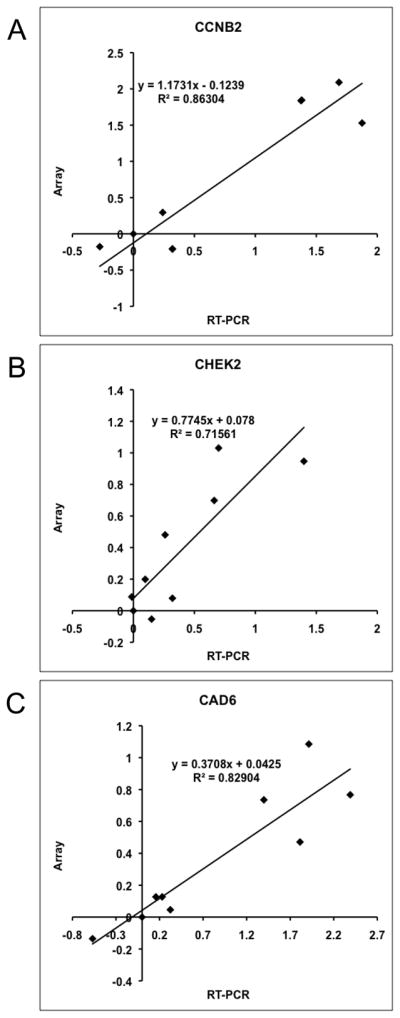
Pearson correlation for expression of (A) CCNB2 (R2=0.86), (B) CHEK2 (R2=0.72); and (C) CADH6 (R2=0.83) genes. Each graph shows expression fold differences following normalization to GAPDH and relative to OSCA 41 (non-malignant osteomyelitis sample) for both the qRT-PCR on the x-axis and the microarray results on the y-axis. Data are shown as log10 for both quantification methods.
Figure 3. Immunohistochemistry for Cyclin B2 in primary tumors.

Primary tumor samples corresponding to the dogs for OSCA 41 (panel A, osteomyelitis showing low CCNB2 gene expression), OSCA 25 (panel B, Branch A-high CCNB2 gene expression), OSCA 32 (panel C, Branch B- intermediate CCNB2 gene expression), and OSCA 57 (panel D, Branch B-low CCNB2 gene expression) were stained using H&E or antibodies against Vimentin (control) or Cyclin B2. (E) mRNA levels (expressed as array units) for Vimentin and CCNB2 in the lines from the same tumor samples.
3.2 Cell cycle and microenvironment interaction gene clusters drive molecular and pathologic stratification of canine osteosarcoma samples
We applied Ingenuity Pathway Analysis (IPA) to identify molecular pathways defined by Gene Cluster 1 and Gene Cluster 2. Cluster 1 genes (n=125), which were over-expressed in samples from Branch A dogs, were significantly enriched for genes involved in mitosis, chromosome segregation, and mitotic spindle formation (Supplementary Figure 1A). Cluster 2 genes (n=157), which were over-expressed in samples from Branch B dogs, were annotated to functions associated with the interactions that occur between cancer cells and their microenvironment, such as cell migration, adhesion, angiogenesis, proliferation, inflammation, and cell death (Supplementary Figure 1B).
3.3 Differential gene expression signatures are preserved in intact canine osteosarcoma
We next sought to determine if the cancer cell-autonomous gene expression signatures we identified in our panel of canine osteosarcoma cell lines were present in intact tumor tissues. We profiled six primary canine tumor tissues on Affymetrix Canine_2 gene chips and used the 282-gene set described above to perform unsupervised hierarchical clustering of cell lines and tumor tissues together. The branches and the reciprocal gene clusters were preserved in this analysis with primary tumor samples segregating into both branches (Figure 4A).
Figure 4. Gene expression signature with inverse gene clusters is present in three independent cohorts of dogs with osteosarcoma.

(A) Heat map of canine samples from Figure 1B with six additional samples derived from whole tumors. Data are shown relative to expression in cell lines. Yellow and blue tags identify specific gene vectors in the signature for tracking in panels B and C. Color intensity shows inter-sample variation. (B) Heat map of 15 canine samples from GEO GSE1608812 [13] using the gene list from Supplementary Table 3. The annotation for Affymetrix Canine1.0 array platform is limited, allowing only 31 genes to be mapped by name. (C) Heat map of 15 canine samples from GEO GSE24251 [14] using the gene list from Supplementary Table 3. The full complement of genes in Supplementary Table 3 was mapped to this cohort. Inverse gene expression patterns are present and gene vectors cluster together. Toe bars indicate the corresponding Branches (A and B), and clusters with predominance (<90%) of genes from Gene Clusters 1 and 2 are indicated for each sample cohort.
To track the pattern of expression observed in our samples in other, diverse sample sets, we used a “gene vector-based” bioinformatic analytical strategy. We assigned a yellow or blue tag to each gene vector in Cluster 1 and Cluster 2, respectively, where the color intensity reflected the relative variation in expression observed in our samples. This methodology allows direct comparative visualization of our vector patterns in independently derived sample sets. We hypothesized that if the gene signature was relevant, the expression pattern would be clearly observable in additional datasets where the blue and yellow tags would cluster together independent of our results, thus confirming our observations.
As a first proof of this principle we obtained canine osteosarcoma gene expression profiles generated in two previous studies from dogs with osteosarcoma diagnosed and treated at Colorado State University, which were analyzed using both first- and second-generation Affymetrix arrays [13, 14]. The first-generation arrays were incompletely annotated, so we were only able to map 31 genes; however, the patterns observed in our data were clearly visible in this additional canine osteosarcoma tumor dataset, and the vector tags clustered together (Figure 4B). Utilizing the additional OS samples derived from the Canine2.0 platform, the full 282-gene signature created two branches with >90% preservation of the vector clustering and intensity on the Y-axis (Figure 4C) indicating that our results also were observable in independent canine datasets.
3.4 The restricted gene expression signature generated from analysis of canine osteosarcoma highlights molecularly homologous groups in independent cohorts of humans with osteosarcoma
To determine if the molecular subtypes found in canine osteosarcoma also were present and relevant to human osteosarcoma, we accessed published gene expression data from five independent cohorts of human osteosarcoma and name mapped the 282-gene vectors to their human homologues. These cohorts were geographically and ethnically diverse [9, 11, 13, 24], and each used a distinct platform for analysis. Unsupervised hierarchical clustering for each of the human cohorts was consistent with the prediction of molecular homology, resulting in similar clustering patterns for osteosarcoma samples to that observed in our dog cohort (Figure 5). Approximately 50% of the gene vectors (140) were always present in each group, and as we saw for the canine tumor samples, >90% remained in their respective clusters showing comparable changes in the intensity of expression for the two major sample branches (see blue and yellow tags for each gene vector in Figure 5).
Figure 5. Gene expression signature with inverse gene clusters is present in five independent and geographically diverse cohorts of humans with osteosarcoma.

(A) The heat map of canine samples from Figure 4A is repeated for reference. Yellow and blue tags identify specific gene vectors in the signature for tracking in panels B-E. Color intensity shows inter-sample variation. (B) Unsupervised clustering of 31 samples from Mintz [8], originating from New York, USA, profiled on the Affymetrix HG_U95Av2 platform using log transformed expression data. (C) Unsupervised clustering of two normal bone tissue samples (indicated by purple box in bottom toe bar) and a cohort of 15 primary osteosarcoma samples (indicated by the light blue box) originating from Minnesota, USA, and three human osteosarcoma cell lines, two in duplicate (indicated by the red box) profiled on an Illumina bead array using log-transformed expression data. (D) Unsupervised clustering of samples from Cleton-Jansen [9], including 25 patients with osteosarcoma originating from the Netherlands profiled on the Affymetrix Human 133A platform using log transformed expression data. (E) Unsupervised clustering of samples from Kobayashi [11], including 27 Japanese patients with osteosarcoma profiled on the Affymetrix Human U133 Plus 2.0 platform using log transformed expression data. F) Unsupervised clustering of human osteosarcoma samples from Paoloni [13] including 34 pre-treatment primary tumors profiled on the Affymetrix HG 133A platform using log transformed data. Toe bars indicate the corresponding Branches (A and B), and clusters with predominance (<90%) of genes from Gene Clusters 1 and 2 are indicated for each sample cohort.
The subset of canine cell lines and tissues from Figure 4 is reproduced in Figure 5A. Patient samples in Figure 5B from a cohort of osteosarcoma patients from New York, USA [8] showed clear separation into two branches with similar profiles to that seen in our canine cohort. Figure 5C included two samples of normal bone (in duplicate), fifteen primary tumor samples from Minnesota, USA, and three immortalized human osteosarcoma cell lines (in duplicate). Notably, the normal bone samples in Figure 5C did not simply cluster together alone, but instead they were part of a subgroup that included six osteosarcoma samples. These samples had a gene expression signature that resembled canine Branch B, which itself included the osteomyelitis (non-malignant) sample. The observation that non-malignant samples clustered together with a subset of osteosarcomas in both dogs and humans indicates that the gene expression signature associated with Branch B was not exclusively a “normal bone” signature. Instead, this suggests that even after transformation, certain osteosarcomas retain characteristics that resemble normal bone. This is consistent with the degree of differentiation and pathological stratification that are defined for other tumors such as breast cancer and myeloid leukemia, for example, but that had not previously been achieved for bone cancer. Conversely, the immortalized cell lines in Figure 5C clustered together and showed a gene expression signature similar to canine Branch A samples, suggesting the cell lines originated from - or after selection in culture acquired features of - tumors that retained fewer characteristics associated with normal bone cells. Figure 5D illustrates samples from a European cohort of osteosarcoma patients [9] that was previously shown to show enrichment of genes associated with cell cycle regulation and DNA replication in osteosarcoma samples [9]. Whereas unsupervised analysis by Cleton-Jansen et al was unsuccessful to define molecular subgroups in this cohort, application of our restricted signature allowed for robust, unbiased separation of this cohort without into two defined subgroups driven by patterns of gene expression. Figure 5E shows data from 27 tumor samples from Japanese osteosarcoma patients [11]. Here again, the use of our restricted signature unmasked two distinct subgroups in this cohort that were not evident from the original analysis. Figure 5F shows data from 34 samples from the National Institutes of Health (Maryland, USA), reported by Paoloni et al [13]. In this case, our signature once again generated two subgroups defined by expression of the two conserved and inversely related gene clusters.
3.5 Molecular subgroups of canine osteosarcoma predict biological behavior
To establish the potential clinical and biological relevance of the molecular grouping we identified in the canine samples (section 3.1), we evaluated associations between the two branches and population demographics, histopathological classifications, and overall survival (Table 3). Among the variables examined, overall survival was statistically significantly different (p<0.03), and breed showed a modest trend (p = 0.12 for Rottweilers vs. non-Rottweilers), between Branch A and Branch B (Table 3). The significant difference in overall survival between the 21 dogs with osteosarcoma and follow-up information in Branch A and Branch B also was evident using Kaplan-Meier probability analysis and the log rank test (p<0.01, Figure 6), with Branch A showing worse outcome than Branch B. Not surprisingly, the osteomyelitis sample clustered with Branch B samples, suggesting that tumor cells from dogs with longer overall survival were more similar to non-malignant, reactive osteoblasts than to tumor cells from dogs with shorter overall survival. This difference remained (p=0.01) when we included only the 15 dogs treated with standard of care (amputation of the affected limb and adjuvant chemotherapy using doxorubicin or carboplatin), indicating the separation into two branches was driven by tumor behavior, and in this analysis, segregation into Branch A or Branch was independent of treatment.
Table 3.
Demographic Characteristics of Dogs and Correlation with Clustering
| Variable | No. of Cases | P - value | |
|---|---|---|---|
| Branch A(n=16) | Branch B (n= 11) | Fisher’s Exact Test | |
| Gender | 0.53c 0.60d |
||
| Male | 10 | 5 | |
| Female | 6 | 5 | |
| Unknown | 0 | 1 | |
| Age at Diagnosis (Months)a | 0.53c 0.69d |
||
| ≤ 7 | 9 | 4 | |
| > 7 | 7 | 6 | |
| Unknown | 0 | 1 | |
| Histology | 0.53 | ||
| Osteoblastic | 12 | 6 | |
| Chondroblastic | 1 | 2 | |
| Fibroblastic | 2 | 2 | |
| Mixed | 1 | 0 | |
| Osteomyelitis | 0 | 1 | |
| Treatment Regimen | 0.55 | ||
| Standard of care | 9 | 6 | |
| Limb amputation | 2 | 1 | |
| Palliative care | 3 | 0 | |
| Unknown | 2 | 3 | |
| Survival (Months)b | 0.02 | ||
| ≤ median | 10 | 1 | |
| > median | 4 | 6 | |
| Breed | 0.12e 0.22f |
||
| Rottweiler | 10 | 3 | |
| Golden Retriever | 3 | 4 | |
| Other | 3 | 4 | |
Median age at diagnosis for all dogs = 6.14 years
Median survival for all dogs with known survival outcome (includes all treatment types) = 4.96 months
Includes unknowns
Excludes unknowns
Rottweiler vs. non-Rottweiler
Rottweiler vs. Golden Retriever vs. Other
Figure 6. Unsupervised hierarchical clustering defines two clinically significant groups in canine osteosarcoma.

The hierarchical cluster from Figure 1A is repeated for reference, along with Kaplan-Meier survival (KM) and log rank analysis of 21 dogs in the cohort with known survival outcomes. The toe bar defines groups for the KM analysis. Dogs from which OSCA 1, OSCA 8, OSCA 11, OSCA 56, and OSCA 73 samples were derived were lost to follow-up (no survival data was available) and the dog from which OSCA 41 was derived had osteomyelitis. The median survival time for dogs in Branch A was ∼2.8 months, and the median survival time for dogs in Branch B was ∼14.0 months.
The overexpression of a G2/M transition and DNA damage gene signature by samples in Branch A might have been driven by differences in the degree of tumor aneuploidy or by the rate of proliferation. Neither sample group (Branch A and Branch B) showed consistent differences with regard to DNA copy number aberrations (A. Angstadt et al, manuscript submitted), and most sample genomes were cytogenetically chaotic [15], suggesting groupings were not due to aneuploidy. We hence examined in vitro sensitivity to the mitotic poison paclitaxel in six cell lines (three from each branch). Table 4 shows the half-maximal inhibitory concentration for growth in three paclitaxel-sensitive human cell lines was <25 ng/ml (<30 nM). In contrast, only one of six canine osteosarcoma cell lines tested (OSCA-71, which clustered to Branch A) showed paclitaxel sensitivity in this nM dose range. Indeed, chemosensitivity was not predictive for outcome and it was independent of the gene signature, suggesting the differential gene expression was not driven simply by cellular proliferation rate.
Table 4.
Half-maximal inhibitory concentration of paclitaxel for canine osteosarcoma cell lines from Branch A and Branch B in vitro
| Cell Line | Paclitaxel IC50 (ng/ml) |
|---|---|
| U937 (human leukemia) | 1 |
| HL-60 (human leukemia) | 25 |
| K562 (human leukemia) | 20 |
| OSCA-19 (Branch A) | 10,000 |
| OSCA-25 (Branch A) | NR* |
| OSCA-71 (Branch A) | 15 |
| OSCA-17 (Branch B) | 10,000 |
| OSCA-23 (Branch B) | NR |
| OSCA-32 (Branch B) | 30,000 |
NR = not reached (>50,000)
We showed previously that dog breeds can influence tumor genotypes in lymphoma [25] and osteosarcoma [16], as well as gene expression phenotypes hemangiosarcoma [18]. In addition, Liao et al [26] showed that ~80% of Rottweilers carry a constitutional mutation in c-MET, which might affect signaling and behavior in osteoblasts and osteosarcoma cells. Thus, we predicted that osteosarcoma gene expression profiles might show a similar association with breed in our cohort study, since the sample population included a Rottweiler bias. The major branches observed by hierarchical clustering (of samples) showed 10/13 Rottweilers included in the analysis segregated to Branch A and 3/13 segregated to Branch B (Supplementary Figure 2A). We therefore examined if these two variables (Rottweiler, tumor with aggressive biological behavior and worse outcome) were associated or independent.
The hierarchical clustering was based on the analysis of all 17,482 informative genes. Thus, multiple independent factors could account for the segregation of samples into the two branches. In other words, there were three factors that could show a dependent relationship (A=C, B=C, A=B) or an independent relationship (A=C, B=C, A≠B). If the observed contribution from “outcome” to the organization of the clusters were dependent on Rottweilers having poor survival, then Rottweilers in general also should have poor survival. This hypothesis was tested and rejected in a previous multi-institutional retrospective study [27]. Nonetheless, we evaluated overall survival time of Rottweilers vs. non-Rottweiler dogs from both the 26-dogs with osteosarcoma in the profiled subset and in the full 79-dog cohort. Our analysis similarly rejected the hypothesis that Rottweiler breed was the main driver for survival, since no survival difference was detectable in survival between Rottweilers (9/13 with survival annotation) and non-Rottweilers (12/13 with osteosarcoma and survival annotation) included in the array (Supplementary Figures 2B) or between Rottweilers (22/37 with survival annotation) and non-Rottweilers (27/42 with survival annotation) in our larger sample set (Supplementary Figure 2C). This suggests that being a Rottweiler (heritable background) and having a tumor with aggressive biological behavior (worse outcome) were not associated and each may have contributed independently to the hierarchical clustering. In other words, our data are most compatible with the model A=C, B=C, A≠B, and that even though tumors from Rottweilers might share some molecular features, they don t necessarily share biological behavior.
We next examined the correlation between the two molecular subgroups and biological behavior or outcomes in the annotated canine and human cohorts (Figures 4 and 5). O Donoghue et al selected dogs based on time to metastasis after standard of care. The groups resulting from unsupervised analysis of the data from this cohort contained a mixture of dogs that had early metastasis and delayed metastasis. The median time to metastasis in the groups corresponding to Branch A (worse outcome) and Branch B (better outcome) was 100 and 360 days (3.26 and 12 months), respectively (Figure 4C). This difference represents a strong trend, but the sample size was not large enough to reach statistical significance. Mintz et al [8] originally analyzed samples from the New York cohort supervised according to chemosensitivity as defined by percent necrosis using the Huvos grading system. Their supervised gene expression analysis allowed them to identify a 104-gene chemoresponsive signature from these samples. As predicted by the data in Table 4, the chemosensitivity signature did not generally overlap our biological signature, likely reflecting the variety of factors that influence tumor necrosis in vivo and the inconsistent predictive value for percent necrosis [8, 9]. Cleton-Jansen et al [9] carried out supervised expression analysis according to chemosensitivity and clinical response (5-year survival). Their data did not show differences in gene expression profiles based on either parameter. When we applied our gene signature to this cohort, the distinct pattern of two inversely related gene clusters seen in our canine cohort was evident: the osteosarcoma samples clustered into two subgroups (Figure 5D), with the subgroup that was equivalent to Branch B including fewer patients with metastatic disease (5 of 12 vs. 8 of 13) and retaining a pattern that was more similar to that seen in normal cells in this data set (data not shown). Similarly, supervised expression analysis was performed with the Japanese osteosarcoma cohort according to the occurrence of metastatic disease within four years in 19 of 27 samples [11]. We included all 27 samples in our unsupervised analysis (Figure 5E). The samples once again segregated into distinct subgroups of osteosarcoma with no predictive value for initial chemosensitivity, but 6 of 14 patients in the predicted “worse outcome” (Branch A) group showed metastasis by four years, compared to 2 of 15 in the predicted “better outcome” (Branch B) group. Figure 5F shows data from 34 samples reported by Paoloni [13] with known outcome. After unsupervised expression analysis of these samples with our signature, analysis of survival trends between the two resulting groups (Figure 7) showed that early therapy failures were more common among patients in Branch A (8/18 patients dead and one censored, or 55% survival at 1,200 days) as compared to patients in Branch B (3/16 patients dead and two censored, or 80% survival at 1,200 days). The relatively small sample size would require an unrealistically large difference in survival to reach significance using the log-rank test. Nevertheless, the data from this cohort are consistent with the observations for the cohorts in Figure 5D and Figure 5E, suggesting that grouping human osteosarcomas according to this gene expression signature can predict tumor behavior as it does in canine osteosarcomas.
Figure 7. Kaplan-Meier survival analysis using groups defined by the clustering of orthologous canine genes in human samples.

Annotated survival data are from Paoloni [13]. (A) Overall survival for all patients at >4,900 days; censored patients that were alive at last follow-up are shown as tick marks above each line. The red line represents samples from Branch A and the gray line represents samples from Branch B. (B) Tabulation of early failures (deaths by 1,200 days, or ∼3 years) in 200-day intervals from patients in Branch A (red) and Branch B (gray), respectively.
4. Discussion
The mechanisms that control osteosarcoma etiology and progression remain incompletely understood. This disease is predominantly seen in children and adolescents, and occurs naturally with greater frequency in dogs. Considering the similar clinical presentation, we postulated evolutionarily conserved molecular traits for this disease would be present in both species. Thus, the narrower genetic diversity of dogs would enhance our ability to define biologically and clinically significant traits.
Gene expression profiling allowed us to define two distinct molecular subgroups of canine osteosarcoma. Recent data showing that cells derived from Branch A tumors show more facile and aggressive growth in laboratory animals, including spontaneous metastasis after orthotopic invasion further support this pathological stratification [28]. Furthermore, the clustering defined by this signature was seen repeatedly in three and five unrelated data sets from dogs and humans, respectively, although the human subsets showed more extensive branching into smaller subsets, suggesting osteosarcoma may have more complex behavior in humans. The apparent difference in tumor heterogeneity between humans and dogs could be explained by the reduced complexity of the canine genetic structure, where unlike humans, risk haplotypes are more firmly embedded in the defined populations we call breeds [29]. Thus, the contribution of any allele to modulate the biological behavior of osteosarcoma is smaller in humans than it is in dogs, resulting in greater complexity of inherited risk factors that in turn manifest as increased inter-tumor and intra-tumor heterogeneity. Nonetheless, when we consider known differences between canine and human osteosarcoma, such as the age of disease onset and the palliative vs. curative treatment applied to these species, respectively, the similarities observed in their molecular signatures and associated biological behaviors are remarkable. Clearly, this signature was revealed in our analyses by eliminating stromal components through the use of tumor cells grown in culture, as well as by using canine samples, which reduced the intrinsic variation from heterogeneous genetic backgrounds of humans, in an unbiased (unsupervised) manner. Despite repeated attempts and the application of numerous algorithms, previous unsupervised analyses failed to segregate samples from intact tumor tissues (i.e., including tumor cells and stroma) from dogs or humans into meaningful groups. Thus, even though the gene expression signature was present in these intact tumor samples from both species, it was masked by stromal signatures can modulate the balance of expression for some of the genes [30]. The significance of this restricted gene list is further underscored by its capacity to segregate independent cohorts into distinct branches, where each branch likely represents a molecular subtype with unique and potentially predictable biological behavior.
At this time, incomplete data annotation in the cohorts precludes definitive assessment of the prognostic value for these signatures, but the trends suggest that this signature or components thereof may be of prognostic significance both in humans and dogs, underscoring the similarities of this naturally occurring disease in both species. It is especially intriguing that the cell cycle component of this profile shows exquisite overlap with a predictive signature called CINSARC (Complexity Index in SARComa) recently defined for soft tissue sarcomas. Chibon et al showed that CINSARC predicted survival more robustly than the FNCLCC histologic grading system across multiple soft tissue sarcomas, gastrointestinal stromal tumors, breast carcinomas, and lymphomas [12]. The CINSARC signature consists of 67 cell cycle genes, of which 40 are present as orthologs in Cluster 1 from our study, and an additional seven are members of families with retained homologs (e.g., three CENP family genes, CHEK1, PAK3, SGOL2, and SMC2). Most genes in this signature are coordinately regulated during the G2/M transition and/or as part of the DNA damage checkpoint. Our Gene Cluster 1 and CINSARC have many elements in common with prognostic signatures that also have been identified in urothelial cancer [31] and melanomas with B-Raf mutations [32]. Tumors with hyperactive DNA damage responses also possess greater chemoresistance [33], possibly reflecting enrichment of cancer stem cells [34]. This is not only a theoretical association derived from work in vitro, in silico, or in transgenic models; empirical data confirmed that induction of DNA damage responsive genes after radiation therapy, was associated with significantly worse survival outcomes in two independent cohorts of breast cancer patients [35].
The reason why tumors with elevated cell cycle and DNA damage signatures show more aggressive progression than tumors with elevated expression of genes that modulate microenvironment interactions such as angiogenesis, cell migration, etc. is unclear. However, two non-mutually exclusive explanations are consistent with this observation. The first possibility is that the most aggressive tumors are likely to overcome constraints imposed by the tissue niche, while less aggressive tumors retain characteristics of their tissue of origin and are more dependent on the niche. In essence, the mutational profile may reflect the degree of tumor differentiation and select largely for cells that can survive and divide rapidly without much regard for their surrounding microenvironment. These cells might therefore show greater metastatic efficiency, simply measured by their ability to survive outside the original tumor [36], and in this case, metastatic efficiency would be driven by cell-intrinsic factors and not by alterations in the microenvironment such as tissue hypoxia, pH, or the extracellular matrix. The second possibility is that the signature associated with elevated G2/M transition and DNA damage genes reflects enrichment of tumor-initiating cells, which have been documented in osteosarcoma [37]. Either of these possibilities, or perhaps both acting in concert, might be responsible for the differential behavior and consequently the observed molecular pathological stratification of osteosarcoma patients into two groups with distinct outcome.
Additional work will be necessary to define the molecular mechanisms that underlie this gene expression signature and to further explore the role of genetic background in tumor susceptibility in both dogs and humans.
5. Conclusion
We show here that naturally occurring canine and human appendicular osteosarcoma share molecularly distinct subtypes associated with biological behavior; thus, studies in dogs that can be conducted efficiently and in a relatively short timeline may provide prognostically valuable information. The signatures that define these subtypes were revealed using strategies that reduce inter-sample heterogeneity, including utilization of naturally occurring canine tumors along with innovative comparative and gene vector based bioinformatic analyses. We propose that both of these approaches are broadly applicable to the study of tumor complexity, genetic heterogeneity, and evolutionary relationships in cancer.
Supplementary Material
Supplementary Figure 1. Ingenuity Pathway Analysis of Genes in Cluster 1 and Cluster 2. (A) IPA of yellow gene vectors shows significant association with functions and pathways functionally involved cell cycle and progression. (B) IPA of blue gene vectors shows significant association with functions and pathways functionally involved tumor microenvironment.
Supplementary Figure 2. Rottweiler breed is not correlated with poor survival outcome in dogs with OS. (A) Hierarchical clustering from Figure 1 showing identification of dogs by breed (Rottweiler vs. non-Rottweiler) in the toe bar. (B) Kaplan-Meier survival analysis of dogs included in GEP analysis from panel A with follow-up information (N=21) according to breed. (C) Kaplan-Meier survival curves of dogs in our recruitment cohort (Supplementary Table 1) with follow-up information (N=49) according to breed.
Research Highlights.
Gene expression profiling reveals prognostic subgroups in canine osteosarcoma
This molecular signature is highly preserved in human osteosarcoma patients
It recapitulates a soft tissue sarcoma profile with potential bone-specific factors
The narrower genetic diversity of dogs simplifies pathological stratification
This unmasks biologically and clinically relevant molecular osteosarcoma subtypes
Acknowledgments
Research Support: this work was supported in part by grants 2254 (JFM and MB) and 947 (MB, JFM, and LEH) from the AKC Canine Health Foundation; P30 CA077598 (MCC Core) and P30 CA046934 (UCCC Core) from the NIH/NCI; Faculty Research and Development (SS and JFM) from the University of Minnesota Academic Health Center; philanthropic funds from the Kate Koogler Canine Cancer Fund; and through the University of Minnesota Animal Cancer Care and Research Program/Comparative Oncology Fund. KLT is the recipient of a EURYI award from the ESF.
We thank Susan Fosmire, Okyong Cho, and Mary Vijjeswarapu for technical assistance and Drs. Brian Van Ness, David Largaespada, Denis Clohisy, Joelle Fenger, Rachael Thomas, Snaevar Sigurdsson, Elaine Ostrander, Kevin Silverstein, and Wayne Xu for helpful discussions and intellectual support. The authors also wish to acknowledge infrastructure support and staff assistance from the Minnesota Supercomputing Institute. Immunology Science Editors assisted with editing of the manuscript.
Footnotes
The authors report no competing financial interests.
Publisher's Disclaimer: This is a PDF file of an unedited manuscript that has been accepted for publication. As a service to our customers we are providing this early version of the manuscript. The manuscript will undergo copyediting, typesetting, and review of the resulting proof before it is published in its final citable form. Please note that during the production process errors may be discovered which could affect the content, and all legal disclaimers that apply to the journal pertain.
References
- 1.Paoloni M, Khanna C. Translation of new cancer treatments from pet dogs to humans. Nat Rev Cancer. 2008;8:147–156. doi: 10.1038/nrc2273. [DOI] [PubMed] [Google Scholar]
- 2.Breen M, Modiano JF. Evolutionarily conserved cytogenetic changes in hematological malignancies of dogs and humans - man and his best friend share more than companionship. Chromosome Res. 2008;16:145–154. doi: 10.1007/s10577-007-1212-4. [DOI] [PubMed] [Google Scholar]
- 3.Staudt LM, Dave S. The biology of human lymphoid malignancies revealed by gene expression profiling. Adv Immunol. 2005;87:163–208. doi: 10.1016/S0065-2776(05)87005-1. [DOI] [PMC free article] [PubMed] [Google Scholar]
- 4.Sotiriou C, Piccart MJ. Taking gene-expression profiling to the clinic: when will molecular signatures become relevant to patient care? Nat Rev Cancer. 2007;7:545–553. doi: 10.1038/nrc2173. [DOI] [PubMed] [Google Scholar]
- 5.Khanna C, Khan J, Nguyen P, Prehn J, Caylor J, Yeung C, Trepel J, Meltzer P, Helman L. Metastasis-associated differences in gene expression in a murine model of osteosarcoma. Cancer Res. 2001;61:3750–3759. [PubMed] [Google Scholar]
- 6.Fellenberg J, Dechant MJ, Ewerbeck V, Mau H. Identification of drug-regulated genes in osteosarcoma cells. Int J Cancer. 2003;105:636–643. doi: 10.1002/ijc.11135. [DOI] [PubMed] [Google Scholar]
- 7.Man TK, Chintagumpala M, Visvanathan J, Shen J, Perlaky L, Hicks J, Johnson M, Davino N, Murray J, Helman L, Meyer W, Triche T, Wong KK, Lau CC. Expression profiles of osteosarcoma that can predict response to chemotherapy. Cancer Res. 2005;65:8142–8150. doi: 10.1158/0008-5472.CAN-05-0985. [DOI] [PubMed] [Google Scholar]
- 8.Mintz MB, Sowers R, Brown KM, Hilmer SC, Mazza B, Huvos AG, Meyers PA, Lafleur B, McDonough WS, Henry MM, Ramsey KE, Antonescu CR, Chen W, Healey JH, Daluski A, Berens ME, Macdonald TJ, Gorlick R, Stephan DA. An expression signature classifies chemotherapy-resistant pediatric osteosarcoma. Cancer Res. 2005;65:1748–1754. doi: 10.1158/0008-5472.CAN-04-2463. [DOI] [PubMed] [Google Scholar]
- 9.Cleton-Jansen AM, Anninga JK, Briaire-de Bruijn IH, Romeo S, Oosting J, Egeler RM, Gelderblom H, Taminiau AH, Hogendoorn PC. Profiling of high-grade central osteosarcoma and its putative progenitor cells identifies tumourigenic pathways. Br J Cancer. 2009;101:1909–1918. doi: 10.1038/sj.bjc.6605405. [DOI] [PMC free article] [PubMed] [Google Scholar]
- 10.Hayden JB, Hoang BH. Osteosarcoma: basic science and clinical implications. Orthop Clin North Am. 2006;37:1–7. doi: 10.1016/j.ocl.2005.06.004. [DOI] [PubMed] [Google Scholar]
- 11.Kobayashi E, Masuda M, Nakayama R, Ichikawa H, Satow R, Shitashige M, Honda K, Yamaguchi U, Shoji A, Tochigi N, Morioka H, Toyama Y, Hirohashi S, Kawai A, Yamada T. Reduced argininosuccinate synthetase is a predictive biomarker for the development of pulmonary metastasis in patients with osteosarcoma. Mol Cancer Ther. 2010;9:535–544. doi: 10.1158/1535-7163.MCT-09-0774. [DOI] [PubMed] [Google Scholar]
- 12.Chibon F, Lagarde P, Salas S, Perot G, Brouste V, Tirode F, Lucchesi C, de Reynies A, Kauffmann A, Bui B, Terrier P, Bonvalot S, Le Cesne A, Vince-Ranchere D, Blay JY, Collin F, Guillou L, Leroux A, Coindre JM, Aurias A. Validated prediction of clinical outcome in sarcomas and multiple types of cancer on the basis of a gene expression signature related to genome complexity. Nat Med. 2010;16:781–787. doi: 10.1038/nm.2174. [DOI] [PubMed] [Google Scholar]
- 13.Paoloni M, Davis S, Lana S, Withrow S, Sangiorgi L, Picci P, Hewitt S, Triche T, Meltzer P, Khanna C. Canine tumor cross-species genomics uncovers targets linked to osteosarcoma progression. BMC Genomics. 2009;10:625. doi: 10.1186/1471-2164-10-625. [DOI] [PMC free article] [PubMed] [Google Scholar]
- 14.O’Donoghue LE, Ptitsyn AA, Kamstock DA, Siebert J, Thomas RS, Duval DL. Expression profiling in canine osteosarcoma: identification of biomarkers and pathways associated with outcome. BMC Cancer. 2010;10:506. doi: 10.1186/1471-2407-10-506. [DOI] [PMC free article] [PubMed] [Google Scholar]
- 15.Thomas R, Scott A, Langford CF, Fosmire SP, Jubala CM, Lorentzen TD, Hitte C, Karlsson EK, Kirkness E, Ostrander EA, Galibert F, Lindblad-Toh K, Modiano JF, Breen M. Construction of a 2-Mb resolution BAC microarray for CGH analysis of canine tumors. Genome Res. 2005;15:1831–1837. doi: 10.1101/gr.3825705. [DOI] [PMC free article] [PubMed] [Google Scholar]
- 16.Thomas R, Wang HJ, Tsai PC, Langford CF, Fosmire SP, Jubala CM, Getzy DM, Cutter GR, Modiano JF, Breen M. Influence of genetic background on tumor karyotypes: evidence for breed-associated cytogenetic aberrations in canine appendicular osteosarcoma. Chromosome Res. 2009;17:365–377. doi: 10.1007/s10577-009-9028-z. [DOI] [PMC free article] [PubMed] [Google Scholar]
- 17.Newman RA, Yang J, Raymond M, Finlay V, Cabral F, Vourloumis D, Stephens LC, Troncoso P, Wu X, Logothetis CJ, Nicolaou KC, Navone NM. Antitumor efficacy of 26-fluoroepothilone B against human prostate cancer xenografts. Cancer Chemother Pharmacol. 2001;48:319–326. doi: 10.1007/s002800100323. [DOI] [PubMed] [Google Scholar]
- 18.Tamburini BA, Trapp S, Phang TL, Schappa JT, Hunter LE, Modiano JF. Gene expression profiles of sporadic canine hemangiosarcoma are uniquely associated with breed. PLoS ONE. 2009;4:e5549. doi: 10.1371/journal.pone.0005549. [DOI] [PMC free article] [PubMed] [Google Scholar]
- 19.Wu Z, Irizarry RA. Preprocessing of oligonucleotide array data. Nat Biotechnol. 2004;22:656–658. doi: 10.1038/nbt0604-656b. author reply 658. [DOI] [PubMed] [Google Scholar]
- 20.Livak KJ, Schmittgen TD. Analysis of relative gene expression data using real-time quantitative PCR and the 2(-Delta Delta C(T)) Method. Methods. 2001;25:402–408. doi: 10.1006/meth.2001.1262. [DOI] [PubMed] [Google Scholar]
- 21.Koenig A, Wojcieszyn J, Weeks BR, Modiano JF. Expression of S100a, vimentin, NSE, and Melan A/MART-1 in seven canine melanoma cell lines and twenty-nine retrospective cases of canine melanoma. Vet Pathol. 2001;38:427–435. doi: 10.1354/vp.38-4-427. [DOI] [PubMed] [Google Scholar]
- 22.Modiano JF, Breen M, Lana SE, Ehrhart N, Fosmire SP, Thomas R, Jubala CM, Lamerato-Kozicki AR, Ehrhart EJ, Schaack J, Duke RC, Cutter GC, Bellgrau D. Naturally occurring translational models for development of cancer therapy. Gene Ther Mol Biol. 2005;10:31–40. [Google Scholar]
- 23.Keller PJ, Lin AF, Arendt LM, Klebba I, Jones AD, Rudnick JA, Dimeo TA, Gilmore H, Jefferson DM, Graham RA, Naber SP, Schnitt S, Kuperwasser C. Mapping the cellular and molecular heterogeneity of normal and malignant breast tissues and cultured cell lines. Breast Cancer Res. 2010;12:R87. doi: 10.1186/bcr2755. [DOI] [PMC free article] [PubMed] [Google Scholar]
- 24.Sarver AL, Phalak R, Thayanithy V, Subramanian S. S-MED: sarcoma microRNA expression database. Lab Invest. 2010;90:753–761. doi: 10.1038/labinvest.2010.53. [DOI] [PubMed] [Google Scholar]
- 25.Modiano JF, Breen M, Burnett RC, Parker HG, Inusah S, Thomas R, Avery PR, Lindblad-Toh K, Ostrander EA, Cutter GC, Avery AC. Distinct B-cell and T-cell lymphoproliferative disease prevalence among dog breeds indicates heritable risk. Cancer Res. 2005;65:5654–5661. doi: 10.1158/0008-5472.CAN-04-4613. [DOI] [PubMed] [Google Scholar]
- 26.Liao AT, McMahon M, London CA. Identification of a novel germline MET mutation in dogs. Anim Genet. 2006;37:248–252. doi: 10.1111/j.1365-2052.2006.01415.x. [DOI] [PubMed] [Google Scholar]
- 27.McNeill CJ, Overley B, Shofer FS, Kent MS, Clifford CA, Samluk M, Haney S, Van Winkle TJ, Sorenmo KU. Characterization of the biological behaviour of appendicular osteosarcoma in Rottweilers and a comparison with other breeds: a review of 258 dogs. Vet Comp Oncol. 2007;5:90–98. doi: 10.1111/j.1476-5829.2006.00116.x. [DOI] [PubMed] [Google Scholar]
- 28.Wolfe TD, Pillai SP, Hildreth BE, 3rd, Lanigan LG, Martin CK, Werbeck JL, Rosol TJ. Effect of zoledronic acid and amputation on bone invasion and lung metastasis of canine osteosarcoma in nude mice. Clin Exp Metastasis. 2011 doi: 10.1007/s10585-011-9377-9. [DOI] [PMC free article] [PubMed] [Google Scholar]
- 29.Sutter NB, Ostrander EA. Dog star rising: the canine genetic system. Nat Rev Genet. 2004;5:900–910. doi: 10.1038/nrg1492. [DOI] [PubMed] [Google Scholar]
- 30.Tamburini BA, Phang TL, Fosmire SP, Scott MC, Trapp SC, Duckett MM, Robinson SR, Slansky JE, Sharkey LC, Cutter GR, Wojcieszyn JW, Bellgrau D, Gemmill RM, Hunter LE, Modiano JF. Gene expression profiling identifies inflammation and angiogenesis as distinguishing features of canine hemangiosarcoma. BMC Cancer. 2010;10:619. doi: 10.1186/1471-2407-10-619. [DOI] [PMC free article] [PubMed] [Google Scholar]
- 31.Veerakumarasivam A, Goldstein LD, Saeb-Parsy K, Scott HE, Warren A, Thorne NP, Mills IG, Venkitaraman A, Neal DE, Kelly JD. AURKA overexpression accompanies dysregulation of DNA-damage response genes in invasive urothelial cell carcinoma. Cell Cycle. 2008;7:3525–3533. doi: 10.4161/cc.7.22.7042. [DOI] [PubMed] [Google Scholar]
- 32.Kaufmann WK, Nevis KR, Qu P, Ibrahim JG, Zhou T, Zhou Y, Simpson DA, Helms-Deaton J, Cordeiro-Stone M, Moore DT, Thomas NE, Hao H, Liu Z, Shields JM, Scott GA, Sharpless NE. Defective cell cycle checkpoint functions in melanoma are associated with altered patterns of gene expression. J Invest Dermatol. 2008;128:175–187. doi: 10.1038/sj.jid.5700935. [DOI] [PMC free article] [PubMed] [Google Scholar]
- 33.Gatti L, Zunino F. Overview of tumor cell chemoresistance mechanisms. Methods Mol Med. 2005;111:127–148. doi: 10.1385/1-59259-889-7:127. [DOI] [PubMed] [Google Scholar]
- 34.Zhang M, Behbod F, Atkinson RL, Landis MD, Kittrell F, Edwards D, Medina D, Tsimelzon A, Hilsenbeck S, Green JE, Michalowska AM, Rosen JM. Identification of tumor-initiating cells in a p53-null mouse model of breast cancer. Cancer Res. 2008;68:4674–4682. doi: 10.1158/0008-5472.CAN-07-6353. [DOI] [PMC free article] [PubMed] [Google Scholar]
- 35.Piening BD, Wang P, Subramanian A, Paulovich AG. A radiation-derived gene expression signature predicts clinical outcome for breast cancer patients. Radiat Res. 2009;171:141–154. doi: 10.1667/RR1223.1. [DOI] [PMC free article] [PubMed] [Google Scholar]
- 36.Lunt SJ, Chaudary N, Hill RP. The tumor microenvironment and metastatic disease. Clin Exp Metastasis. 2009;26:19–34. doi: 10.1007/s10585-008-9182-2. [DOI] [PubMed] [Google Scholar]
- 37.Adhikari AS, Agarwal N, Wood BM, Porretta C, Ruiz B, Pochampally RR, Iwakuma T. CD117 and Stro-1 identify osteosarcoma tumor-initiating cells associated with metastasis and drug resistance. Cancer Res. 2010;70:4602–4612. doi: 10.1158/0008-5472.CAN-09-3463. [DOI] [PMC free article] [PubMed] [Google Scholar]
Associated Data
This section collects any data citations, data availability statements, or supplementary materials included in this article.
Supplementary Materials
Supplementary Figure 1. Ingenuity Pathway Analysis of Genes in Cluster 1 and Cluster 2. (A) IPA of yellow gene vectors shows significant association with functions and pathways functionally involved cell cycle and progression. (B) IPA of blue gene vectors shows significant association with functions and pathways functionally involved tumor microenvironment.
Supplementary Figure 2. Rottweiler breed is not correlated with poor survival outcome in dogs with OS. (A) Hierarchical clustering from Figure 1 showing identification of dogs by breed (Rottweiler vs. non-Rottweiler) in the toe bar. (B) Kaplan-Meier survival analysis of dogs included in GEP analysis from panel A with follow-up information (N=21) according to breed. (C) Kaplan-Meier survival curves of dogs in our recruitment cohort (Supplementary Table 1) with follow-up information (N=49) according to breed.