

Abstract
In vitro, animal cells are mostly cultured on a gel substrate. It was recently shown that substrate stiffness affects cellular behaviors in a significant way, including adhesion, differentiation, and migration. Therefore, an accurate method is needed to characterize the modulus of the substrate. In situ microscopic measurements of the gel substrate modulus are based on Hertz contact mechanics, where Young's modulus is derived from the indentation force and displacement measurements. In Hertz theory, the substrate is modeled as a linear elastic half-space with an infinite depth, whereas in practice, the thickness of the substrate, h, can be comparable to the contact radius and other relevant dimensions such as the radius of the indenter or steel ball, R. As a result, measurements based on Hertz theory overestimate the Young's modulus. In this work, we discuss the limitations of Hertz theory and then modify it, taking into consideration the nonlinearity of the material and large deformation using a finite-element method. We present our results in a simple correction factor, ψ, the ratio of the corrected Young's modulus and the Hertz modulus in the parameter regime of δ/h ≤ min (0.6, R/h) and 0.3 ≤ R/h ≤ 12.7. The ψ factor depends on two dimensionless parameters, R/h and δ/h (where δ is the indentation depth), both of which are easily accessible to experiments. This correction factor agrees with experimental observations obtained with the use of polyacrylamide gel and a microsphere indentation method in the parameter range of 0.1 ≤ δ/h ≤ 0.4 and 0.3 ≤ R/h ≤ 6.2. The effect of adhesion on the use of Hertz theory for small indentation depth is also discussed.
Introduction
Mechanical signals play important roles in directing cellular behaviors including adhesion, migration, differentiation, and cell-cell communications (1–5). When grown on a substrate coated with proteins (e.g., naturally derived extracellular matrix (ECM) collagen), many cell types, such as fibroblasts, endothelial cells, smooth muscle cells, and mesenchymal stem cells, exert forces on the substrate (1,3,6,7). In turn, the stiffness of the substrate influences the cellular behavior through linkages between the integrins presented on the cell membrane and ECM. Early work from the Wang laboratory revealed that substrate stiffness regulates both focal adhesions and cell locomotion (2). Work from the Discher laboratory demonstrated that stem cells choose their cell differentiation lineage depending on the substrate stiffness, i.e., mesenchymal stem cells grown on soft, medium, or rigid substrates develop into neurogenic, myogenic, or osteogenic cells, respectively (1). Recent work from Reinhart-King's laboratory showed that endothelial cell network formation is mediated by the substrate stiffness, which has a direct impact on our understanding of the formation of vascular tissue (4).
Our increasing appreciation of the cellular mechanical environment demands a new set of tools to accurately characterize the mechanical properties of soft materials in situ. To date, much of what we have learned about the roles of mechanical forces in various physiological processes has been derived from observations of cells plated on hydrogel substrates with tunable stiffness (1–4). Traditional methods for measuring the modulus, such as rheometry and atomic force microscopy (AFM), are expensive and low-throughput, and cannot be carried out in situ under cell culture conditions. Therefore, investigators have developed a number of novel techniques to either measure the Young's modulus of a substrate in situ or directly probe the traction force of cells plated on a specially engineered substrate (8–21). Of almost all of the in situ measurement techniques, the widely used microscopic indentation method pioneered by the Wang laboratory is the easiest one to implement in a biology laboratory (22). Briefly, the indentation displacement of a gel by a microsphere (e.g., a micrometer-scale steel ball or a glass indenter; see Fig. 1) is measured with a microscope, and the Young's modulus is derived by means of Hertz contact theory. This method is especially appealing to biology laboratorians because 1), it provides straightforward measurements and can be carried out quickly under cell culture conditions; 2), it is compatible with microscopy, which is used to observe cellular behavior; 3), it does not require instruments that are expensive and not normally available in a biology laboratory (e.g., a rheometer or atomic force microscope); and 4), it is high-throughput.
Figure 1.
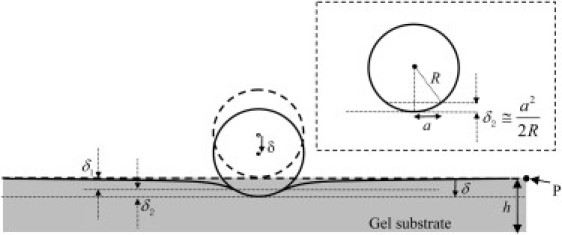
Schematics of the microsphere indentation method. A microsphere with radius R is in contact with a soft gel layer of thickness h. The bottom of the gel is adhered to a glass slide. Heavy dotted lines indicate the surface of the elastic substrate and the sphere (rigid) just before contact. The geometry after contact is indicated by solid lines. The point P is at distances that are very large compared with the contact radius a. In Hertz theory, h = ∞ and δ2 is determined by a small-angle approximation, as illustrated in the inset.
The current microscopic indentation method, however, is limited by the assumptions made in Hertz contact theory. Hertz contact theory assumes that the microsphere indenter is in contact with a gel of infinite half-space. This cannot be easily satisfied in the laboratory, because of the ways in which gels are made in the laboratory, as well as the need to be compatible with an optical microscope. The most commonly used gel, polyacrylamide, is made by sandwiching a mixture of polymer precursor and its cross-linking agent between two glass coverslips. A thin gel is much easier to process to achieve a uniform gelation throughout the gel, and a thick gel degrades the imaging quality. As a result, the most commonly used gel thickness in the indentation method is in the range of 50–200 μm (22,23). The microspheres, which are commercially available, usually have a radius of 150–625 μm (22). These conditions violate the Hertz assumption and lead to an overestimation of the modulus (22,23).
In this work, we first review the limitations of Hertz theory in the context of the microscopic indentation method. We then present a simple expression for a correction factor, ψ, the ratio of the corrected and Hertz moduli, as a function of R/h and δ/h, where R is the indenter radius, δ is the indentation displacement, and h is the gel thickness. The computed correction factor is obtained via a finite-element simulation that accounts for large deformation and material nonlinearity in the parameter regime of δ/h ≤ min (0.6, R/h) and 0.5 ≤ R/h ≤ 12.7. This correction factor reproduces the result of Dimitriadis et al. (21) based on linear elasticity theory at the small-strain limit δ/h ≤ 0.1. It is consistent with experimental measurements obtained with the use of polyacrylamide gel of various thicknesses and the microsphere indentation method using stainless steel or glass spheres in the parameter regime of 0.1 ≤ δ/h ≤ 0.4 and 0.3 ≤ R/h ≤ 6.2. This work extends the capability of the current microscopic indentation method for characterizing soft gels.
Materials and Methods
Computation methods
Hertz theory and its limitations
Hertz theory was developed to explain nonadhesive contact between two elastic spheres. By assigning zero curvature to one of the spheres, one can readily extend Hertz theory to the case of a sphere indenting on an elastic half-space. To adapt Hertz theory to the microsphere indentation experiments, we note that the modulus of the microsphere (a steel or glass ball) is at least six orders of magnitude higher than the substrate, and thus can be considered as a rigid body. The Young's modulus E of an infinitely thick gel indented by a rigid microsphere is related to the indentation force F and the measured indentation depth or displacement δ by
| (1) |
where R is the radius of the indenter, F is the weight of the microsphere minus the buoyancy, and v is the Poisson's ratio of the substrate. We assume ν = 0.5 in this work, because indentation experiments are typically carried out in a short time (i.e., within several minutes). In this regime, there is not enough time for the small solvent molecules to migrate in or out of the gel network (24). Indeed, one can estimate the diffusion timescale using the gel modulus, viscosity of water, typical experimental dimensions (contact radius), and permeability of the gel network (25). Based on previous data (26), we estimate the permeability of our polyacrylamide gel to be 5 × 10⁻¹⁹ m2. Using a typical contact radius (100∼250 μm) and gel modulus (∼1000 Pa), we estimate the diffusion timescale to be 5–31 h, which is much longer than our experimental timescale. As a result, the gels behave as incompressible materials in the microsphere indentation experiments. The indentation depth, δ, is defined with respect to a remote point in the specimen where the deformation is identically zero (e.g., point P in Fig. 1). The dotted horizontal line in Fig. 1 represents the surface of the undeformed substrate just before contact. The indentation depth is the sum of two displacements:
| (2a) |
where
| (2b) |
using the small-angle approximation (see inset of Fig. 1) and a as the contact radius. Recall that in Hertz theory,
| (3) |
Equations 2 and 3 imply that δ1 = δ2 in Hertz theory.
Eq. 1, or Hertz theory, is derived based on the following assumptions:
-
1.
The displacements and strains of the substrate are assumed to be small so that a linearized continuum theory can be used. In particular, there is no distinction between the deformed and undeformed configurations of the contacting bodies as far as force equilibrium is concerned. These assumptions allow the sphere to be replaced by a paraboloid.
-
2.
The gel substrate is an infinite half-space (i.e., h = ∞). Physically, this means that its thickness is large in comparison with all other relevant length scales in the experiment (e.g., the contact radius a).
-
3.
The contact surfaces are assumed to be frictionless so that the shear tractions acting on them are identically zero.
-
4.
No adhesion between the indenter and the substrate, for otherwise normal tensile stress can be supported near the edge of contact. This assumption, together with assumption 3, implies that contact stress is compressive.
For a thin gel substrate, assumption 2 is usually violated in experiments. As a result, Eq. 1 tends to predict a much higher elastic modulus, a limitation that is widely recognized in the literature (22). For example, in the microsphere experiments of Reinhart-King et al. (23), the measured Young's modulus based on Eq. 1 is found to decrease significantly with substrate thickness. Specifically, the modulus is 17,500 Pa for a gel thickness of 50 μm. It decreases to 2500 Pa when the gel thickness is 200 μm. In their study, the modulus of the gel is taken to be 2500 Pa. Their implicit assumption is that a gel thickness of 200 μm is sufficiently thick to approach the Hertz limit of an infinite substrate. Later, we will show this is not the case, as the correction to Hertz theory in general depends on the ratios δ/h and R/h.
In the following, E in Eq. 1 will be replaced by EH, which we will call the Hertz modulus.
Modified Hertz theory for a substrate of finite thickness based on linear elasticity
We briefly review previous works that sought to account for the effects of substrate thickness. Previous investigators modified Hertz theory to account for finite layer thickness either numerically (27–29) or analytically (21,30). Shull and Crosby (27) and Shull (28) were primarily interested in probing the adhesion of gel to a micro-indenter, whereas Dimitriadis et al. (21) were interested in measuring the gel modulus using atomic force microscopy (AFM). All of these works accounting for the finite layer thickness effect were based on linear elastic theory, where strains are assumed to be small (δ/h ≤ 0.1) and directly proportional to stresses.
Modified Hertz theory for a substrate of finite thickness based on nonlinear elasticity
Small-strain theory breaks down when δ/h ≥ 0.1, a condition that is frequently encountered in microsphere experiments (23) (Table 1), particularly during attempts to characterize soft biomaterial. Therefore, it is necessary to include large deformation in the analysis and to consider different values of R/h. The breakdown of small-strain theory creates two difficulties: The fact that displacements and strains are no longer small means that the relation between displacements and strains is nonlinear (for example, the Lagrangian strain tensor involves quadratic terms of displacement gradients). Also, one must distinguish between the undeformed and deformed configurations. On top of these difficulties, one must account for material nonlinearity (i.e., Hooke's law, which holds that strain is directly proportional to stress, is no longer accurate). In our finite-element simulations (see below), the usual Hooke's law of linear small-strain elasticity is replaced by a neo-Hookean solid (31), the simplest material model used by physicists and chemists to extend Hooke's law to account for large deformation. We also use the exact kinematics of large-deformation theory (31).
Table 1.
Results from the microsphere indentation experiments
| Gel thickness h (μm) | Indentation depth δ (μm) | Dimensionless parameters |
Hertz modulus EH (Pa) | Corrected modulus E (Pa) | Linear modulus EL (Pa) | |||
|---|---|---|---|---|---|---|---|---|
| R/h | δ/h | ω | ||||||
| Sample 1 | 51.75 ± 5.42 | 19.65 ± 1.17 | 6.14 | 0.38 | 3.556 | 3226 ± 288.1 | 312 ± 85.6 | 359 ± 92.5 |
| Sample 2 | 153.27 ± 15.37 | 41.05 ± 1.59 | 2.07 | 0.27 | 0.413 | 1068 ± 62.1 | 344 ± 49.6 | 368 ± 51.7 |
| Sample 3 | 272.26 ± 17.54 | 64.41 ± 1.74 | 1.17 | 0.24 | 0.145 | 544 ± 22.0 | 261 ± 20.4 | 263 ± 19.2 |
| Sample 4 | 520.94 ± 6.29 | 89.74 ± 1.37 | 0.61 | 0.17 | 0.034 | 330 ± 7.6 | 230 ± 6.1 | 216 ± 5.9 |
| Sample 5 | 771.37 ± 30.05 | 112.66 ± 2.49 | 0.41 | 0.15 | 0.0147 | 235 ± 7.8 | 188 ± 6.9 | 172 ± 6.8 |
| Sample 6 | 1053.5 ± 23.92 | 133.40 ± 2.54 | 0.30 | 0.13 | 0.0075 | 182 ± 5.2 | 158 ± 4.6 | 143 ± 4.5 |
| Sample 7 | 133.75 ± 2.26 | 31.36 ± 1.37 | 4.37 | 0.23 | 1.039 | 1633 ± 107.0 | 334 ± 33.7 | 374 ± 38.1 |
Gel thickness h and indentation depth δ were measured in experiments using the microscopic indentation method. Samples 1–6 were indented by a steel ball of radius R = 317.5 μm (six measurements per sample). Sample 7 was indented by a glass sphere of radius R = 585 μm (10 measurements). Average values of dimensionless parameters R/h, δ/h, and ω are listed in the table. The Hertz modulus EH was calculated using Hertz theory (Eq. 1) with ν = 1/2. The corrected modulus E was determined using the correction factor (Eq. 6) and the frictionless interface condition. The linear modulus EL was calculated using the correction factor provided in Dimitriadis et al. (21) (see their Eq. 12). All of the data except for the dimensionless parameters are presented as the mean ± SD.
To illustrate the nonlinearity brought about by large deformation and the neo-Hookean model, we consider a simple example of a straight bar with initial cross-section area A0 and length L0 subjected to a constant tension force T (see inset of Fig. 2). After deformation occurs, the cross-section area A0 shrinks to A and the length extends to L. A plot of the normalized true stress σ/E (σ = T/A) versus the extension ratio λ = L/L0 (solid line) is shown in Fig. 2. Recall that in small-strain theory, the tensile strain is ɛ = λ−1, and one does not draw a distinction between the true stress σ and the nominal or engineering stress τ = T/A0. The linear small-strain theory, which holds that stress is directly proportional to strain, is shown as the dashed line in Fig. 2. The prediction of the nonlinear neo-Hookean solid is shown as a solid line. Because the dash line is tangent to the solid line in Fig. 2 at λ = 1 (ɛ = 0), the neo-Hookean solid has the same Young's modulus as the linear Hooke's law in the limit of small strains. Clearly, deviation occurs once |ɛ| > 0.2, especially in compression (λ <1). It must be noted that the stress state in the gel layer under indentation is multiaxial and not uniform, and hence is much more complex than the example shown in Fig. 2.
Figure 2.
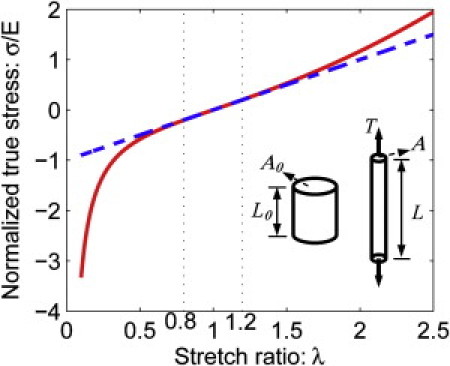
Nonlinear elasticity of material in large deformation. The relationship between the normalized true stress and stretch ratio for a neo-Hookean bar subjected to uniaxial tensile force T is shown. The dashed line represents the prediction of the linear small-strain theory (Hooke's law). The solid line represents the nonlinear response of the material. The inset shows the geometry and loading. The tension bar has a cross-section area of A0 and length of L0 before deformation. After deformation, the cross-section area shrinks to A and the length extends to L. The true stress σ is defined by T/A, whereas the extension ratio λ is L/L0.
We note that Yoffe (32) previously modified Hertz theory to account for large deformation. However, his analysis was based on perturbing the Hertz solution about the small-strain state, and did not account for the finite-thickness effect. Also, the constitutive model used in his analysis was the linear Hooke's law, that is, it did not account for material nonlinearity. More recently, Lin and Chen (33) carried out a detailed large-deformation analysis of the Hertz problem of a rigid hemisphere indenting on a neo-Hookean half-space (i.e., h = ∞). They based their analysis on an exact formulation of the equations of nonlinear elasticity, but did not consider the finite-thickness effect.
Finite-element method for modified Hertz theory
We performed finite-element simulations using the commercial software ABAQUS (34). We took advantage of the axisymmetry to create a two-dimensional, finite-element model for this indentation problem. The gel substrate was modeled as a circular layer made of incompressible neo-Hookean material. The radius of the layer was 20h, where h is the thickness of the layer. The spherical indenter of radius R was modeled as a rigid object. (We checked to ensure that increasing the radius of the layer had no effect on our solution.) To highlight the effect of large deformation, we studied indentation depths up to δ/h = 0.6, which clearly exceeds the limit of the small-strain theory. We considered two limits of the friction condition on the interface: the no-slip condition (infinite friction) and the frictionless condition (zero friction). We ascertained that our results obtained by the finite-element method (FEM) converged as the mesh size decreased. Additional information regarding the finite-element simulations is given in the Supporting Material.
There are three dimensionless arguments that can be constructed in the indentation problem: the dimensionless force , the dimensionless indentation depth , and the dimensionless indenter radius R/h. Dimensional analysis leads to the following result:
| (4) |
where f is an unknown dimensionless function of its dimensionless arguments. Using Eqs. 1 and 4, and Poisson ratio to be 0.5, we find the correction factor ψ to be
| (5) |
To investigate the effect of R/h on the correction factor ψ, we carried out finite-element simulations for different R/h values in the range of 0.5–12.7, which covers the dimensions used in typical experiments.
Experimental methods
Coverslip activation
The surface of glass coverslips (No 1, 48 mm × 65 mm; Thermo Scientific, Waltham, MA) were activated to covalently bond to polyacrylamide gel sheets via methods adapted from the protocol of Reinhart-King et al. (23). First, a cotton swab was used to evenly coat the surface with 0.1 N NaOH, and the coverslip was air-dried. Second, a Pasteur pipette was used to coat the surface with 60 μl of 3-aminopropyltrimethoxysilane (APTMS; Aldrich, St. Louis, MO). After incubation for 5 min, the coverslips were washed with distilled H2O and air-dried. Third, the coverslips were coated with 2 ml of 0.5% glutaraldehyde (70%; Aldrich) in phosphate-buffered saline and incubated for 30 min. Finally, the slides were washed in distilled water and air-dried, which completed the surface activation.
Polyacrylamide gel preparation
Polyacrylamide gels of different thicknesses were cast and bound to the activated surface of the glass coverslips. A polyacrylamide mixture with a final concentration of 3% acrylamide (40% w/v; Bio-Rad, Hercules, CA), 0.1% N, N-methylene-bis-acrylamide (BIS, 2% w/v; Bio-Rad), 300 mM HEPES (EMD Chemicals, Gibbstown, NJ), 0.05% tetramethylethylenediamine (Sigma, St. Louis, MO), and 0.83 μm green fluorescent microspheres (catalog No. G830; Thermo Scientific) at a concentration of 4 × 10⁶/ml was prepared. The mixture was adjusted to a pH of 6 with hydrochloric acid and then degassed. Molecular biology-grade ethyl alcohol was added to a final concentration of 7%. Ammonium persulfate (Aldrich) was added to a final concentration of 0.05% w/v for initial polymerization. A volume of polyacrylamide solution depending on the desired gel thickness was pipetted onto the hydrophobic side of the circular glass coverslip. The activated side of the 48 mm × 65 mm slide was lowered into contact with the polyacrylamide mixture until the mixture covered the entire area of the circular coverslip. The polyacrylamide layer and circular coverslip were suspended upside down to ensure that most fluorescent beads would be at the gel-water interface in later experiments. The sandwiched gel was polymerized for 30 min in a biohood (16% humidity) or 100% humidity environment for 2 h. The circular coverslip was then removed and the polyacrylamide gels were immersed in distilled water for at least 1 day to ensure complete hydration before measurements were obtained.
Microsphere indentation method and gel thickness measurements
We used a pair of forceps to place a spherical indenter onto a polyacrylamide gel covered by water, submerging both the gel and the indenter. Using bright-field microscopy and the x-y translation stage of the microscope (IX51, Olympus America, Center Valley, PA), we brought the indenter to the center of the image. The microscope was then switched to the epifluorescent mode. Using the z-control knob, we identified the green fluorescent bead that was nearest the center of the image and appeared to be at the interface of the gel and the indenter. We located the z-position of the fluorescent bead of interest by manually sweeping the z-position of the stage and recording the z-position at which the image of the fluorescent bead had the maximum light intensity. The light intensity was measured with the imaging software IPLab (Biovision, Mountain View, CA) in real time. The resolution of the measured z-position of the stage was ±1.0 μm. A magnet (for the steel sphere) or a pipette (for the glass sphere) was used to gently remove the indenter. The new z-position of the fluorescent bead was found in the same manner as described above. To ensure that the measured fluorescent bead was at the air-gel interface, we checked to see whether the fluorescent bead recovered to the undeformed gel-water interface upon removal of the indenter. All of the measurements were carried out using beads that were located both at the center of the indenter and at the gel-water interface. The difference of the z-position of the microscope stage with and without the indenter multiplied by 1.31 was taken as the maximum displacement δ of the fluorescent bead at the contact point. The factor 1.31 was introduced because the translation of the microscope stage was in air and the actual distance measured was in gel, and thus there was an optical index mismatch at the air-gel interface. We obtained this factor through a careful calibration using a known spacing (an equivalent of a z-ruler) immersed in water. We fabricated the z-ruler, a silicon wafer with channels of various depths, using photolithography, and calibrated it with a profilometer (Tencor P10 Profilometer, Tencor, Milpitas, CA). We then took the gel thickness measurements near the indentation location by finding the z-position of the lowest and highest beads in the gel. The difference in z-position multiplied by 1.31 was taken as the gel thickness.
Results and Discussion
Numerical computation results
Correction factor based on nonlinear elasticity theory
We obtained an expression for the correction factor that accurately matched our simulation result for the parameter range of 0.5 ≤ R/h ≤ 12.7 and δ/h ≤ min (0.6, R/h):
| (6) |
For the slip (or frictionless between sphere and gel interface) condition,
| (7a) |
| (7b) |
For the no-slip condition,
| (7c) |
| (7d) |
Fig. 3 shows that the fitting formula Eq. 6 (solid lines) can faithfully reproduce our FEM results (circular symbols). In the small-strain regime of δ/h ≤ 0.1, Eqs. 6, 7a, and 7b reproduce the correction factor based on linear elasticity theory from Dimitriadis et al. (21) (see red dashed lines). In the parameter regime of δ/h > 0.1, Eq. 6 deviates from the result of linear elasticity theory due to the nonlinearity and large deformation of the material. This discrepancy becomes more evident when R/h is greater or less than one.
Figure 3.
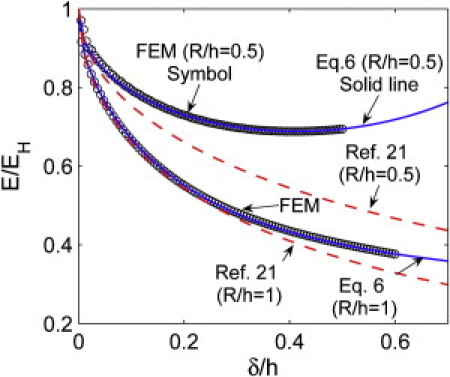
Correction factor E/EH versus δ/h when R/h = 0.5 or 1, considering a frictionless interface between the indenter and the gel. The solid lines are given by Eq. 6 and the symbols are numerical results. The dashed line is obtained using the result of Dimitriadis et al. (21) (see their Eq. 12).
Of interest, for a parameter range of R/h >2 and <12.7, the correction factor ψ depends only on a single dimensionless parameter, ω ≡ (Rδ/h2)3/2, and can be described by a simpler formula. This result is supported by the collapse of data for different R/h values shown in Fig. 4 A (slip) and Fig. 4 B (no-slip). The correction factor ψ is found to be well approximated by:
| (8) |
Figure 4.
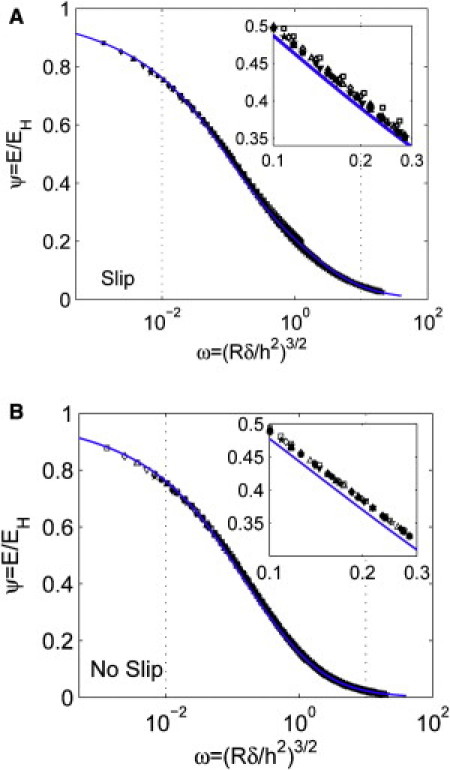
Numerical and analytical expression for the correction factor when R/h ≥ 2. (A) Slip interfacial condition and (B) no-slip interfacial condition between the indenter and the substrate. The solid line is given by Eq. 8 and the symbols indicate FEM results for different R/h values: 2 (□), 3(⋄), 4(▵), 5(▿), 6(☆), 7(●), 8(■), 9(♦), 10(▴), 11.5(▾), 12.7(★). The dotted lines indicate the typical range of ω in experiments. The insets show close-up views of the data points.
The numerical factor β∗ is 4.212 if the indenter is in frictionless contact with the substrate (slip), and 9.288 if the indenter cannot slip on the substrate (no-slip). Typical values of ω in experiments can range from 0.01 to 10. The maximum relative error between Eq. 8 and the FEM results is ∼8% for all data points plotted on Fig. 4.
Comparison with microsphere indentation experiments
To evaluate the accuracy of our correction factor ψ in Eq. 6, we carried out microsphere indentation experiments to measure the modulus of a polyacrylamide gel containing 3% acrylamide and 0.1% BIS-acrylamide using the microsphere method. A steel ball with a diameter of 635 μm or a glass sphere with a diameter of 1.17 mm was used as the microsphere indenter. The weight of the steel ball minus the buoyancy gives a force of ∼8.9 μN, where we have taken the density of steel to be 7800 kg/m3 and the density of the solution to be 1000 kg/m3. Similarly, the weight of the glass indenter is calculated to be 12.33 μN. We measured the indentation depths for seven gel samples with the same composition but different thicknesses using the z-control of the microscope stage (Olympus IX 51). We found the contact point by finding the position of the fluorescent bead located at the contact point. The data are summarized in Table 1. Note that samples 1–6 were indented by the steel ball, whereas the glass sphere was used for sample 7.
For the data shown in Table 1, we calculated the Young's modulus EH directly using Hertz theory (Eq. 1). We found large discrepancies in EH for these samples with the same gel composition but different thicknesses, demonstrating the effect of finite thickness and the limitations of Hertz theory, especially for thin samples. We then corrected EH using the correction factor ψ given in Eq. 6. Because the polyacrylamide gels used in the experiments contain >90% water, we expected a low interface friction, and hence the frictionless condition was assumed on the interface between the microsphere and the gel substrate. After this correction, the moduli for all samples were much closer to each other. The mean ± standard deviation (SD) of the gel modulus is 249 ± 75 Pa (using samples 1–6). One might notice that the SD in the corrected modulus decreases with increased sample thickness. This is because the indentation depth of the thin samples is much smaller than that of the thick samples, which makes the thin samples more sensitive to measurement errors in the indentation method.
Also listed in Table 1 is the corrected modulus EL, which we obtained using a correction factor based on linear elasticity theory in Dimitriadis et al. (21). Although this theory was specifically developed for AFM indentation and applies to the small-strain condition where δ/h ≤ 0.1, and all our experiments were carried out when δ/h ≥ 0.1, the correction factor from linear theory also shows significant improvements from the Hertz theory. The consistency of the data (characterized by the difference of the maximum and minimum of the modulus divided by the average modulus) from the nonlinear elasticity theory is improved ∼13% in comparison with that of linear elasticity theory, assuming that the gels in all of the samples have the same Young's modulus.
To highlight the contrast between the uncorrected modulus EH and the corrected modulus E, we plot the results of samples 1–6 as a function of gel thickness h in Fig. 5 A. A horizontal line at 249 Pa (i.e., the average corrected modulus) is inserted into Fig. 5 A as a reference line. We also plot a dashed curve in Fig. 5 A that shows the results from Hertz theory. We obtained this curve by first solving for δ in Eq. 4 with E = 249 Pa, F = 8.9 μN, R = 317.5 μm, and f replaced by ψ−1 (ψ is given in Eq. 6) for different thicknesses h, and then substituting δ in Eq. 1 to calculate EH. Note that this curve is in excellent agreement with EH obtained by direct measurement of δ and using Eq. 1 (circles in Fig. 5). The dashed curve converges to the horizontal line (at 249 Pa) as the thickness increases, as is expected because Hertz theory becomes more accurate for thicker substrate. At h = 1000 μm, Hertz theory still overestimates the gel modulus by 15%. We emphasize that the validity of Hertz theory does not depend on the absolute value of the substrate thickness, h, but on the relative ratios, ω ≡ (Rδ/h2)3/2 and R/h.
Figure 5.
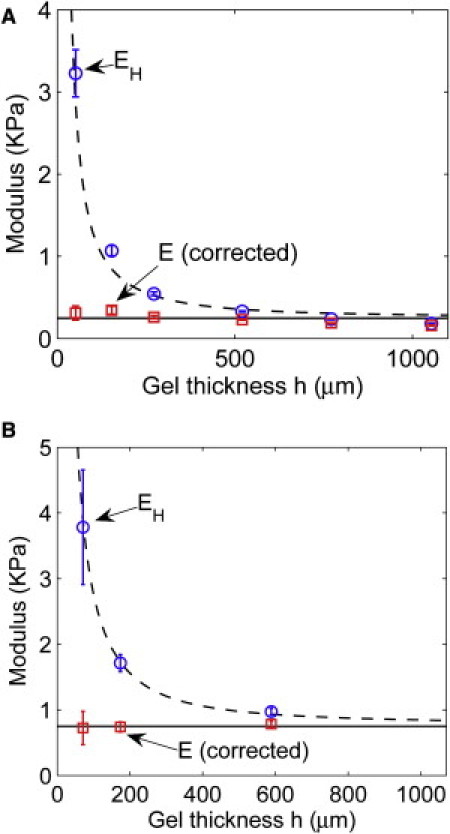
Correcting the finite thickness effect in microsphere indentation experiments. The circles are the EH value calculated using Hertz theory and the measured δ. The squares are the corrected modulus E calculated using Eq. 6 and the measured δ. Error bars represent the SD from six measurements. The solid lines indicate the average values of the corrected modulus: (A) 249 Pa and (B) 750 Pa. The dashed lines are guidelines for data points from Hertz theory. The solid level lines indicate that the gel modulus is independent of the gel thickness.
To highlight the importance of measuring the gel modulus in situ, we present another set of data obtained using the same gel composition (3% acrylamide and 0.1% BIS-acrylamide) and protocol (23), but with one different step in the polymerization procedure. Fig. 5 A shows the corrected modulus measurement of 249 Pa from a gel that was polymerized under a 100% humidity chamber for 2 h, and Fig. 5 B shows the result of 750 Pa from a gel that was polymerized under a biohood with ∼16% humidity for 30 min. In an independent measurement of the gel modulus using a rheometer, Yeung et al. (35) obtained a modulus of 1000 Pa, which compares favorably with our measurement of 750 Pa obtained using the same gel-making protocol and polymerization on a bench with low humidity for 30 min. We also found that the gel modulus increases if the vacuum pressure used in the degassing step of the protocol is lower, possibly due to the increased polymer concentration as a result of evaporation. These results suggest that the gel modulus depends sensitively on every step of the protocol, and highlight the importance of measuring the gel modulus in situ when performing cell-related experiments.
Discussion
Our FEM results show that the Young's modulus E measured in a microsphere indentation experiment is given by
| (9) |
where EH is the Hertz modulus given by Eq. 1 and ψ is the correction factor given by Eq. 6. For our material model, we used the neo-Hookean model, which approaches Hooke's law in the limit of small strains. It should be noted that the neo-Hookean model is accurate only for moderate strains. For very large deformations, this model may not accurately capture the nonlinear elastic behavior of a material. For example, it is well known the neo-Hookean model substantially underestimates the amount of strain hardening of elastomers and rubbers when the deformation is very large (36). As a result, one should use caution when applying Eq. 6 for very large indentation depths (e.g., for δ/h ≥ 0.8). In combination with the modified Hertz theory that accounts for finite gel thickness and large deformation effects, the microsphere indentation method offers an alternative way to accurately measure the modulus of soft gels in situ without the need for expensive equipment such as an atomic force microscope or rheometer.
Here we comment on assumption 4 (see above) of the Hertz theory. Adhesion increases the contact area predicted by the Hertz model. Adhesive interactions of gels and elastomers with hard surfaces are typically governed by dispersive forces. The thermodynamic work of adhesion, W, on these surfaces is quite low, on the order of 40–80 mJ/m2; nevertheless, their effect on contact mechanics can be important, particularly when the indentation depth is small. Indeed, overestimation of E at shallow indentation depth is often attributed to surface interaction between the indenter and the substrate in an indentation test (22). One can quantify the effect of adhesion by using the Johnson-Kendall-Roberts (JKR) theory (37). We include this result in the Supporting Material because it is not directly relevant to this work.
One might notice in Table 1 that there is a systematic decrease in the modulus value with the increase of sample thickness. In theory, the modulus should be independent of sample thickness after correction. This result may indicate that the gels in the thicker samples were softer than those in the thinner ones. In early experiments, we found that it took a longer time for thicker samples to fully polymerize compared with the thin samples. To ensure that the thick samples were fully polymerized, we developed a new (to our knowledge) polymerization procedure in which the samples were placed under a 100% humidity condition for 2 h, in contrast to the usual 30 min polymerization time on a bench top used in recent studies (35). Samples of all thicknesses shown in Table 1 were prepared using the same procedure.
Finally, we would like to emphasize the importance of in situ gel characterization, because the gel modulus depends sensitively on detailed gel preparation steps, including the humidity, degassing vacuum pressure, and duration of polymerization. In the future, we would like to extend this method to measure the modulus of a cell-embedded biomatrix layer and probe the process of cellular biomatrix remodeling in real time.
Acknowledgments
M.W. and M.S.H. thank Cynthia Reinhart-King, Joseph Califano, and Yu Li Wang for helpful discussions on the making of polyacrylamide gel and the microsphere indentation method.
R.L. and C.Y.H. acknowledge support from the National Science Foundation (Materials and Surface Engineering program of the Civil, Mechanical and Manufacturing Innovation Division, grant No. CMMI-0900586). M.S.H. and M.W. thank support from the National Center for Research Resources (R21RR025801) and the National Institutes of Health (NCI-R21CA138366).
Contributor Information
Mingming Wu, Email: mw272@cornell.edu.
Chung-Yuen Hui, Email: ch45@cornell.edu.
Supporting Material
References
- 1.Engler A.J., Sen S., Discher D.E. Matrix elasticity directs stem cell lineage specification. Cell. 2006;126:677–689. doi: 10.1016/j.cell.2006.06.044. [DOI] [PubMed] [Google Scholar]
- 2.Pelham R.J., Jr., Wang Y. Cell locomotion and focal adhesions are regulated by substrate flexibility. Proc. Natl. Acad. Sci. USA. 1997;94:13661–13665. doi: 10.1073/pnas.94.25.13661. [DOI] [PMC free article] [PubMed] [Google Scholar]
- 3.Isenberg B.C., Dimilla P.A., Wong J.Y. Vascular smooth muscle cell durotaxis depends on substrate stiffness gradient strength. Biophys. J. 2009;97:1313–1322. doi: 10.1016/j.bpj.2009.06.021. [DOI] [PMC free article] [PubMed] [Google Scholar]
- 4.Califano J.P., Reinhart-King C.A. The effects of substrate elasticity on endothelial cell network formation and traction force generation. Conf. Proc. IEEE Eng. Med. Biol. Soc. 2009;2009:3343–3345. doi: 10.1109/IEMBS.2009.5333194. [DOI] [PubMed] [Google Scholar]
- 5.Paszek M.J., Zahir N., Weaver V.M. Tensional homeostasis and the malignant phenotype. Cancer Cell. 2005;8:241–254. doi: 10.1016/j.ccr.2005.08.010. [DOI] [PubMed] [Google Scholar]
- 6.Dembo M., Wang Y.L. Stresses at the cell-to-substrate interface during locomotion of fibroblasts. Biophys. J. 1999;76:2307–2316. doi: 10.1016/S0006-3495(99)77386-8. [DOI] [PMC free article] [PubMed] [Google Scholar]
- 7.Chen J., Li H., Wang J.H. α-Smooth muscle actin expression enhances cell traction force. Cell Motil. Cytoskeleton. 2007;64:248–257. doi: 10.1002/cm.20178. [DOI] [PubMed] [Google Scholar]
- 8.Lopez-Garcia M.D., Beebe D.J., Crone W.C. Mechanical interactions of mouse mammary gland cells with collagen in a three-dimensional construct. Ann. Biomed. Eng. 2010;38:2485–2498. doi: 10.1007/s10439-010-0015-5. [DOI] [PubMed] [Google Scholar]
- 9.Wang J.H., Lin J.S. Cell traction force and measurement methods. Biomech. Model. Mechanobiol. 2007;6:361–371. doi: 10.1007/s10237-006-0068-4. [DOI] [PubMed] [Google Scholar]
- 10.Wang N., Ostuni E., Ingber D.E. Micropatterning tractional forces in living cells. Cell Motil. Cytoskeleton. 2002;52:97–106. doi: 10.1002/cm.10037. [DOI] [PubMed] [Google Scholar]
- 11.Tan J.L., Tien J., Chen C.S. Cells lying on a bed of microneedles: an approach to isolate mechanical force. Proc. Natl. Acad. Sci. USA. 2003;100:1484–1489. doi: 10.1073/pnas.0235407100. [DOI] [PMC free article] [PubMed] [Google Scholar]
- 12.Sniadecki N.J., Chen C.S. Microfabricated silicone elastomeric post arrays for measuring traction forces of adherent cells. Methods Cell Biol. 2007;83:313–328. doi: 10.1016/S0091-679X(07)83013-5. [DOI] [PubMed] [Google Scholar]
- 13.Sabass B., Gardel M.L., Schwarz U.S. High resolution traction force microscopy based on experimental and computational advances. Biophys. J. 2008;94:207–220. doi: 10.1529/biophysj.107.113670. [DOI] [PMC free article] [PubMed] [Google Scholar]
- 14.Merkel R., Kirchgessner N., Hoffmann B. Cell force microscopy on elastic layers of finite thickness. Biophys. J. 2007;93:3314–3323. doi: 10.1529/biophysj.107.111328. [DOI] [PMC free article] [PubMed] [Google Scholar]
- 15.Lombardi M.L., Knecht D.A., Lee J. Traction force microscopy in Dictyostelium reveals distinct roles for myosin II motor and actin-crosslinking activity in polarized cell movement. J. Cell Sci. 2007;120:1624–1634. doi: 10.1242/jcs.002527. [DOI] [PubMed] [Google Scholar]
- 16.Lee J. The use of gelatin substrates for traction force microscopy in rapidly moving cells. Methods Cell Biol. 2007;83:297–312. doi: 10.1016/S0091-679X(07)83012-3. [DOI] [PubMed] [Google Scholar]
- 17.Harris A.K., Wild P., Stopak D. Silicone rubber substrata: a new wrinkle in the study of cell locomotion. Science. 1980;208:177–179. doi: 10.1126/science.6987736. [DOI] [PubMed] [Google Scholar]
- 18.Galbraith C.G., Sheetz M.P. A micromachined device provides a new bend on fibroblast traction forces. Proc. Natl. Acad. Sci. USA. 1997;94:9114–9118. doi: 10.1073/pnas.94.17.9114. [DOI] [PMC free article] [PubMed] [Google Scholar]
- 19.du Roure O., Saez A., Ladoux B. Force mapping in epithelial cell migration. Proc. Natl. Acad. Sci. USA. 2005;102:2390–2395. doi: 10.1073/pnas.0408482102. Erratum in Proc. Natl. Acad. Sci. USA. 2005;102:14122. [DOI] [PMC free article] [PubMed] [Google Scholar]
- 20.Burton K., Taylor D.L. Traction forces of cytokinesis measured with optically modified elastic substrata. Nature. 1997;385:450–454. doi: 10.1038/385450a0. [DOI] [PubMed] [Google Scholar]
- 21.Dimitriadis E.K., Horkay F., Chadwick R.S. Determination of elastic moduli of thin layers of soft material using the atomic force microscope. Biophys. J. 2002;82:2798–2810. doi: 10.1016/S0006-3495(02)75620-8. [DOI] [PMC free article] [PubMed] [Google Scholar]
- 22.Frey M.T., Engler A.D.E., Wang Y.L. Microscopic methods for measuring the elasticity of gel substrates for cell culture: microspheres, microindenters, and atomic force microscopy. Methods Cell Biol. 2007;83:47–65. doi: 10.1016/S0091-679X(07)83003-2. [DOI] [PubMed] [Google Scholar]
- 23.Reinhart-King C.A., Dembo M., Hammer D.A. Endothelial cell traction forces on RGD-derived polyacrylamide substrate. Langmuir. 2003;19:1573–1579. [Google Scholar]
- 24.Hu Y., Zhao X., Suo Z. Using indentation to characterize poroelasticity of gels. Appl. Phys. Lett. 2010;96:121904. [Google Scholar]
- 25.Mow V.C., Kuei S.C., Armstrong C.G. Biphasic creep and stress relaxation of articular cartilage in compression? Theory and experiments. J. Biomech. Eng. 1980;102:73–84. doi: 10.1115/1.3138202. [DOI] [PubMed] [Google Scholar]
- 26.White M.L. The permeability of an acrylamide polymer gel. J. Phys. Chem. 1960;64:1563–1565. [Google Scholar]
- 27.Shull K.R., Crosby A.J. Axisymmetric adhesion tests of pressure sensitive adhesives. J. Eng. Mater. Technol. 1997;119:211–215. [Google Scholar]
- 28.Shull K.R. Contact mechanics and the adhesion of soft solids. Mater. Sci. Eng. Rep. 2002;36:1–45. [Google Scholar]
- 29.Jaffar M.J. A numerical solution for axisymmetric contact problems involving rigid indenters on elastic layers. J. Mech. Phys. Solids. 1988;36:401–416. [Google Scholar]
- 30.Matthewson M.J. Axi-symmetric contact on thin compliant coatings. J. Mech. Phys. Solids. 1981;29:89–113. [Google Scholar]
- 31.Holzaphel G.A. Wiley; New York: 2000. Nonlinear Solid Mechanics: A Continuum Approach for Engineering. [Google Scholar]
- 32.Yoffe E.H. Modified Hertz theory for spherical indentation. Philos. Mag. A. 1984;50:813–828. [Google Scholar]
- 33.Lin Y.Y., Chen H.Y. Effect of large deformation and material nonlinearity on the JKR test of soft elastic materials. J. Polym. Sci. B. Polym. Phys. 2006;44:2912–2922. [Google Scholar]
- 34.ABAQUS, Version 6.7. Dassault Systèmes Simulia Corp., Providence, RI.
- 35.Yeung T., Georges P.C., Janmey P.A. Effects of substrate stiffness on cell morphology, cytoskeletal structure, and adhesion. Cell Motil. Cytoskeleton. 2005;60:24–34. doi: 10.1002/cm.20041. [DOI] [PubMed] [Google Scholar]
- 36.Boyce M.C., Arruda E.M. Constitutive models of rubber elasticity: a review. Rubber Chem. Technol. 2000;73:504–523. [Google Scholar]
- 37.Johnson K.L., Kendall K., Roberts A.D. Surface energy and the contact of elastic solids. Proc. R. Soc. Lond. A. 1971;324:301–313. [Google Scholar]
Associated Data
This section collects any data citations, data availability statements, or supplementary materials included in this article.