

Abstract
A stable intestinal microbiota is important in maintaining human physiology and health. Although there have been a number of studies using in vitro and in vivo approaches to determine the impact of diet and xenobiotics on intestinal microbiota, there is no consensus for the best in vitro culture conditions for growth of the human gastrointestinal microbiota. To investigate the dynamics and activities of intestinal microbiota, it is important for the culture conditions to support the growth of a wide range of intestinal bacteria and maintain a complex microbial community representative of the human gastrointestinal tract. Here, we compared the bacterial community in three culture media: brain heart infusion broth and high- and low-carbohydrate medium with different growth supplements. The bacterial community was analyzed using denaturing gradient gel electrophoresis (DGGE), pyrosequencing and real-time PCR. Based on the molecular analysis, this study indicated that the 3% fecal inoculum in low-concentration carbohydrate medium with 1% autoclaved fecal supernatant provided enhanced growth conditions to conduct in vitro studies representative of the human intestinal microbiota.
1. Introduction
The human intestinal microbiota is a complex community composed of at least several hundred different species of bacteria with approximately 1011–1012 cells per gram of feces [1–4]. The intestinal microbiota plays a critical role in human health including colonization resistance, nutrition, metabolism of nondigestible dietary components and xenobiotics, proliferation and differentiation of intestinal mucosal epithelial cells, and homeostasis of the immune system [5–7]. Direct analysis of the intestinal microbiota in the human colon is inherently difficult for routine experiments. Therefore, most studies are conducted with human fecal specimens, animal models, in vitro batch culture, and continuous culture systems that mimic the human gastrointestinal tract. However, recently, a study using high-throughput anaerobic culture techniques reported that 56% of human fecal microbiota belongs to readily cultured species, over 40% of gut microbiota was uncultured species to date [3, 8, 9]. One of the reasons for this limitation generates from the difficulty of providing all of the appropriate nutrients and conditions for growth of the complex intestinal microbiota community. Therefore, research to provide more information on in vitro culture conditions as the study by Goodman et al. [8] would enhance the evaluation of perturbation of the intestinal microbiota by factors that might adversely affect human health.
Molecular techniques that target the 16S rRNA gene and other genetic markers have been used to analyze microbial community ecology in the human intestine. Denaturing gradient gel electrophoresis (DGGE) has been used to monitor differences and changes in the overall microbial community from fecal samples [10–12], and quantitative real-time PCR has provided numerical abundance data for fecal microbiota [13, 14]. Recently, application of high-throughput techniques such as pyrosequencing and the human intestinal tract chip (HITChip) microarray have been used to obtain deep phylogenetic analysis of intestinal microbiota [12, 15–17]. In the present study, DGGE, real-time PCR, and pyrosequencing were used to profile the abundance and diversity of the bacterial community from human fecal inoculum grown under different culture conditions.
The aim of this study was to compare various batch culture conditions for activating and maintaining a complex fecal microbiota community to mimic growth conditions of the gastrointestinal tract. The culture conditions developed in this investigation can be applied for future research to determine the impact of antimicrobial agents, food contaminants, xenobiotics, probiotics, and dietary supplements on the human intestinal microbiota.
2. Material and Methods
2.1. Fecal Microbiota Culture Conditions
Fecal samples were obtained from 4 male volunteers aged 50–60 years. Volunteers were healthy and had not used antibiotics for the past 6 months. Fecal samples were stored at −80°C and used within 1 week. Each fecal sample was coded Individual A, B, C, and D.
Fecal samples were cultured in brain heart infusion (BHI) broth, modified high-concentration carbohydrate medium (HCM), or low-concentration carbohydrate medium (LCM) [18, 19]. The composition of high- and low-carbohydrate media is described in Table 1. Feces were diluted with anaerobic maximum recovery diluent (MRD; LabM IDG, Bury, UK) buffer to a final concentration of 25% (w/v). To compare the difference of microbiota grown in three media, fecal suspensions were diluted to give an inoculum concentration of 1% (w/v), then inoculated in each medium (10 mL of final volume), and cultured anaerobically at 37°C. The growth was analyzed by optical density (OD) and flow cytometry on an Accuri C6 FCM (Accuri Cytometers, Ann Arbor, Mich, USA) following the manufacturers instruction with collected samples at each time point. To determine the optimal incubation time and check the metabolic activity of the microbiota, 1% fecal suspension was inoculated in culture medium with 6.5 μM gentian violet. Decolorization of gentian violet indicates the metabolic activity of fecal microbiota [20, 21]. Fecal supernatants were assessed as medium supplements to determine whether unknown growth factors affect in vitro growth of intestinal microbiota. Individual fecal supernatant was prepared from 25% diluted fecal specimens with anaerobic MRD buffer after centrifugation at 11,000 rpm for 30 minutes. Autoclaved fecal supernatant was added to each medium with a final concentration 1% (v/v). The optimal fecal inoculum concentration was also determined by the inoculating 0.1 to 5% of inoculum to low carbohydrate medium. The growth of each inoculum was analyzed by optical density at 600 nm and by flow cytometry (FCM).
Table 1.
Medium components for the optimal growth of intestinal microbiotaa.
| Chemical component | Conc. (g L−1) | Chemical component | Conc. (g L−1) | ||
|---|---|---|---|---|---|
| High | Low | High | Low | ||
| Starch | 5.0 | 0.5 | FeSO4·7H2O | 0.005 | 0.005 |
| Pectin (citrus) | 2.0 | 0.5 | NaCl | 4.5 | 4.5 |
| Guar gum | 1.0 | 0.5 | KCl | 4.5 | 4.5 |
| Porcine gastric typeIII mucin | 4.0 | 0.5 | KH2PO4 | 0.5 | 0.5 |
| Xylan (Oat-spelt) | 2.0 | 0.5 | MgSO4·7H2O | 1.25 | 1.25 |
| Arabinogalactan (larch wood) | 2.0 | 0.5 | CaCl2·6H2O | 0.15 | 0.15 |
| Inulin | 1.0 | 1.0 | NaHCO3 | 1.5 | 1.5 |
| Casein | 3.0 | 3.0 | Cysteine | 0.8 | 0.8 |
| Peptone water | 5.0 | 0.5 | Hemin | 0.05 | 0.05 |
| Tryptone | 5.0 | 0.5 | Tween 80 | 1.0 | 1.0 |
| Bile salts no.3 | 0.4 | 0.4 | Resazurin (0.01%) |
1 mL | 1 mL |
| Yeast extract | 4.5 | 4.5 | Vitamin solution | 1 mL | 1 mL |
| Vitamin solution (mg L−1) | |||||
| Menadione | 1.0 | Vitamin B12 | 0.5 | ||
| Biotin | 2.0 | Thiamine | 4.0 | ||
| Pantothenate | 10.0 | ρ-Aminobenzoic acid | 5.0 | ||
| Nicotinamide | 5.0 | ||||
2.2. DNA Extraction and DGGE Analysis
Genomic DNA was extracted from 1 mL of samples at each time point using the DNA Elution accessory kit of the RNA power soil total RNA isolation kit (MoBio Laboratories, Carlsbad, Calif, USA) by following the manufacturer's protocol. Preliminary experiments showed that this kit had the best extraction efficiency (produce high concentration of DNA from same amount of fecal material) among several kits (data not shown). DNA extractions were performed from triplicate samples independently.
To conduct DGGE analysis, 16S rRNA gene fragments of the V3 region were amplified using primers GC-clamp-340f (5′-TCC TAC GGG AGG CAG CAG-3′) and 518r (5′-ATT ACC GCG GCT GCT GG-3′) as described [22, 23]. The PCR reaction was performed using a Mastercycler gradient instrument (Eppendorf, Hauppauge, NY, USA), in a final volume of 50 μL with 10X Taq buffer, dNTP mixture (Takara, Shiga, Japan), 10 μM of each primer (MWG-Biotech, Ebersberg, Germany), 2 U of Taq polymerase (Ex Taq; Takara), and 1 μL of template. After initial denaturation at 94°C for 5 minutes, amplification consisted of 30 cycles of denaturation (30 seconds, 94°C), primer annealing (30 seconds, 55°C), and primer extension (30 seconds, 72°C) and a final extension step of 7 minutes at 72°C. The PCR product was checked by using 2% agarose gel electrophoresis and visualized using a Gel doc system (Biorad, Hercules, Calif, USA). PCR products were concentrated and purified with the QIAquick PCR purification kit (Qiagen Inc., Valencia, Calif, USA).
DGGE was conducted using a D-Code system (Biorad) with 8% (w/v) polyacrylamide gels contained 40%–65% denaturant gradient, 1 mm thick, in 1X TAE buffer. The equal amounts of purified PCR products were loaded on gel, and electrophoresis was performed at 25 V for 15 minutes then at 70 V for 16 hours and 30 minutes at 60°C. The gel was stained in 250 mL of running buffer containing ethidium bromide (50 μg mL−1) for 15 minutes and then rinsed in 250 mL of running buffer for 20 minutes. The stained gels were photographed using a Gel doc system (Biorad). The dominant bands were cut out from the gel and sequenced. The sequences were identified using BLAST search on the GenBank database and the database of type strains at EzTaxon server [24]. The profile of DGGE gel was analyzed with the BioNumerics program, version 6.0 (Applied Maths, St.-Martens-Latem, Belgium). Cluster analysis of the band pattern was performed using the unweighted pair group method using arithmetic averages (UPGMA) and the similarity between lanes was calculated based on the band position [25]. The Dice coefficient was used to create dendrograms of the DGGE profiles obtained from different samples.
2.3. Quantitative Real-Time PCR
Real-Time PCR were performed in a final 25 μL volume containing 12.5 μL of 2X iQ SYBR Green Supermix (Biorad), 10 μM of each primer (MWG-Biotech), 1 μL of template DNA (tenfold dilution series of standard and samples DNA) or distilled water (negative control). Bact349F (5′-AGG CAG CAG TDR GGA AT-3′) and Bact518R (5′-ATT ACC GCG GCT GCT GG-3′) were used to quantify total bacteria, Btr275f (5′-CGA TGG ATA GGG GTT CTG-3′) and Btr555r (5′-CCC TTT AAA CCC AAT RAW TCC GG-3′) were used for Bacteroidetes, Firm350f (5′-GGC AGC AGT RGG GAA TCT TC-3′) and Firm814r (5′-ACA CYT AGY ACT CAT CGT TT-3′) were for Firmicutes [26–28]. The quantifications were performed with three independent real-time PCR runs using the CFX96 Real-Time PCR Detection system (Biorad), associated with CFX manager interface software (version 1.0.1035.131; Biorad). The amplifications were carried out with the following steps: 50°C for 2 minutes, 95°C for 10 minutes, and 40 cycles of 95°C for 10 seconds and 60°C for 30 seconds. Fluorescent signals were detected in the last step of each cycle. Melting curve data were obtained from 60°C to 95°C at a rate of 0.5°C sec−1 with continuous measurements of the SYBR Green I signal intensities. Melting point analysis allowed the confirmation of the specificity of the amplification products. DNAs from cultures of Escherichia coli ATCC25922, Bacteroides eggerthii ATCC27754, and Clostridium butyricum ATCC19398 were used to construct standard curves for quantification by plotting the CT values obtained from amplification of dilution series.
2.4. Pyrosequencing and Data Analysis
For pyrosequencing, amplification of genomic DNA was performed using barcoded primers, which targeted the V1 to V3 region of the bacterial 16S rRNA gene. The amplification, sequencing, and basic analysis were performed according to the methods described by Chun et al. [29] and completed by Chunlab Inc. (Seoul, Korea) using a 454 GS FLX Titanium Sequencing system (Roche, Branford, Conn, USA). Briefly, analyzed sequencing reads of each sample were separated by unique barcode and filtered to remove reads, which was shorter than 300 bp or the average quality score of read was less than 25 or containing 2 more ambiguous nucleotides (Ns), and then removed chimera products for further analyses [29, 30]. The extended EzTaxon database (http://www.eztaxon-e.org/), which contains representative sequences of both cultured and uncultured bacteria with hierarchical taxonomic classification, was used for taxonomic assignments. The pyrosequencing reads were compared with sequences in the EzTaxon-e database using BLASTN search and obtained similarity using pairwise comparison, and then the sequences were assigned a taxonomic classification through using the criteria of ≥97% sequence identity for species, ≥94% identity for genus, ≥90% identity for family, ≥85% identify for order, ≥80% identity for class, and ≥75% identity for phylum. If the sequence identity was below the cutoff value, the sequence was assigned to the “unclassified” group at each phylogenetic level. The diversity index and statistical analysis were performed using Mothur program with the cutoff value of 97% similarity for assigning phylotypes [31].
2.5. Nucleotide Sequences Accession Numbers
Bacterial sequences from excised DGGE bands were submitted to the GenBank database under accession numbers from HQ645054 to HQ645071. The sequence reads from pyrosequencing are available in the EMBL SRA database under the study accession number ERP000433 (http://www.ebi.ac.uk/ena/data/view/ERP000433).
3. Results and Discussion
3.1. Comparison of Different Media and the Effect of Fecal Supernatant
Brain heart infusion (BHI), low-concentration carbohydrate (LCM), and high-concentration carbohydrate media (HCM) were used for intestinal microbiota growth. Previous studies used HCM in human intestinal continuous culture [18, 19]. However, the digestible carbohydrate concentrations in the large intestine are lower than carbohydrate concentration in high carbohydrate medium [32]. Therefore, we wanted to compare HCM, LCM, and BHI media under the same inoculum and growth conditions. Diluted feces (1%) were inoculated in the different media, and the intestinal microbiota growth was analyzed by spectrophotometer and quantitative real-time PCR (Supplementary Figure 1 available at doi: 10.1155/2011/838040). The growth of intestinal microbiota showed maximum OD at 18 hours in LCM and HCM, while the maximum in BHI medium was earlier in the incubation period.
The 16S rRNA genes of cultured bacteria in each medium increased over the incubation period. The cell number of cultured bacteria was enumerated by flow cytometer. The cell number of inoculum was 4.8 × 10⁹ cells/mL−1 (mean value of cell numbers in inoculum of three media). The highest cell number was detected at 18 hours in LCM (1.85 × 10¹⁰ cells/mL−1) and HCM (1.19 × 10¹⁰ cells/mL−1), whereas BHI reached maximum cell numbers (1.64 × 10¹⁰ cells/mL−1) after 18 hours. To determine the metabolic activity of cultured bacteria, the fecal microbiota cultures were dosed with gentian violet, and the activity was monitored by measuring color disappearance with time. The microbiota completely decolorized gentian violet after 18 hours of incubation (Supplementary Figure 2). Eighteen hours was chosen, because the residence time of readily digestible compounds in intestinal tract is generally within a day [33]. The growth of intestinal microbiota in different media showed similar maximum OD and the total bacterial 16S rRNA gene increased over time (Supplementary Figure 1). However, this result did not correlate with the cell numbers determined by flow cytometry. This difference was most likely caused by the difference of rRNA gene copy numbers in each species.
DGGE fingerprinting was used to evaluate the ability of each medium to maintain the initial fecal microbiota. The DGGE banding patterns derived from the initial cultures were compared to those from the 18 hours cultures, and similarity between inoculum and cultured sample was used as the measure of microbiota stability. Overall, the number of bands and the dominant bands were different in each medium (Figure 1(a)). The band numbers from the in vitro cultures were fewer than the fecal inoculum and formed different profiles from the inoculum on the DGGE gel. The analysis of excised bands from the DGGE gels is given in Table 2. The sequences of bands were assigned to the Firmicutes, Bacteroidetes, and Actinobacteria phyla. Firmicutes and Bacteroidetes were major phyla in both the fecal inoculum and the in vitro culture. Bands affiliated to Bacteroidetes were more dominant in the in vitro culture after 18 hours (band number 1, 6, and 11) than at zero time. The dominant Firmicutes bands (band 2, 4, 5, 10, and 13) at zero time were less dominant in cultured samples. This result was supported by previous studies that the ratio of Bacteroidetes/Firmicutes was different between the in vitro intestinal model and the inoculum [12, 34]. Band number 5 contained pairs of DNA fragments, because similar sequences had similar denaturant gradient and the length of amplified fragment for DGGE (ranged from 150 to 180 bp) was insufficient to distinguish similar sequences completely.
Figure 1.
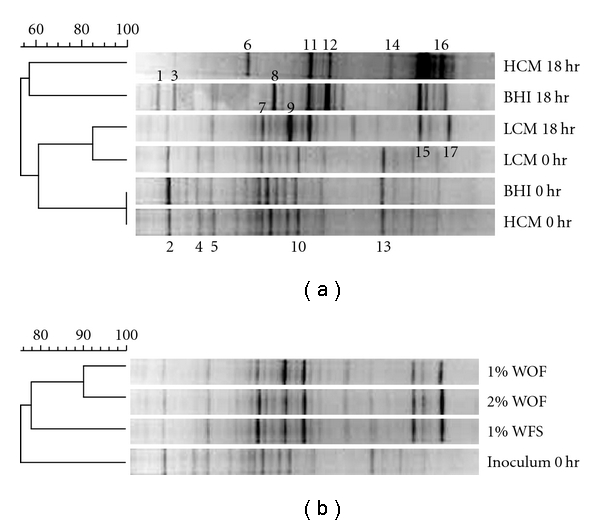
Dendrogram based on Dice coefficient of the DGGE profiles of individual A. (a) The DGGE profiles of cultured sample from individual A in the low-concentration carbohydrate medium (LCM), high-concentration carbohydrate medium (HCM), and brain heart infusion medium (BHI) were compared at 0 hour and after 18 hours. The numbered bands were excised and sequenced. (b) The comparison of 1% inoculum with 1% fecal supernatant (1% WFS), 1% inoculum without 1% fecal supernatant (1% WOF), and 2% inoculum without fecal supernatant (2% WOF) after 18 hours growth time in individual A samples.
Table 2.
The identification of the excised DGGE bands obtained from fecal samples of individual A in different medium at zero time and after 18 hours. The position of each band in gel profile is shown in Figure 1(a). The numbers in parentheses refer to GenBank accession number.
| Band | Phylum | The closest type straina | Similarity | The nearest sequenceb | Similarity |
|---|---|---|---|---|---|
| 1 | Bacteroidetes | Parabacteroides merdae ATCC 43184 (AAXE02000112) | 100% | Uncultured bacterium clone HFV09_495 (GU107934) | 100% |
| 2 | Firmicutes | Ruminococcus torques ATCC 27756 (AAVP02000040) | 99.34% | Uncultured bacterium clone 429C08 (HQ237429) | 100% |
| 3 | Firmicutes | Ruminococcus lactaris ATCC 29176 (L76602) | 98.61% | Uncultured bacterium clone S2-190 (GQ898449) | 100% |
| 4 | Bacteroidetes | Alistipes finegoldii ANH 2437 (AJ518874) | 90.18% | Uncultured bacterium clone (FP085183) | 98.80% |
| 5(1) | Bacteroidetes | Bacteroides uniformis JCM 5828 (AB050110) | 100% | Uncultured bacterium clone 425D06 (HQ237168) | 100% |
| 5(2) | Firmicutes | Pseudobutyrivibrio ruminis (X95893) | 100% | Uncultured bacterium clone 426B02 (HQ237240) | 100% |
| 6 | Bacteroidetes | Butyricimonas virosa MT12 (AB443949) | 93.33% | Uncultured bacterium clone HFV09_122 (GU107561) | 100% |
| 7 | Firmicutes | Blautia luti DSM 14534 (AJ133124) | 100% | Uncultured bacterium clone 428B12 (HQ237293) | 100% |
| 8 | Firmicutes | Blautia wexlerae WAL 14507 (EF036467) | 99.31% | Uncultured bacterium clone HFV08_232 (GU107126) | 99.31% |
| 9 | Firmicutes | Subdoligranulum variabile DSM 15176 | 98.04% | Uncultured bacterium clone HFV08_426 (GU107320) | 100% |
| 10 | Firmicutes | Phascolarctobacterium faecium ACM3679 (X72865) | 100% | Uncultured bacterium clone BFV04_210 (GU099903) | 100% |
| 11 | Bacteroidetes | Alistipes putredinis DSM 17216 (ABFK01000017) | 98.18% | Uncultured bacterium clone HFV09_155 (GU107594) | 100% |
| 12 | Firmicutes | Ruminococcus flavefaciens ATCC 19208 (X83430) | 93.10% | Uncultured bacterium clone HFV07_265 (GU106646) | 100% |
| 13 | Firmicutes | Faecalibacterium prausnitzii ATCC 27768 (AJ413954) | 98.69% | Uncultured bacterium clone b_007_f03 (GQ179311) | 100% |
| 14 | Firmicutes | Eubacterium tenue ATCC 25553 (DQ445863) | 100% | Uncultured bacterium clone 429B01 (HQ237439) | 100% |
| 15 | Firmicutes | Clostridium quinii DSM 6736 (X76745) | 93.91% | Uncultured bacterium clone 429C11 (HQ237448) | 100% |
| 16 | Firmicutes | Eubacterium eligens ATCC 27750 (CP001104) | 98.68% | Uncultured bacterium clone 426G01 (HQ237235) | 100% |
| 17 | Actinobacteria | Collinsella aerofaciens ATCC 25986 (AAVN02000013) | 97.40% | Uncultured bacterium clone RL307_aam06g08 (DQ807453) | 99% |
aThe closest type strain information obtained from EzTaxon database.
bThe nearest sequence was identified using GenBank database.
BHI and LCM had relatively similar numbers of bands (20–22 bands) and HCM had fewer bands (14 bands). The lower number of bands on HCM may be due to the high carbohydrate content in the medium. High carbohydrate promotes the proliferation of Bacteroidetes, which possess a larger glycobiome than Firmicutes [34, 35]. The predominance of Bacteroidetes could affect the growth of other phyla. Cluster analysis showed that the microbiota of LCM was similar to inoculum population (Figure 1(a)). Although the number of bands in BHI medium was similar to that of LCM, their profiles and dominant bands were more different from the inoculum than those in LCM. Moreover, the profile of minor bands in LCM was similar to the profile of inoculum, and the number of minor bands was more abundant than BHI medium. Profiles of LCM after 18 hours displayed the highest similarity (78.94%; mean value of triplicate samples) with profiles of original inoculum at zero time. Therefore, the LCM medium was used as basal medium for intestinal microbiota growth culture conditions.
There are numerous unknown metabolites and potential growth factors in fecal material. Furthermore, they are unique in each individual because of interindividual differences of intestinal microbiota population, dietary habits, and metabolism [36]. Fecal supernatants added to in vitro cultures could provide compounds that enhance microbial growth. Three different culture conditions (1% of fecal inoculum, 1% of fecal inoculum with 1% fecal supernatant, or 2% fecal inoculum) were compared using DGGE profile (Figure 1(b)) and revealed relatively similar band patterns. However, the inoculum with 1% fecal supernatant added to LCM was more similar to original inoculum than cultures without fecal supernatant in population cluster analysis (80.37% similarity).
3.2. Optimization of Inoculum Concentration
The inoculum concentration of feces is a significant factor for in vitro culture conditions, because the number and diversity of bacteria can affect growth. Therefore, we determined using DGGE and real-time PCR, the optimal inoculum concentration for use in this type of in vitro human fecal culture experiments. Different fecal inoculum suspensions (0.1%, 0.5%, 1%, 2%, 3%, 4%, and 5%) were used to compare the bacterial communities at each concentration. We did not test concentrations over 5% because of the difficulty with handling the dense and viscous fecal samples. The DGGE profiles of different inoculum concentrations were relatively similar to each other and as expected the interindividual variation of microbial community was found (Figure 2). Although profiles were relatively similar among different inoculum concentrations, small variations of band intensity were observed. Cluster analysis of profiles showed that 1%, 2%, or 3% inoculum cultures were the most similar to original inoculum in individual B and C (Figure 2). We investigated the change of bacterial communities at each incubation time (Supplementary Figure 3). The communities of original fecal bacteria were similar to those of inoculum and the profiles of bacterial communities were stable after 6 hours of incubation in every inoculum concentration. In addition, the batch culture was reproducible, as determined by the cluster analysis of triplicate cultures in DGGE analysis (data not shown).
Figure 2.
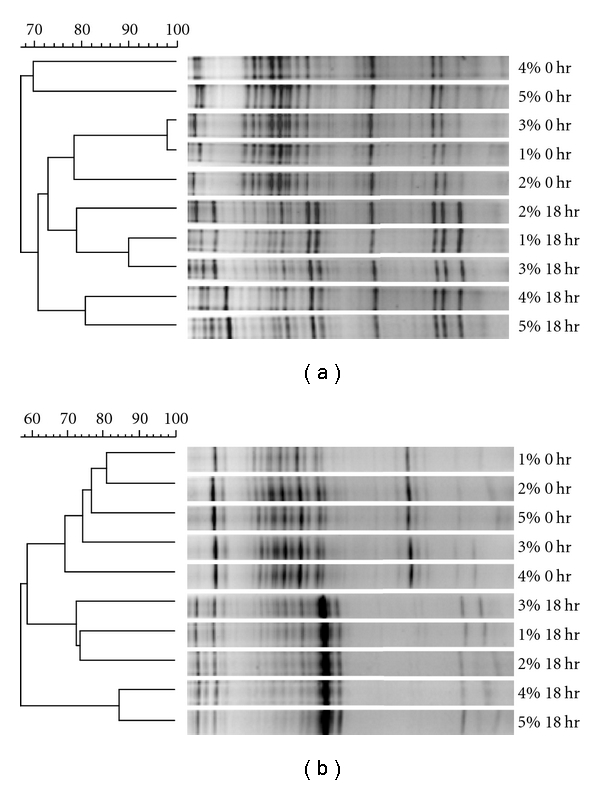
The comparison of DGGE profiles from different inoculum amounts. The clustering analysis based on Dice coefficient and DGGE profile obtained at zero time and after 18 hours. The percentage indicated the inoculum amount of fecal materials. (a) The profiles obtained from individual B. (b) The cluster analysis were conducted with profiles of individual C.
The real-time PCR-based quantification was used to enumerate total bacteria, Bacteroidetes and Firmicutes in cultures with 1%–5% inoculum concentrations of individual-coded A, B, and C samples at 0 and 18 hours of incubation (Table 3). Different numbers of bacteria, Bacteroidetes and Firmicutes were found in each sample at the varied inoculum concentrations, and their growth was different in the same medium. The 16S rRNA gene copy number of total bacteria increased to 109 copies mL−1 for all cultured samples, and Bacteroidetes and Firmicutes reached to 107–109 copies mL−1. The 16S rRNA gene copies of total bacteria and Bacteroidetes in cultured fecal materials from individual C were higher than individual A and B. Firmicutes were more abundant in 18 hour cultured samples of individual B than individuals A and C. These results indicated that the different community composition affected the growth of each phylum in fecal microbiota. The increased ratio of Bacteroidetes (2.29 fold; mean value of increased copy number ratio) was more abundant than that of Firmicutes (1.90 fold). This difference indicated that Bacteroidetes grew more in the in vitro culture than Firmicutes. This result is consistent with DGGE band sequence analysis. We compared the 16S rRNA gene copies of total bacteria in 0.1%–3% inoculum cultures of individual D (Supplementary Figure 4) over time. The increased numbers of total bacterial 16S rRNA gene copies were higher in low concentration of inoculum (0.1% and 0.5%) than the high concentration of inoculum (1%–3%). This might be due to the cell number of inoculum. The batch culture with higher cell numbers has limited nutrients and there would be more competition for obtaining nutrients. However, the high concentration of inoculum (1%–3%) added to the batch culture could provide more fecal material to facilitate and personalize the cultivation of indigenous microbiota as fecal supernatant [36–38]. Therefore, 3% inoculum concentration of fecal materials was chosen for in vitro culture conditions since this level would maintain a high cell number of intestinal microbiota and grow a variety of indigenous microbiota.
Table 3.
Quantification of total bacteria, Bacteroidetes and Firmicutes in different inoculum amounts of human feces from 3 individuals. All of the copy numbers were obtained from triplicate real-time PCR analyses. The efficiencies were 91.2% for total bacteria, 72.6% for Bacteroidetes, and 75.9% for Firmicutes.
| Individual | Inoculum | Total Bacteria | Bacteroidetes | Firmicutes | |||
|---|---|---|---|---|---|---|---|
| amount | Log10 copies mL−1a | Log10 copies mL−1a | Log10 copies mL−1a | ||||
| 0 hr | 18 hr | 0 hr | 18 hr | 0 hr | 18 hr | ||
| A | 1% | 7.67 ± 1.22 | 8.75 ± 81.16 | 7.56 ± 0.49 | 7.89 ± 0.34 | 7.13 ± 0.35 | 7.74 ± 0.26 |
| 2% | 8.21 ± 0.68 | 8.78 ± 0.74 | 7.79 ± 0.21 | 8.09 ± 0.19 | 7.83 ± 0.19 | 8.04 ± 0.24 | |
| 3% | 8.30 ± 0.26 | 8.74 ± 0.52 | 7.71 ± 0.17 | 8.16 ± 0.06 | 7.98 ± 0.32 | 8.15 ± 0.13 | |
| 4% | 8.72 ± 0.39 | 9.12 ± 0.21 | 8.12 ± 0.21 | 8.59 ± 0.43 | 8.36 ± 0.21 | 8.53 ± 0.28 | |
| 5% | 8.86 ± 0.14 | 9.11 ± 0.32 | 8.18 ± 0.11 | 8.48 ± 0.26 | 8.39 ± 0.18 | 8.52 ± 0.31 | |
| B | 1% | 8.80 ± 0.14 | 8.92 ± 0.10 | 8.16 ± 0.61 | 8.52 ± 0.92 | 8.37 ± 0.17 | 8.51 ± 0.17 |
| 2% | 9.22 ± 0.18 | 9.26 ± 0.10 | 8.38 ± 0.04 | 8.62 ± 0.46 | 8.88 ± 0.23 | 8.94 ± 0.10 | |
| 3% | 9.35 ± 0.15 | 9.47 ± 0.10 | 8.59 ± 0.08 | 8.77 ± 0.12 | 9.05 ± 0.07 | 9.12 ± 0.58 | |
| 4% | 9.42 ± 0.27 | 9.50 ± 0.10 | 8.74 ± 0.21 | 8.83 ± 0.59 | 9.14 ± 0.38 | 9.24 ± 0.06 | |
| 5% | 9.34 ± 0.10 | 9.63 ± 0.12 | 8.36 ± 0.08 | 8.46 ± 0.21 | 9.03 ± 0.03 | 9.40 ± 0.11 | |
| C | 1% | 8.32 ± 0.14 | 9.28 ± 0.19 | 8.13 ± 0.30 | 8.73 ± 0.56 | 7.77 ± 0.17 | 8.11 ± 0.24 |
| 2% | 8.74 ± 0.24 | 9.37 ± 0.18 | 8.46 ± 0.05 | 8.76 ± 0.17 | 8.37 ± 0.18 | 8.52 ± 0.13 | |
| 3% | 8.79 ± 0.25 | 9.36 ± 0.16 | 8.48 ± 0.20 | 8.93 ± 0.74 | 8.36 ± 0.29 | 8.78 ± 0.15 | |
| 4% | 8.80 ± 0.14 | 9.42 ± 0.20 | 8.78 ± 0.12 | 9.27 ± 0.17 | 8.29 ± 0.27 | 8.74 ± 0.10 | |
| 5% | 9.11 ± 0.14 | 9.50 ± 0.14 | 8.82 ± 0.01 | 9.23 ± 0.12 | 8.76 ± 0.14 | 9.10 ± 0.13 | |
aData are expressed as the means and standard deviation from samples.
3.3. The Microbial Community Composition of Fecal Inoculum and In Vitro Cultures
A comparison of the intestinal microbiota of each individual fecal sample before and after culturing was determined by pyrosequencing. A total of 45,674 reads were obtained from pyrosequencing and 5,843 sequences were removed by filtering process of chimera check, length cutoff, ambiguous base call and average quality check. Therefore, a total of 39,831 sequences were analyzed (ranging from 3,402 to 8,898 per sample) after the filtering process (Table 4). The average length of sequences was 385.39 bp and the observed number of phylotypes ranged from 590 to 1,287 with 92% to 97% Good's coverage. The richness of samples was investigated by rarefaction curves (Supplementary Figure 5). The changed numbers of observed phylotype and diversity indices of samples from three individuals were different at zero time and after 18 hours of incubation. Samples from individual B had the most similar observed number of phylotypes and Shannon indices between the zero time culture and the 18 hour culture among the three individuals.
Table 4.
The summary of pyrosequencing data and statistical calculations of fecal samples obtained from 3 individuals before and after 18 hours of incubation in low-carbohydrate medium.
| Read length (bp) | Phylotypeb | ||||||||
|---|---|---|---|---|---|---|---|---|---|
| Individual | Total | Analyzed | Mean | Maximum | Observed | Chao1 | Shannon | Goods | |
| reads | readsa | length | length | OTUs | estimation | index | coverage | ||
| A | 0 hr | 9,903 | 8,898 | 386.68 | 508 | 615 | 1,007.04 | 5.13 | 0.97 |
| 18 hr | 9,545 | 7,455 | 380.65 | 505 | 1,287 | 2,647.51 | 5.66 | 0.92 | |
| B | 0 hr | 8,986 | 8,158 | 379.22 | 513 | 631 | 1,190.03 | 5.12 | 0.96 |
| 18 hr | 3,908 | 3,402 | 384.63 | 508 | 590 | 1,112.43 | 5.21 | 0.92 | |
| C | 0 hr | 8,593 | 7,786 | 394.68 | 511 | 835 | 1,725.74 | 5.20 | 0.95 |
| 18 hr | 4,739 | 4,132 | 386.46 | 511 | 596 | 1,136.01 | 4.93 | 0.93 | |
aThe analyzed reads are selected by the length over 300 bp, removing chimera sequences and containing ambiguous nucleotide (N) is 0 or 1 in each sequence.
bThe cutoff value of phylotype are equal to or greater than 97% similarity.
The dominant phyla (Firmicutes, Bacteroidetes, Actinobacteria, Proteobacteria, and Verrucomicrobia) from fecal samples of each person were maintained in improved culture condition of this study (Figure 3). The abundance of Firmicutes decreased after 18 hours (average from 72.39% to 44.95%), while Bacteroidetes increased from 17.14% to 39.11% in cultured samples. Although the proportion of each phylum was changed in the in vitro cultures, the dominant phyla were maintained after 18 hours of incubation. These trends are similar to those seen in a previous gut model system analyzed using phylogenetic microarray [12]. They reported that the abundance of Bacteroidetes increased from 52.49% to 75.50% (ascending model), 80.59% (transverse model) and 75.60% (descending model), while the Firmicutes decreased from 44.57% to 16.81% (ascending), 10.56% (transverse), and 13.23% (descending). The abundances of Actinobacteria (average 4.91%) and Verrucomicrobia (0.21%) in the present study were higher than observed in the previous model system.
Figure 3.
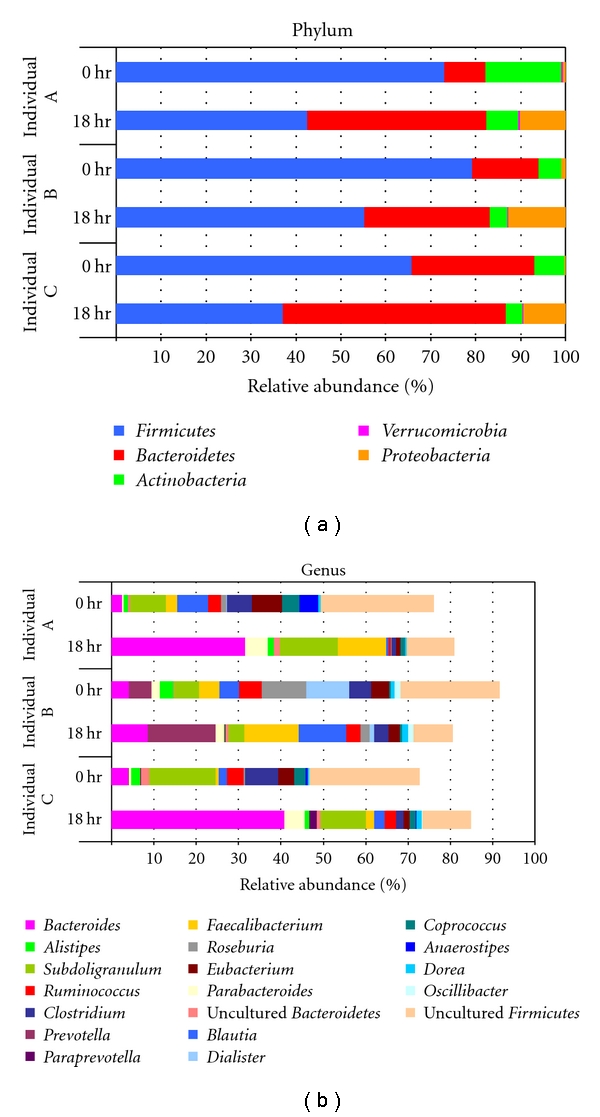
The relative abundance of dominant phyla and genera identified from pyrosequencing data. The communities of each person were compared at 0 hour and after 18 hours. The dominant phylotypes were determined by the abundance greater than 1% of total analyzed sequences.
At the genus level, a total of 210 genera (read number ≥0.01% of total analyzed reads) were retrieved from the zero time fecal cultures of individual A, B, and C, and 173 genera were obtained from the 18 hour cultured samples (Figure 3). The dominant genera were Bacteroides, Subdoligranulum, Faecalibacterium, Parabacteroides, Bifidobacterium, Ruminococcus, Eubacterium, Blautia, Roseburia, Alistipes, Clostridium, Escherichia, and Dorea (read number ≥1% of total analyzed reads). The trends of genera changes in cultured samples were relatively similar in all samples. The community profiles of the microbiota from individuals A and C were more similar to each other than to that for individual B, both at zero time and after the 18 hour incubation. Therefore, the bacterial community of each in vitro cultured sample reflected the interindividual uniqueness of the fecal microbiota.
4. Conclusions
We tested a variety of conditions for the human intestinal microbiota growth in short-term in vitro batch cultures. The combination of DGGE, real-time PCR, and pyrosequencing was sufficient to compare communities of intestinal microbiota in the different cultures. Of the combinations tested, low-concentration carbohydrate medium (LCM) supplemented with 1% fecal supernatant and inoculated with a fecal suspension to a final concentration of 3% performed best in maintaining a metabolically active diverse population of bacteria over the 18 hour incubation. The culture conditions developed in this investigation should be suitable for use in future studies on the impact of xenobiotics on the human intestinal microbiota.
Supplementary Material
Figure S1. The growth of intestinal microbiota was analyzed on different media with 1% fecal inoculum. (a) Growth curves were constructed by OD600, and (b) 16S rRNA gene copies of total bacteria were quantified by real-time PCR. Growth of intestinal microbiota in low carbohydrate medium (green), high carbohydrate medium (red), and BHI (blue).
Figure S2. Decolorization of gentian violet by fecal bacterial culture after 18 hours. Fecal inocula from three individuals were incubated with 6.5 µM gentian violet for 18 hours. Gentian violet is reductively decolorized and decolorization indicates the metabolic activity of cultured bacteria. The control sample (C) incubated gentian violet to LCM for 18 hours without fecal inoculum. The fecal inoculum from individual A (2) incubated for 18 hours with gentian violet, individual B (3) incubated with gentian violet, and individual C (5) incubated with gentian violet.
Figure S3. The DGGE profiles of each concentration inoculum (0.1, 0.5, 1, 2, 3%) from individual D at different time point were generated from amplified V3 16S rRNA gene of genomic DNA. M denotes marker lanes, F denotes original fecal microbiota, and each number above lane is culture time (hour).
Figure S4. The growth of different fecal inoculum concentration from individual D was analyzed with spectrophotometer and quantitative real-time PCR. (a) Growth curves were constructed by ∆OD600, and (b) total bacterial 16S rRNA gene copies were compared.
Figure S5. The rarefaction curves for three individual samples of 0 hour and 18 hour. The numbers of observed phylotypes (OTUs) from samples were calculated by 97% similarity.
Acknowledgments
This research was supported in part by an appointment to the Research Participation Program at the National Center for Toxicological Research administered by the Oak Ridge Institute for Science and Education through an interagency agreement between the U.S. Department of Energy and the Food and Drug Administration. The views presented in this paper are not necessarily those of the Food and Drug Administration. Bong-Soo Kim and Jong Nam Kim contributed equally to this work.
References
- 1.Ley RE, Peterson DA, Gordon JI. Ecological and evolutionary forces shaping microbial diversity in the human intestine. Cell. 2006;124(4):837–848. doi: 10.1016/j.cell.2006.02.017. [DOI] [PubMed] [Google Scholar]
- 2.Carman RJ, Van Tassell RL, Wilkins TD. The normal intestinal microflora: ecology, variability and stability. Veterinary and Human Toxicology. 1993;35(1):11–14. [PubMed] [Google Scholar]
- 3.Eckburg PB, Bik EM, Bernstein CN, et al. Microbiology: diversity of the human intestinal microbial flora. Science. 2005;308(5728):1635–1638. doi: 10.1126/science.1110591. [DOI] [PMC free article] [PubMed] [Google Scholar]
- 4.Franks AH, Harmsen HJM, Raangs GC, Jansen GJ, Schut F, Welling GW. Variations of bacterial populations in human feces measured by fluorescent in situ hybridization with group-specific 16S rRNA-targeted oligonucleotide probes. Applied and Environmental Microbiology. 1998;64(9):3336–3345. doi: 10.1128/aem.64.9.3336-3345.1998. [DOI] [PMC free article] [PubMed] [Google Scholar]
- 5.Gibson GR, Roberfroid MB. Dietary modulation of the human colonic microbiota: introducing the concept of prebiotics. Journal of Nutrition. 1995;125(6):1401–1412. doi: 10.1093/jn/125.6.1401. [DOI] [PubMed] [Google Scholar]
- 6.Kelly D, Conway S, Aminov R. Commensal gut bacteria: mechanisms of immune modulation. Trends in Immunology. 2005;26(6):326–333. doi: 10.1016/j.it.2005.04.008. [DOI] [PubMed] [Google Scholar]
- 7.Gill SR, Pop M, DeBoy RT, et al. Metagenomic analysis of the human distal gut microbiome. Science. 2006;312(5778):1355–1359. doi: 10.1126/science.1124234. [DOI] [PMC free article] [PubMed] [Google Scholar]
- 8.Goodman AL, Kallstrom G, Faith JJ, et al. From the cover: extensive personal human gut microbiota culture collections characterized and manipulated in gnotobiotic mice. Proceedings of the National Academy of Sciences of the United States of America. 2011;108(15):6252–6257. doi: 10.1073/pnas.1102938108. [DOI] [PMC free article] [PubMed] [Google Scholar]
- 9.Suau A, Bonnet R, Sutren M, et al. Direct analysis of genes encoding 16S rRNA from complex communities reveals many novel molecular species within the human gut. Applied and Environmental Microbiology. 1999;65(11):4799–4807. doi: 10.1128/aem.65.11.4799-4807.1999. [DOI] [PMC free article] [PubMed] [Google Scholar]
- 10.Yuan J, Wei H, Zeng B, Tang H, Li W, Zhang Z. Impact of neonatal antibiotic treatment on the biodiversity of the murine intestinal Lactobacillus community. Current Microbiology. 2010;60(1):6–11. doi: 10.1007/s00284-009-9492-x. [DOI] [PubMed] [Google Scholar]
- 11.Vanhoutte T, De Preter V, De Brandt E, Verbeke K, Swings J, Huys G. Molecular monitoring of the fecal microbiota of healthy human subjects during administration of lactulose and Saccharomyces boulardii. Applied and Environmental Microbiology. 2006;72(9):5990–5997. doi: 10.1128/AEM.00233-06. [DOI] [PMC free article] [PubMed] [Google Scholar]
- 12.van den Abbeele P, Grootaert C, Marzorati M, et al. Microbial community development in a dynamic gut model is reproducible, colon region specific, and selective for Bacteroidetes and Clostridium cluster IX. Applied and Environmental Microbiology. 2010;76(15):5237–5246. doi: 10.1128/AEM.00759-10. [DOI] [PMC free article] [PubMed] [Google Scholar]
- 13.Haarman M, Knol J. Quantitative real-time PCR assays to identify and quantify fecal Bifidobacterium species in infants receiving a prebiotic infant formula. Applied and Environmental Microbiology. 2005;71(5):2318–2324. doi: 10.1128/AEM.71.5.2318-2324.2005. [DOI] [PMC free article] [PubMed] [Google Scholar]
- 14.Delroisse JM, Boulvin AL, Parmentier I, Dauphin RD, Vandenbol M, Portetelle D. Quantification of Bifidobacterium spp. and Lactobacillus spp. in rat fecal samples by real-time PCR. Microbiological Research. 2008;163(6):663–670. doi: 10.1016/j.micres.2006.09.004. [DOI] [PubMed] [Google Scholar]
- 15.Dethlefsen L, Huse S, Sogin ML, Relman DA. The pervasive effects of an antibiotic on the human gut microbiota, as revealed by deep 16s rRNA sequencing. PLoS Biology. 2008;6(11, article e280) doi: 10.1371/journal.pbio.0060280. [DOI] [PMC free article] [PubMed] [Google Scholar]
- 16.Turnbaugh PJ, Hamady M, Yatsunenko T, et al. A core gut microbiome in obese and lean twins. Nature. 2009;457(7228):480–484. doi: 10.1038/nature07540. [DOI] [PMC free article] [PubMed] [Google Scholar]
- 17.Rajilić-Stojanović M, Heilig HGHJ, Molenaar D, et al. Development and application of the human intestinal tract chip, a phylogenetic microarray: analysis of universally conserved phylotypes in the abundant microbiota of young and elderly adults. Environmental Microbiology. 2009;11(7):1736–1751. doi: 10.1111/j.1462-2920.2009.01900.x. [DOI] [PMC free article] [PubMed] [Google Scholar]
- 18.Gibson GR, Wang X. Enrichment of bifidobacteria from human gut contents by oligofructose using continuous culture. FEMS Microbiology Letters. 1994;118(1-2):121–128. doi: 10.1111/j.1574-6968.1994.tb06813.x. [DOI] [PubMed] [Google Scholar]
- 19.Macfarlane GT, Macfarlane S, Gibson GR. Validation of a three-stage compound continuous culture system for investigating the effect of retention time on the ecology and metabolism of bacteria in the human colon. Microbial Ecology. 1998;35(2):180–187. doi: 10.1007/s002489900072. [DOI] [PubMed] [Google Scholar]
- 20.Harrelson WG, Mason RP. Microsomal reduction of gentian violet. Evidence for cytochrome P-450-catalyzed free radical formation. Molecular Pharmacology. 1982;22(2):239–242. [PubMed] [Google Scholar]
- 21.McDonald JJ, Cerniglia CE. Biotransformation of gentian violet to leucogentian violet by human, rat, and chicken intestinal microflora. Drug Metabolism and Disposition. 1984;12(3):330–336. [PubMed] [Google Scholar]
- 22.Ben Omar N, Ampe F. Microbial community dynamics during production of the Mexican fermented maize dough pozol. Applied and Environmental Microbiology. 2000;66(9):3664–3673. doi: 10.1128/aem.66.9.3664-3673.2000. [DOI] [PMC free article] [PubMed] [Google Scholar]
- 23.Lopez I, Ruiz-Larrea F, Cocolin L, et al. Design and evaluation of PCR primers for analysis of bacterial populations in wine by denaturing gradient gel electrophoresis. Applied and Environmental Microbiology. 2003;69(11):6801–6807. doi: 10.1128/AEM.69.11.6801-6807.2003. [DOI] [PMC free article] [PubMed] [Google Scholar]
- 24.Chun J, Lee J-H, Jung Y, et al. EzTaxon: a web-based tool for the identification of prokaryotes based on 16S ribosomal RNA gene sequences. International Journal of Systematic and Evolutionary Microbiology. 2007;57(10):2259–2261. doi: 10.1099/ijs.0.64915-0. [DOI] [PubMed] [Google Scholar]
- 25.Fromin N, Hamelin J, Tarnawski S, et al. Statistical analysis of denaturing gel electrophoresis (DGE) fingerprinting patterns. Environmental Microbiology. 2002;4(11):634–643. doi: 10.1046/j.1462-2920.2002.00358.x. [DOI] [PubMed] [Google Scholar]
- 26.Takai K, Horikoshi K. Rapid detection and quantification of members of the archaeal community by quantitative PCR using fluorogenic probes. Applied and Environmental Microbiology. 2000;66(11):5066–5072. doi: 10.1128/aem.66.11.5066-5072.2000. [DOI] [PMC free article] [PubMed] [Google Scholar]
- 27.Rölleke S, Gurtner C, Drewello U, Drewello R, Lubitz W, Weissmann R. Analysis of bacterial communities on historical glass by denaturing gradient gel electrophoresis of PCR-amplified gene fragments coding for 16S rRNA. Journal of Microbiological Methods. 1999;36(1-2):107–114. doi: 10.1016/s0167-7012(99)00015-9. [DOI] [PubMed] [Google Scholar]
- 28.Mühling M, Woolven-Allen J, Murrell JC, Joint I. Improved group-specific PCR primers for denaturing gradient gel electrophoresis analysis of the genetic diversity of complex microbial communities. ISME Journal. 2008;2(4):379–392. doi: 10.1038/ismej.2007.97. [DOI] [PubMed] [Google Scholar]
- 29.Chun J, Kim KY, Lee J-H, Choi Y. The analysis of oral microbial communities of wild-type and toll-like receptor 2-deficient mice using a 454 GS FLX titanium pyrosequencer. BMC Microbiology. 2010;10:p. 101. doi: 10.1186/1471-2180-10-101. [DOI] [PMC free article] [PubMed] [Google Scholar]
- 30.Huse SM, Huber JA, Morrison HG, Sogin ML, Welch DM. Accuracy and quality of massively parallel DNA pyrosequencing. Genome Biology. 2007;8(7, article R143) doi: 10.1186/gb-2007-8-7-r143. [DOI] [PMC free article] [PubMed] [Google Scholar]
- 31.Schloss PD, Westcott SL, Ryabin T, et al. Introducing mothur: open-source, platform-independent, community-supported software for describing and comparing microbial communities. Applied and Environmental Microbiology. 2009;75(23):7537–7541. doi: 10.1128/AEM.01541-09. [DOI] [PMC free article] [PubMed] [Google Scholar]
- 32.Cummings JH. Fermentation in the human large intestine: evidence and implications for health. The Lancet. 1983;1(8335):1206–1209. doi: 10.1016/s0140-6736(83)92478-9. [DOI] [PubMed] [Google Scholar]
- 33.Wilson M. Microbial Inhabitants of Humans: Their Ecology and Role in Health and Disease. Cambridge, UK: Cambridge University Press; 2005. [Google Scholar]
- 34.Mahowald MA, Rey FE, Seedorf H, et al. Characterizing a model human gut microbiota composed of members of its two dominant bacterial phyla. Proceedings of the National Academy of Sciences of the United States of America. 2009;106(14):5859–5864. doi: 10.1073/pnas.0901529106. [DOI] [PMC free article] [PubMed] [Google Scholar]
- 35.Suchodolski JS, Camacho J, Steiner JM. Analysis of bacterial diversity in the canine duodenum, jejunum, ileum, and colon by comparative 16S rRNA gene analysis. FEMS Microbiology Ecology. 2008;66(3):567–578. doi: 10.1111/j.1574-6941.2008.00521.x. [DOI] [PubMed] [Google Scholar]
- 36.Gao X, Pujos-Guillot E, Martin JF, et al. Metabolite analysis of human fecal water by gas chromatography/mass spectrometry with ethyl chloroformate derivatization. Analytical Biochemistry. 2009;393(2):163–175. doi: 10.1016/j.ab.2009.06.036. [DOI] [PubMed] [Google Scholar]
- 37.Matsumoto M, Tani H, Ono H, Ohishi H, Benno Y. Adhesive property of Bifidobacterium lactis LKM512 and predominant bacteria of intestinal microflora to human intestinal mucin. Current Microbiology. 2002;44(3):212–215. doi: 10.1007/s00284-001-0087-4. [DOI] [PubMed] [Google Scholar]
- 38.Walker AW, Duncan SH, Harmsen HJM, Holtrop G, Welling GW, Flint HJ. The species composition of the human intestinal microbiota differs between particle-associated and liquid phase communities. Environmental Microbiology. 2008;10(12):3275–3283. doi: 10.1111/j.1462-2920.2008.01717.x. [DOI] [PubMed] [Google Scholar]
Associated Data
This section collects any data citations, data availability statements, or supplementary materials included in this article.
Supplementary Materials
Figure S1. The growth of intestinal microbiota was analyzed on different media with 1% fecal inoculum. (a) Growth curves were constructed by OD600, and (b) 16S rRNA gene copies of total bacteria were quantified by real-time PCR. Growth of intestinal microbiota in low carbohydrate medium (green), high carbohydrate medium (red), and BHI (blue).
Figure S2. Decolorization of gentian violet by fecal bacterial culture after 18 hours. Fecal inocula from three individuals were incubated with 6.5 µM gentian violet for 18 hours. Gentian violet is reductively decolorized and decolorization indicates the metabolic activity of cultured bacteria. The control sample (C) incubated gentian violet to LCM for 18 hours without fecal inoculum. The fecal inoculum from individual A (2) incubated for 18 hours with gentian violet, individual B (3) incubated with gentian violet, and individual C (5) incubated with gentian violet.
Figure S3. The DGGE profiles of each concentration inoculum (0.1, 0.5, 1, 2, 3%) from individual D at different time point were generated from amplified V3 16S rRNA gene of genomic DNA. M denotes marker lanes, F denotes original fecal microbiota, and each number above lane is culture time (hour).
Figure S4. The growth of different fecal inoculum concentration from individual D was analyzed with spectrophotometer and quantitative real-time PCR. (a) Growth curves were constructed by ∆OD600, and (b) total bacterial 16S rRNA gene copies were compared.
Figure S5. The rarefaction curves for three individual samples of 0 hour and 18 hour. The numbers of observed phylotypes (OTUs) from samples were calculated by 97% similarity.