Abstract
During the last few decades, liposome encapsulated hemoglobin (LEH) dispersions have been investigated for use as red blood cell (RBC) substitutes. However, the process for formulating LEHs is cumbersome and the composition of the lipid mixture is often complex. This work investigates a simple approach for formulating LEHs from a simple lipid mixture composed of the high phase transition lipid distearoylphosphatidylcholine (DSPC) and cholesterol. In order to improve the circulation half-life and colloidal state of LEHs, the surface of unmodified LEHs was conjugated with poly(ethylene glycol) (PEG-LEHs). The results of this work show that PEG-LEH dispersions exhibited average diameters ranging from 166–195 nm that were colloidally stable for 4–5 months, hemoglobin (Hb) concentrations ranging from 9.6–14 g/dL, methemoglobin levels less than 1%, oxygen affinities (i.e. P50s) ranging from 20–23 mm Hg and cooperativity coefficients ranging from 1.4–2.2.
The reactions of PEG-LEHs with physiologically important ligands, such as oxygen (O2), carbon monoxide (CO) and nitric oxide (NO), were also measured. It was observed that PEG-LEHs and RBCs exhibited retarded gaseous ligand binding/release kinetics compared to acellular Hbs. This result provides important insight into the pivotal role that the intracellular diffusion barrier plays in the transport of gases into and out of these structures. Collectively, our results demonstrate that the PEG-LEH dispersions prepared in this study show good potential as a RBC substitute.
INTRODUCTION
Seasonal blood shortages, the short storage shelf-life (42 days) of red blood cells (RBCs), the risk of contracting yet to be identified pathogens in blood, and the acute need for blood in scenarios such as natural disasters, wars and terrorist attacks, have all contributed to the need for the development of artificial oxygen (O2) carrying solutions.1,2 During the last few decades, liposome encapsulated hemoglobins (LEHs) have emerged as one of the predominant types of cellular hemoglobin (Hb)-based O2 carriers (HBOCs) to be investigated for use as a RBC substitute.3–12 Unfortunately, the circulation half-life of unmodified LEHs is short (~4–12 hours in rabbits and mice)12, 13 and they tend to aggregate and fuse together after several days of storage 14. To improve the intravascular circulation and colloidal state of LEHs, the surface of unmodified LEH particles been conjugated with poly(ethylene glycol) (PEG).14–16 PEG is a hydrophilic and bioinert polymer, which has been extensively used in drug delivery systems and is declared to be safe for use in humans by the United States Food and Drug Administration.
In formulating PEG-LEHs for use in transfusion medicine, it is desirable to encapsulate a large amount of Hb using a minimal amount of lipid. Depending on the composition of the lipid mixture, various techniques such as membrane extrusion, detergent dialysis, reverse phase evaporation, freeze thawing, and microfluidization have all been used to decrease the number of bilayers (lamellarity) and size of PEG-LEH particles in order to encapsulate more Hb inside the liposome aqueous core.17–21 However, most of the techniques used to formulate PEG-LEHs are complex. The detergent dialysis and reverse phase evaporation methods are undesirable in formulating LEHs, since they involve the use of detergents and organic solvents, which can potentially denature or chemically modify the encapsulated Hb. Similarly, membrane extrusion cannot be employed for efficient scale up production of PEG-LEHs since it has several drawbacks, such as the slow permeation rate of the lipid-Hb mixture through the membrane and the potential for rapid clogging of pores in the membrane during the extrusion process.12, 22 Microfluidization is thus an attractive approach towards efficient scale-up production of PEG-LEHs considering that large amounts of liposomes can be formed in a continuous manner without the use of detergents or organic solvents.23 However, regardless of the technique used to formulate PEG-LEHs, the formulation process involves multiple steps (Figure 1). In this study, a simple approach will be used to formulate PEG-LEH dispersions (Figure 1). In addition, it is desirable that the PEG-LEH membrane consist of a simple mixture of lipids. The major lipid constituent of the PEG-LEH membrane is usually based on a combination of saturated phospholipids and cholesterol. The amount of cholesterol incorporated in the membrane of PEG-LEH particles ranges from approximately 40–50% of the total molar lipid concentration.3, 4, 16 Cholesterol has the ability to intercalate between the phospholipid molecules in the lipid membrane, thereby making it more rigid.24 Because of this biophysical property, PEG-LEHs are highly resistant to hypotonic shock, freezing by liquid N2, enzymatic attack, oxidative damage, and shear stress as compared to RBCs.14, 25 Anionic lipids, such as dimyristoyl- and dipalmitoyl-phosphatidylglycerol have also been traditionally incorporated in the lipid membrane of PEG-LEHs.26 These lipids are used to increase the level of Hb encapsulation inside the liposomes.18 However, anionic liposomes exhibit short circulatory half-lives, elicit vasoconstriction (i.e. decrease blood vessel diameter) and hypertension (increase mean arterial blood pressure), as well as result in a decrease in the number of circulatory platelets.26, 27 In several studies,8, 10, 17, 28, 29 amino acid-based synthetic anionic lipids have been incorporated into the PEG-LEH membrane. However, it is unclear how these amino acid based lipids are metabolized in vivo. To further complicate matters, the lipid membrane of PEG-LEHs is also traditionally composed of α-tocopherol in order to reduce the oxidation of the lipid components of the membrane.30 However, lipid oxidation is a major issue if the phospholipid used to formulate the membrane is unsaturated. Therefore, in light of the complex nature of the traditional composition of the lipid membrane, the lipid formulation used in this current study will consist of a simple mixture of saturated phospholipid and cholesterol. This should reduce the overall cost of producing this class of material.
Figure 1.
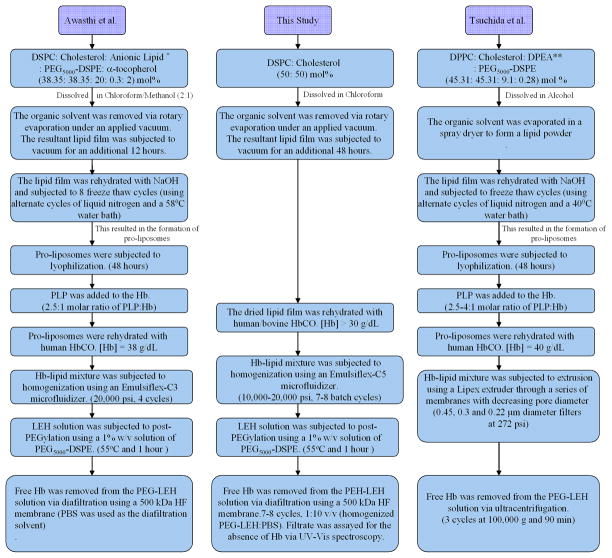
Comparison of the PEG-LEH preparation method used in this study with those of Awasthi et al.18 and Tsuchida et al.17
* 2- carboxyheptadecanoyl heptadecylamide, an anionic non phospholipid. ** 1,5-dipalmitoyl-L-glutamate-N-succinic acid (DPEA), an amino acid based phospholipid.
Interestingly, PEG-LEHs have been shown to be devoid of vasoactivity, which is a common side-effect shared by most acellular Hbs.29 The absence of vasoactivity in PEG-LEHs is attributed not only to their reduced rate of NO dioxygenation, but also to their moderate rate of O2 release that is closer to that of RBCs.29 This study will confirm that the intracellular diffusion barrier due to the concentration of encapsulated Hb and the size of the PEG-LEH particle retards gaseous ligand binding/release kinetics.
In summary, this study aims to improve and further develop PEG-LEHs as an artificial O2 carrier for use in transfusion medicine. More specifically, this study describes a simple approach to prepare PEG-LEHs encapsulating either human or bovine Hb and characterizes the biophysical properties of these dispersions.
MATERIALS AND METHODS
Materials
Hollow fiber (HF) filter modules (part number: M1-500S-360-01S, rated pore size: 500 kDa and surface area: 1050 cm2) were purchased from Spectrum Laboratories (Rancho Dominguez, CA). Cholesterol was purchased from Sigma-Aldrich (St. Louis, MO). Poly(ethyleneglycol)5000 distearoylphosphatidylethanolamine (PEG5000-DSPE) and Distearoylphosphatidylcholine (DSPC) were obtained from Avanti Polar Lipids (Alabaster, AL). All other chemicals were purchased from Sigma-Aldrich (St. Louis, MO).
Source of RBCs
Fresh bovine RBCs were purchased from QUAD 5 (Ryegate, MT), whereas fresh human RBCs were obtained from Group Services for America’s Blood Centers (GSABC, Washington, D.C.).
Extraction and Purification of Bovine Hb and Human Hb from RBCs
Bovine and human Hb were purified from RBCs via the method of Palmer et al. using tangential flow filtration (TFF).31
PEG-LEH Preparation
3.6 grams of DSPC and 1.4 grams of cholesterol (1:1 molar ratio) were completely dissolved in 30–40 mL of chloroform. The organic solution was then removed to form a dry lipid film using a rotary evaporator. The lipid film was further dried under vacuum for 48 hrs and then hydrated with 100 mL of carbonyl Hb (HbCO) ([Hb] > 300 mg/mL) suspended in phosphate-buffered saline (PBS) (0.1 M, pH 7.4) inside a round bottom flask. The contents of the flask were thoroughly mixed at room temperature for 12–14 hours under a blanket of CO gas to form a homogeneous suspension. The lipid/Hb solution was then passed through an EmulsiFlex-C5 homogenizer (Avestin Inc, Ontario, Canada) 7–8 times in batch mode. The homogenizing pressure was adjusted in the range of 10,000–15,000 psi. After the completion of each homogenization cycle, the LEH dispersion size distribution was measured using dynamic light scattering (DLS). The homogenization process was terminated once the LEHs reached a desired size < 200 nm. For PEGylation, PEG5000-DSPC (1% w/v) dispersed in 0.1 M PBS, pH 7.4 was added to the homogenized LEH/Hb solution (1 mL to every 2 mL of LEH/Hb solution, respectively) to maintain the PEG-lipid below its critical micelle concentration. The solution was then gently stirred at 55–58°C for a period of one hour under a CO saturated atmosphere, in order to allow for the successful incorporation of PEG-lipid into the outer leaflet of the LEH particles. Unencapsulated Hb was removed from PEG-LEH particles at room temperature via diafiltration using a 500 kDa HF cartridge (Spectrum Laboratories, Rancho Dominguez, CA), using PBS as the diafiltration buffer. To ensure complete removal of free Hb from the PEG-LEH solution, the process was repeated 7–8 times using a 1:10 v/v (homogenized PEG-LEH:PBS) ratio until no free Hb was observed in the filtrate. The filtrate was assayed for the presence of Hb using UV-Vis spectroscopy and the Winterbourn equation.32 Finally, the PEG-LEH solution was concentrated using a 500 kDa HF cartridge until the Hb concentration of the PEG-LEH solution was greater than 10 g/dL. Strict aseptic conditions were maintained throughout the preparation of PEG-LEHs. Prior to all experiments, all tubings, filters and glassware used for the preparation of PEG-LEHs were immersed in 1 M NaOH solution overnight and rinsed with deionized water. The diafiltration and concentration of PEG-LEHs was performed inside a laminar flow hood.
Hb and Methemoglobin Concentration in PEG-LEH Dispersions
The concentration of Hb and methemoglobin (metHb) in PEG-LEH dispersions were assayed after PEG-LEH lysis using a 10% v/v Triton X-100 solution. Briefly, the PEG-LEH solution was diluted with PBS in a 1:9 v/v ratio. The solution was then heated to 5–10°C above the phase transition temperature of DSPC (55° C), for 15–20 min. Then a 10% v/v solution of Triton X-100 solution was added to the heated PEG-LEH solution and thoroughly mixed for 1 minute. The solution was then centrifuged at 14,000 rpm for 2–3 minutes. Finally, the supernatant was collected and the concentration of total released Hb and metHb were assayed via UV-Vis spectroscopy using the Winterbourn equation.32
O2-PEG-LEH Equilibria
CO bound to Hb was photodissociated via irradiation of the PEG-LEH solution with visible light under an O2 saturated atmosphere at 4°C. This process converts HbCO to HbO2. The conversion was confirmed by measuring the absorption spectra of lysed Hb from the PEG-LEH dispersion using UV-Vis spectroscopy and the Winterbourn equation 32. In the case of PEG-LEHs, 2–5 mL of PEG-LEH dispersion was initially placed inside a sealed serum bottle. Then a long needle was used to degas the solution for 10 minutes. CO was photodissociated from the PEG-LEH particles via visible light irradiation under an O2 saturated atmosphere for 15–20 minutes at 4°C. The photodissociation cycle was repeated once again to make sure that all the HbCO was converted into HbO2.
O2-PEG-LEH equilibrium curves were measured using a Hemox™ Analyzer (TCS Scientific Corp., New Hope, PA, USA) at 37°C according to the literature.31
Matrix-Assisted Laser Desorption/Ionization (MALDI) Spectroscopy of PEG-LEHs
MALDI was used to measure the molecular weight of the α and β subunits of bovine and human Hb encapsulated inside PEG-LEH particles via the method of Elmer et al. in order to study the effect of encapsulation and storage time on the chemical stability of Hb.33
PEG-LEH Size Distribution
The size distribution of PEG-LEHs was measured using a Zetasizer Nano DLS spectrometer (Malvern Instruments Ltd, Worcestershire, United Kingdom) at 37°C.
Long Term Storage Stability of PEG-LEH Dispersions
PEG-LEHs were stored at 4°C for a period of 4–5 months. 0.5 mL of PEG-LEH solution was diluted 10 times with PBS and subjected to ultracentrifugation (Beckman Coulter Inc., Brea, CA) at 100,000 g for 45 min. The Hb concentration in the supernatant void of PEG-LEH particles was measured using the Winterbourn equation.32
Hematocrit of PEG-LEH Dispersions
PEG-LEHs were diluted with PBS and subjected to ultracentrifugation (Beckman Coulter Inc., Brea, CA) at 100,000 g for 45 min. The hematocrit or fraction of packed PEG-LEH was calculated using the following equation:
V1 = Initial volume of the PEG-LEH solution.
V2 = Final volume of the supernatant after ultracentrifugation.
D = Dilution factor.
Rapid Kinetic Measurements of PEG-LEH Dispersions
All rapid kinetic measurements were performed using an Applied Photophysics SF-17 microvolume stopped-flow spectrophotometer (Applied Photophysics Ltd., Surrey, United Kingdom). The measurements were performed on PEG-LEH dispersions converted into the HbO2 form, prior to all experiments, using the aforementioned method described in the O2-PEG-LEH Equilibria section of the Methods section.
O2 dissociation rate constants (koff, O2), were measured by rapidly mixing oxygenated Hbs (15 μM heme) with 1.5 mg/mL of sodium dithionite (Sigma-Aldrich, St. Louis, MO). The deoxygenation reaction for oxygenated Hbs and oxygenated PEG-LEHs was monitored at 437.5 nm in 0.1 M Tris buffer, pH 7.4, at 25°C. For measurements on oxygenated RBCs, 0.1 M PBS, pH 7.4 was used instead of 0.1 M Tris buffer in order to prevent RBC lysis.
The reaction rate constants of CO association with deoxygenated Hb (kon, CO), were monitored at 437.5 nm and 25°C by rapidly mixing deoxygenated Hbs (15 μM) with saturated CO solution. Both deoxygenated Hb and CO solutions are prepared in the presence of 1.5 mg/mL sodium dithionite. For reactions with Hbs and PEG-LEHs, 50 mM Tris buffer, pH 7.4 was used as the buffer. However, 0.1 M PBS, pH 7.4 was used as the reaction buffer in the case of RBCs.
The NO dioxygenation or NO-induced oxidation of oxygenated Hb reaction was monitored by absorbance changes at 420 nm and 25°C. The reaction converts ferrous oxyHb to ferric Hb. The bimolecular rate constant for this reaction (kox, NO) is extremely high (107 M−1 s−1). In order to minimize the loss of the reaction in the dead time of the instrument (2–3 ms), concentrations of NO after mixing were kept low (25 μM). At this concentration, the rate of the autoxidation reaction of NO with dissolved O2 is negligible compared with the rate of reaction with ferrous Hb. NO stock solutions (~ 2 mM) were prepared by bubbling NO gas through a deoxygenated solution of 1 M NaOH before saturating deoxygenated 50 mM Tris buffer, pH 7.4, in a gas collection bottle at room temperature. For reactions with Hbs and PEG-LEHs, appropriate dilutions from a stock NO solution were made with deoxygenated 50 mM Tris buffer, pH 7.4, using a gas tight syringe. In the case of RBCs, the dilutions were made in 0.1 M PBS, pH 7.4. The solutions were transferred as quickly as possible into the stopped flow syringes in order to avoid any dissipation of NO into the atmosphere. The Hb concentration in NO experiments was kept low (0.5 μM), in order to apply the pseudo-first order approximation.
Statistical Analysis
For comparisons of various results between Hbs, PEG-LEHs and RBCs, a Student’s paired t-test was performed. In all analyses, p < 0.05 was taken as the level of statistical significance. Statistical analyses were performed using Microsoft Office Excel 2007 software.
RESULTS AND DISCUSSION
PEG-LEH Preparation
Using the method outlined in this article, PEG-LEH dispersions with no free tetrameric Hb were successfully prepared with reproducible biochemical and biophysical properties. HbCO was used for the preparation of PEG-LEHs, since HbCO is highly resistant to oxidation versus HbO2. As compared to previously published methods that describe the preparation of PEG-LEH dispersions,3–5, 7–10, 25, 29, 34, 35 the method outlined in this article involves fewer preparation steps. Figure 1 compares the PEG-LEH preparation method used in this current study to those developed by Awasthi et al.18 and Tsuchida et al.17
One important difference between this study and recent studies that describe PEG-LEH preparation is the fact that the Hb used in this study was not heat pasteurized. Conversely, Tsuchida and coworkers have reported the formulation of PEG-LEH dispersions using HbCO pasteurized at 60° C for 10 hours. In another departure from the method described in this article, Awasthi and coworkers18 reported the use of dichloromethane during the purification of Hb. However, no assays were performed to assess for any possible protein denaturation or structural modification to the Hb molecule, even though the authors reported complete removal of the organic solvent. In contrast, the Hbs used in this study were not pasteurized or subjected to processing with organic solvents.31
Another major difference between the PEG-LEH preparation method described in this current study and methods found in the literature concerns the type of lipid used to form the LEH membrane. The most common lipid used to partially form the membrane of PEG-LEHs consists of dipalmitoylphosphatidylcholine (DPPC). Unfortunately, DPPC has a phase transition temperature of 41°C,8–10, 14–18, 25, 28, 29, 34–39 which is close to the core body temperature (37°C). Therefore, transfusion of DPPC containing PEG-LEHs will result in increased PEG-LEH membrane fluidity, which will eventually lead to liposomal membrane destabilization and subsequent release of free Hb into the blood stream. However, it is well known that free Hb induces vasoconstriction, which elicits systemic hypertension, reduced blood flow and vascular damage upon scavenging of endothelium derived NO and extravasation into the tissue space.40 In addition, most of these previous studies8–10, 17, 29 use 1,5-dipalmitoyl-L-glutamate-N-succinic acid, an amino acid-based phospholipid, in their lipid formulation in order to increase the Hb encapsulation efficiency. However, it is unclear how this lipid will be metabolized in vivo. In a recent study, Awasthi et al.18 reported on the synthesis of a new amphiphilic molecule composed of 2-carboxyheptadecanoyl heptadecylamide for use in PEG-LEH membranes. Again, the metabolism of this amphiphile is yet to be determined in vivo. To counter these issues, a simple higher phase transition temperature (55°C) lipid, DSPC, was used to formulate the lipid membrane of PEG-LEHs in this current study. DSPC is a neutral phospholipid. Therefore, incorporation of a neutral lipid instead of a charged one in the lipid formulation should negate vasoconstriction, hypertension and any decrease in circulatory platelets26, 27 observed during transfusion of charged PEG-LEHs.
In the literature, the formulation of PEG-LEH is preceded by freeze drying the lipid mixture followed by the formation of pro-liposomes.18 However in this study, an optimized high shear homogenization process (10,000–15,000 psi, 7–8 batch cycles), which does not require freeze drying of lipids or the formation of pro-liposomes, was used to generate LEHs. Although, the use of DSPC in lipid formulations and homogenization for liposome size reduction has been reported in the literature,5, 41 the method of lipid preparation in these studies differs significantly from this current study. For example, lyophilization was used in previous studies in order to remove water from the hydrated lipid mixture and form a dry lipid powder. However, lyophilization is energy intensive and cannot be employed with aqueous mixtures containing organic solvents. This increases the difficulty of the lipid film preparation step.42 Moreover, PEG-conjugated lipid is added to the lipid formulation during the formation of the dried lipid film.8–10, 17, 29,18 The addition of expensive PEG-lipid during the initial stages of the PEG-LEH preparation process, results in its incorporation into the inner and outer layers of the LEH particle.4 As a result, this method requires use of more PEG-lipid than is necessary for camouflaging the LEH particle from being recognized by the reticuloendothelial system. This in turn increases the cost of producing PEG-LEHs. In this current study, PEG-lipid is postinserted only in the outer layer of the LEH particle, after LEH preparation. Therefore, a minimal amount of expensive PEG-lipid is used in the formulation process, hence, reducing the overall cost of producing PEG-LEHs.
In order to remove unencapsulated Hb and concentrate PEG-LEH particles, ultracentrifugation is the most widely employed technique used in the literature.8–10, 14–18, 25, 28, 29, 34–39 Scale up of this process is challenging, as it requires large ultracentrifuges capable of attaining high speeds (100,000–200,000 g). In this work, TFF using HF cartridges of a defined molecular weight cut off (500 kDa) were used to completely remove all unencapsulated Hb and concentrate the final PEG-LEH dispersion. This process can be scaled up by simply increasing the surface area of the HFs used in the cartridges. Awasthi et al.5 have also reported use of a similar HF cartridge to remove unencapsulated Hb in their PEG-LEH dispersions. However, in that study, no details were reported on the total dilution volume used, number of diafiltration cycles applied and above all, no experiments were carried out to confirm complete removal of free Hb from the PEG-LEH dispersions. In this work, we demonstrated the formation of PEG-LEH dispersions composed of DSPC and cholesterol with no free Hb in solution.
Hb Concentration and MetHb Level in PEG-LEH Dispersions
The concentration of Hb in PEG-LEH dispersions is shown in Figure 2. The Hb concentration ranged from 9.6–14 g/dL for PEG-LEHs encapsulating bovine Hb and 11–13 g/dL for PEG-LEHs encapsulating human Hb. In this work, the objective of the study was to prepare PEG-LEHs with Hb concentrations similar to that of whole blood (15 g/dL), in order for these solutions to be used as efficacious HBOCs. However, some in vivo studies4, 5, 7, 41 have been performed using PEG-LEHs with low Hb concentrations (< 4 g/dL). Therefore, this current study represents the first attempt to attain high Hb concentrations in PEG-LEH dispersions using lipid membranes composed of DSPC. Tsuchida and coworkers8–10, 25, 34, 35 have reported similar Hb concentrations in their PEG-LEH dispersions; however their lipid formulation was more complex and partially composed of DPPC.
Figure 2.
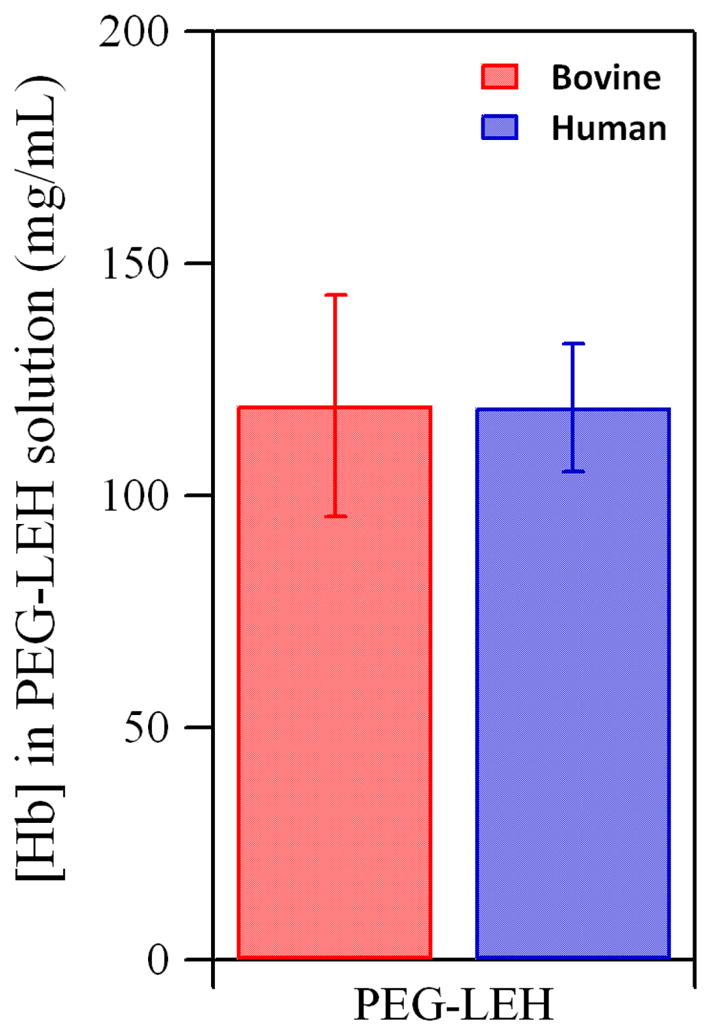
Hb concentration in PEG-LEH dispersions encapsulating bovine and human Hb. Experiments were done in triplicate. The error bars represent the standard deviation.
Figure 3 shows the metHb level of PEG-LEH dispersions prepared in this study. The metHb level of all PEG-LEH preparations was less than 1% as compared to ~ 0.5% for purified Hb. This shows that metHb level of Hb did not increase significantly during the preparation of PEG-LEH dispersions. Moreover, no reducing agents were used in this study to suppress Hb oxidation, unlike some studies on PEG-LEHs reported in the literature.5, 14 Even after the addition of reducing agents, the metHb levels reported in one study5 was as high as 10%. This high metHb level suggests that either the Hb purification method or preparation of PEG-LEHs in that study enhanced the metHb level of the PEG-LEH dispersions. The oxidized form of Hb (metHb) is unable to deliver O2 to tissues.43 For metHb levels greater than 10%, there is a significant decrease in Hb’s ability to oxygenate tissues in vivo.43
Figure 3.
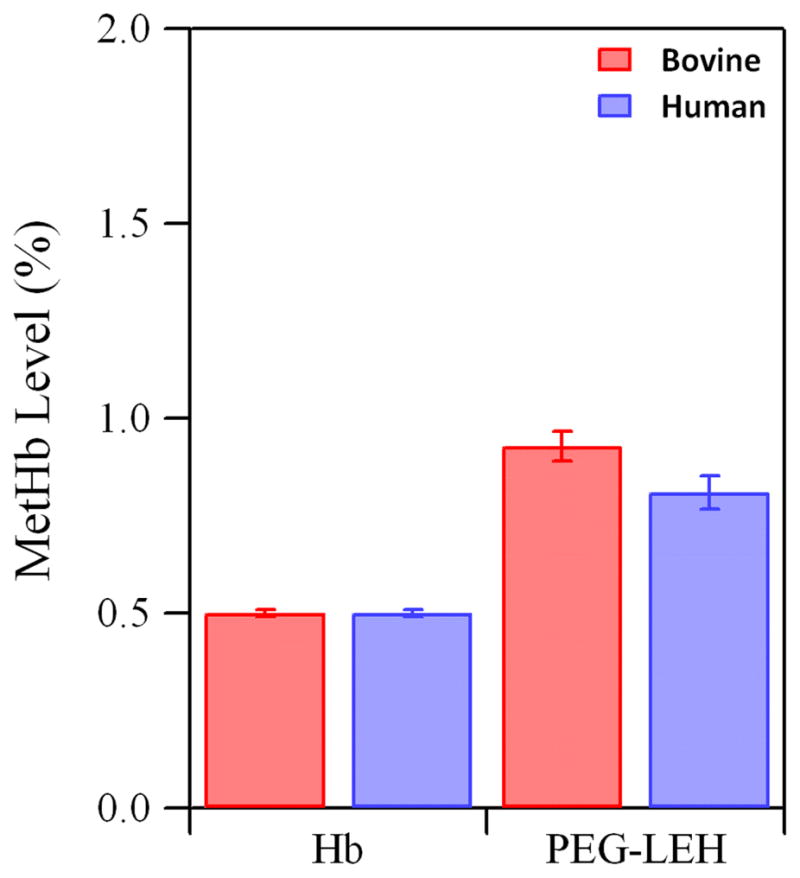
MetHb level of Hb and PEG-LEHs encapsulating bovine and human Hb. Experiments were done in triplicate. The error bars represent the standard deviation.
O2-PEG-LEH Equilibria
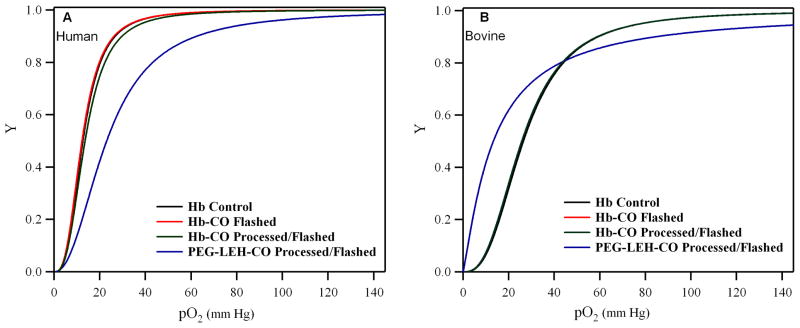
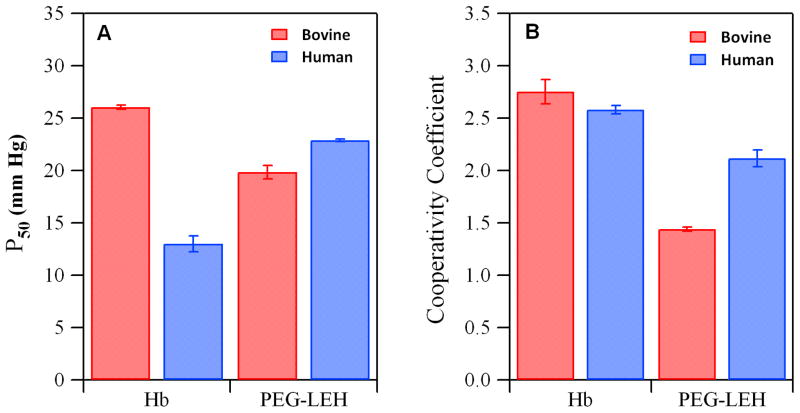
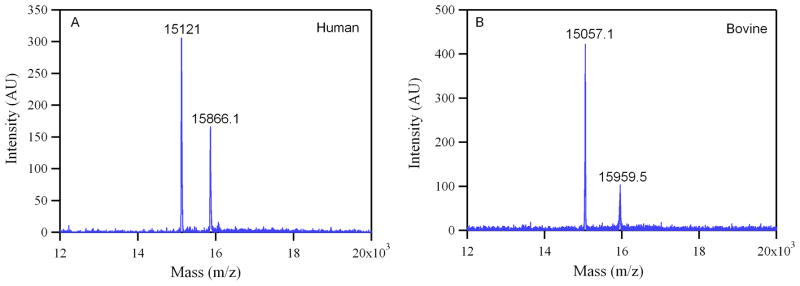
Equilibrium O2 binding curves of PEG-LEH dispersions are shown in Figure 4. As a control, the HbCO solution was processed by itself under the same conditions used for preparing PEG-LEHs. The sigmoidal shape of the equilibrium O2 binding curves exhibited by the flashed HbCO solutions qualitatively shows that the cooperativity of O2 binding to Hb was not compromised by the preparation method used in this study. The P50 and n of PEG-LEH dispersions are shown in Figure 5. The P50 for PEG-LEHs encapsulating human Hb was in the range of 20–23 mm Hg, significantly higher (p < 0.05) than that of human Hb (P50 ≈ 14 mm Hg).31 On the other hand, the P50 for PEG- LEHs encapsulating bovine Hb was in the range of 19–21 mm Hg, significantly lower (p < 0.05) than that of bovine Hb (P50 ≈ 26.03 mm Hg).31 The cooperativity coefficient for PEG-LEHs encapsulating human Hb was in the range of 2–2.2 slightly lower than that of human Hb (n ≈ 2.5). However, the cooperativity coefficient for PEG- LEHs encapsulating bovine Hb was in the range of 1.43–1.46 much lower than that of bovine Hb (n ≈ 2.7). The changes in the P50 and n values of PEG-LEHs as compared to unencapsulated Hbs could be attributed to encapsulation of Hb inside the aqueous core of liposomes, considering the fact that the processing of Hb (under similar conditions used for PEG-LEH preparation) did not affect the P50 or n values of native unencapsulated Hb. In light of this observation, chemical modification of Hb inside the PEH-LEH particle cannot be ruled out. To investigate if encapsulated Hb inside PEG-LEHs was chemically modified, MALDI was performed on PEG-LEHs. Figure 6 shows MALDI spectral analysis of PEG-LEHs encapsulating bovine and human Hb. The observed molecular weights of the α and β subunits of human Hb encapsulated inside PEG-LEHs (α = 15,121 g/mol and β = 15,866.1 g/mol) are similar to the theoretical molecular weights of the subunits (α = 15,126.4 g/mol and β = 15,867.2 g/mol). Similarly, the observed molecular weights of the α and β subunits of bovine Hb encapsulated inside PEG-LEHs (α = 15,057.1 g/mol and β = 15,959.5), correlate well with the theoretical molecular weights of the subunits (α = 15053.2 g/mol and β = 15954.4 g/mol). Therefore, this result demonstrates that there is no chemical modification of the Hb during the formation of PEG-LEH dispersions. We suspect that the decrease in the cooperativity coefficient of PEG-LEHs compared to free Hb is due to the high intracellular concentration of Hb inside PEG-LEHs, which promotes crowding of the encapsulated Hb molecules and therefore reduces transmission of quaternary structural changes between neighboring globin chains. A similar decrease in the cooperativity coefficient is also observed with RBCs, where the intracellular Hb concentration is approximately 30 g/dL 24 compared to 50–75 g/dL inside the PEG-LEHs prepared in this study. Therefore if this hypothesis is true, the cooperativity coefficient of PEG-LEHs should be lower than that of RBCs. This is exactly the response we observe in this study, since the intracellular Hb concentration is higher in PEG-LEHs versus RBCs.
Figure 4.
O2 equilibrium curves of PEG-LEH dispersions and Hbs: (A) represents human Hb and (B) represents bovine Hb. Here, Y is the fraction of Hb saturated with O2 and pO2 is the partial pressure of O2.
Figure 5.
O2-Hb/PEG-LEH equilibria: (A) the O2 affinity (P50) and (B) cooperativity coefficient of Hbs and PEG-LEHs encapsulating bovine and human Hb. Experiments were done in triplicate. The error bars represent the standard deviation.
Figure 6.
MALDI scan (12–20 kDa) of (A) human and (B) bovine PEG-LEHs stored for 4–5 months at 4°C. Two peaks are observed near the theoretical molecular weights for the α (15,126.4 g/mol) and β (15,867.2 g/mol) subunits of human Hb; as well as, the α (15,053.2 g/mol) and β (15,954.4 g/mol) subunits of bovine Hb.
In most of the previous studies on PEG-LEHs described in the literature,4, 5, 8–10, 18, 25, 28, 29, 34–36, 38 allosteric effectors have been used to regulate the O2 affinity of encapsulated Hb. This strategy increases the production cost and chemically modifies the Hb. Allosteric effectors are added to purified human Hb in order to decrease the O2 affinity of human Hb. This is done, since 2,3-diphospoglycerate (2,3-DPG, a key allosteric regulator of O2 binding to human Hb) is removed during the purification of human Hb 31. Therefore, loss of 2,3-DPG results in the increased O2 affinity of purified human Hb. Hence, PEG-LEHs encapsulating human Hb4, 5, 8–10, 13–15, 25, 28, 29, 34–36, 41 have been prepared in the presence of 2,3-DPG analogues such as pyridoxal 5′-phosphate (PLP) or inositol hexaphosphate (IHP) in order to decrease the O2 affinity of human Hb. It is noteworthy that utilization of 2,3-DPG is not practical, since it is prone to hydrolysis and expensive.37 Coencapsulation of IHP (IHP:Hb molar ratio of 1.0) was shown to decrease the P50 drastically (P50 = 60–65 mm Hg), however only 70–80% of the encapsulated Hb could be oxygenated at a physiologically high oxygen partial pressure of 100 mm Hg.44 Conversely, PLP needs to be added at much higher molar ratios in order to adjust the P50 of human Hb (2.5–3:1 molar ratio of PLP to Hb).14, 18 In this current study, no allosteric effectors were added to the encapsulated human Hb. In addition, PEG-LEHs encapsulating bovine Hb do not require 2,3-DPG or its analog in order to regulate the P50. Instead, Cl− ions regulate O2 binding to bovine Hb37 and are naturally present in the PEG-LEH buffer (PBS). The use of both unmodified human and bovine Hb in PEG-LEHs enables us to regulate the O2 affinity without the addition of any allosteric effectors. In addition, the P50 of human and bovine PEG-LEH dispersions (P50 = 19–23 mm Hg) was comparable to that of human RBCs.
PEG-LEH Size Distribution/Storage Stability
The size distribution of PEG-LEH dispersions is shown in Figure 7 (0 months). The hydrodynamic diameter ranged from 166–195 nm for PEG-LEHs encapsulating bovine Hb and 163–185 nm for PEG-LEHs encapsulating human Hb. The sizes are in the ideal range (160–220 nm) required to achieve long circulatory lifetimes.3 There was no significant change (p > 0.05) in the diameter (174 ± 3.4 nm for bovine PEG-LEHs and 165 ± 1.5 nm for human PEG-LEHs) of PEG-LEHs upon storage for 4–5 months at 4°C (Figure 7). In addition, no precipitate was observed during the storage time period. The colloidal stability of PEG-LEH dispersions has been attributed to the surface modification of the LEHs with PEG, which prevents particle aggregation.14
Figure 7.
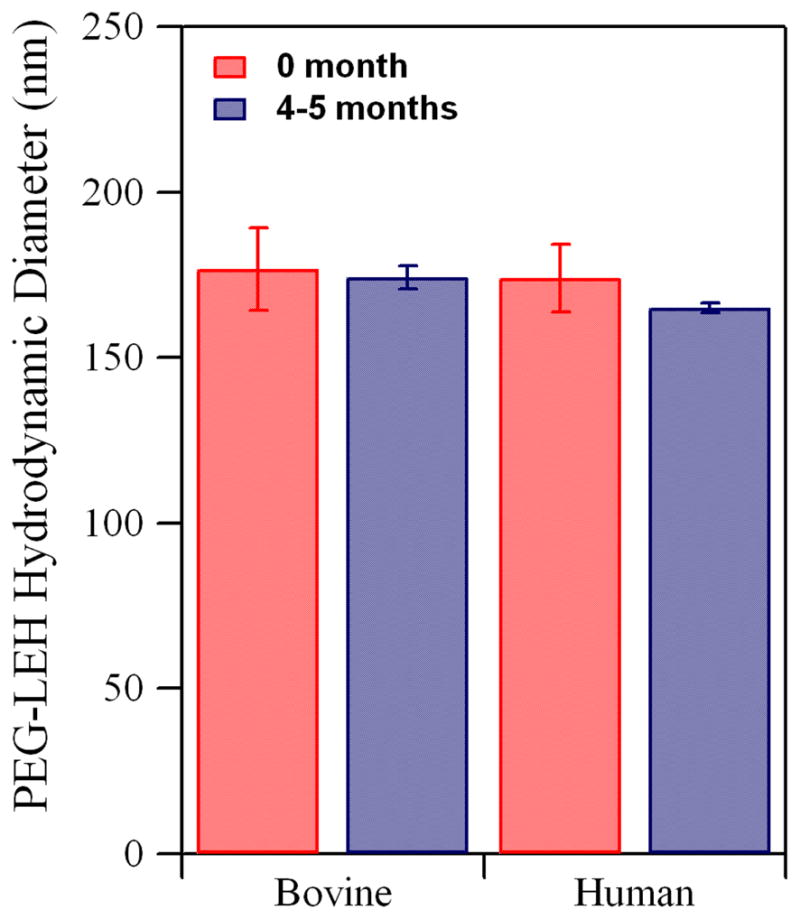
Hydrodynamic diameter of PEG-LEHs encapsulating bovine and human Hb. Experiments were done in triplicate. The error bars represent the standard deviation.
Figure 8 shows the percent leakage of total Hb from PEG-LEHs, after 0 and 4–5 months of storage at 4°C. The supernatant obtained after ultracentrifugation of freshly prepared PEG-LEHs did not show any UV-Vis absorption spectra attributed to Hb. After 4–5 months of storage at 4° C, Hb leakage corresponding to 0.84 ± 0.09% (bovine PEG-LEHs) and 0.71 ± 0.71% (human PEG-LEHs) of the total encapsulated Hb was observed. It has been shown in the literature that unmodified LEHs aggregate during a period of 3 days.14 Hence, PEG modification and storage of PEG-LEHs in the CO form used in this study, makes it possible to store these dispersions for longer periods of time. This would benefit clinical medicine by overcoming the short storage shelf-life of human RBCs.
Figure 8.
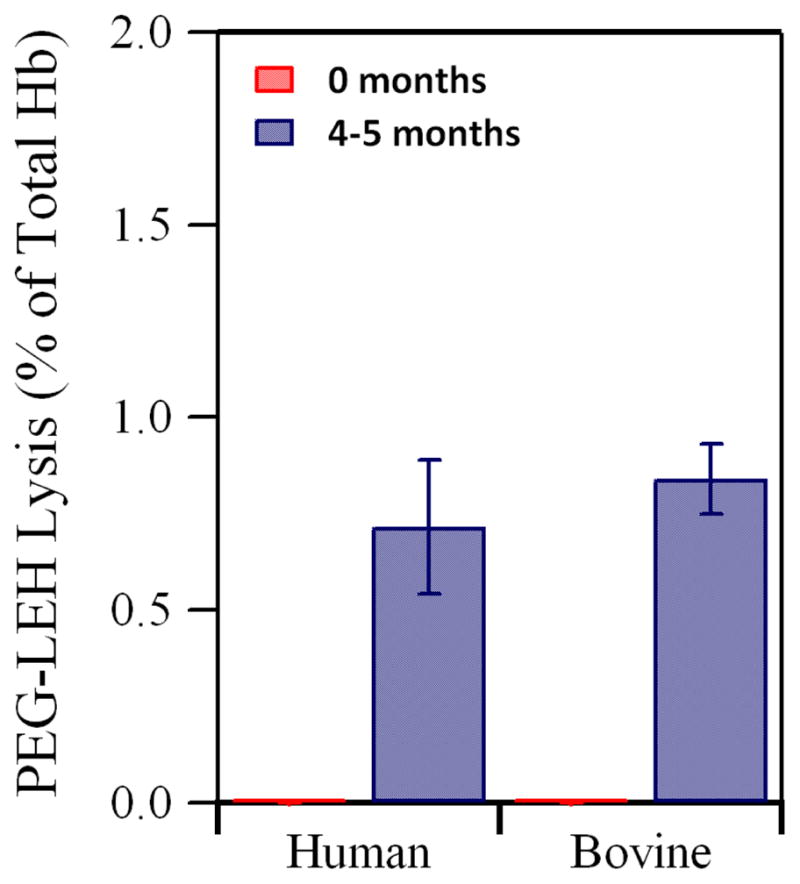
Percent leakage of total Hb from PEG-LEHs after storage for 4–5 months at 4° C. Experiments were done in duplicate. The error bars represent the standard deviation.
Rapid Kinetic Measurements of PEG-LEH Dispersions
The ligand binding/release kinetics of Hb with various ligands, especially physiologically relevant ligands (O2, CO and NO) are just as important as equilibrium studies in providing information about the ability of these materials to store and transport gases in vivo.45 Surprisingly, in the plethora of studies conducted on PEG-LEHs, only a few studies have evaluated the ligand binding/release kinetics of encapsulated Hbs in PEG-LEH dispersions. To our knowledge, this current work is the first study which has evaluated the kinetics of encapsulated Hbs with O2, CO and NO inside PEG-LEHs composed of DSPC.
Reactions with O2
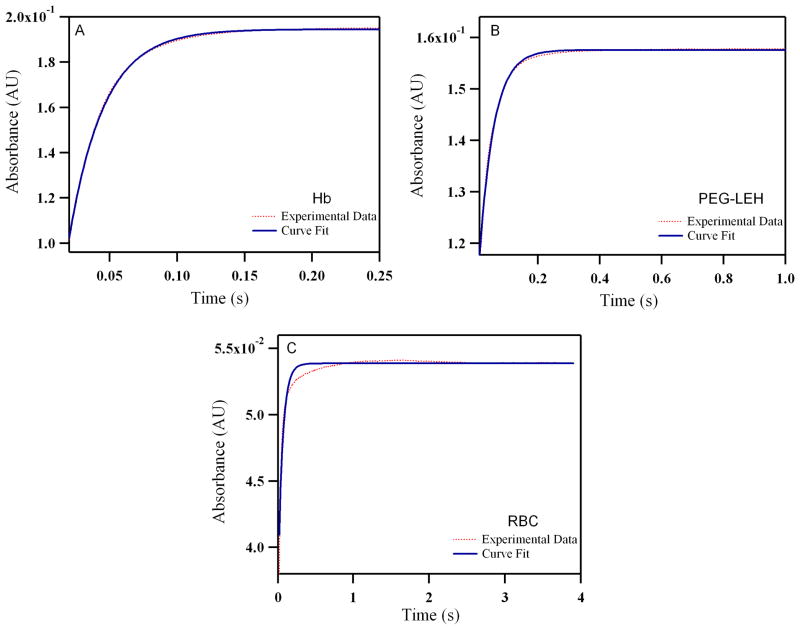
Figure 9 shows time courses for deoxygenation of oxygenated human RBCs and free Hb, as well as, PEG-LEH encapsulating human Hb. The time courses were similar for bovine RBCs/Hb and PEG-LEH encapsulating bovine Hb (see Supporting Information). The values for the O2 dissociation rate constant (koff, O2) are shown in Table 1. The koff, O2 values for acellular Hbs are comparable to most of the other studies reported in the literature (Table 1). However, Tuschida and coworkers 46 have reported higher values of koff, O2 for the Hb used in their study (84.00 s−1) as compared to values in the literature (≈40.00 s−1).47 This higher value could be due to the use of organic solvents during the Hb purification process or heat pasteurization of the Hb used in their studies, which may have chemically modified the Hb and resulted in an increase in koff, O2.48
Figure 9.
Time courses for deoxygenation of human: (A) Hb (B) PEG-LEHs and (C) RBCs in the presence of 1.5 mg/mL of sodium dithionite. The experimental data shows an average of 8–10 kinetic traces for Hb/LEH and 3–4 kinetic traces for RBCs. For experiments with Hb and PEG-LEHs, Hb solutions were made in 0.1 M Tris buffer (pH 7.4). For experiments with RBCs, RBC solutions were made in PBS (pH 7.4), in order to avoid hypotonic shock and lysis of the RBCs. The reactions were monitored at 437.5 nm and 25°C.
Table 1.
Biophysical properties of different HBOCs (Hb, Polymerized Hb, RBCs and PEG-LEHs).
| Type of Hb | Size | P50 (mm Hg) | N | koff, O2 (s −1) | kon, CO 106 M−1 s−1 | kox, NO 106 M−1 s−1 | References |
|---|---|---|---|---|---|---|---|
| Hb | |||||||
| Human (Hemosol Corp.) | 64 kDa | 14.50 | 2.31 | 42.90 | 0.200 | 18.8 | 47 |
| Human (TFF) | 64 kDa | 14.07 | 2.23 | 40.40 | 0.214 | 18.5 | 47 |
| Bovine (Biopure Corp.) | 64 kDa | 29.22 | 2.10 | 37.80 | 0.200 | 19.0 | 47 |
| Bovine (TFF) | 64 kDa | 28.58 | 2.49 | 36.10 | 0.216 | 18.3 | 47 |
| Human (with PLP) | 64 kDa | 23.00 | 1.9 | 84.00 | 0.210 | 87.0 | 28, 46 |
| Human (TFF) | 64 kDa | 13.00 | 2.58 | 38.71 | 0.200 | 27.5 | * |
| Bovine (TFF) | 64 kDa | 26.02 | 2.75 | 38.97 | 0.198 | 28.2 | * |
| Polymerized Hb | |||||||
| Bovine (T- and R-state) | 16–26 MDa | 0.66–41 | < 1 | 22–53 | 0.18–4.80 | 17.5–18.9 | 56 |
| Bovine (Oxyglobin®) | 200 kDa | 35.10 | 1.40 | 60.00 | 0.150 | 66.0 | 28, 46, 57 |
| Human (Hemolink®) | 64–600 kDa | 47.30 | 1.00 | 130 | 0.120 | - | 58 |
| RBCs | |||||||
| Human and Rat | 8 μm | 25.10 | 2.8 | 4.4 | 0.065 | 0.05 | 31, 49, 55 |
| Human (GSABC, D.C.) | 8 μm | 20.00 | 2.18 | 16.67 | 0.130 | 0.03 | * |
| Bovine (QUAD 5, MT) | 8 μm | 30.20 | 2.62 | 2.01 | 0.087 | 0.31 | * |
| PEG-LEHs | |||||||
| Human (with PLP) | 279 nm | 25–31 | 2.1 | 32.00 | 0.210 | 8.80 | 28, 46 |
| Human (TFF) | 176 nm | 22.87 | 2.11 | 21.57 | 0.212 | 4.00 | * |
| Bovine (TFF) | 174 nm | 19.83 | 1.44 | 13.13 | 0.220 | 2.60 | * |
This study
In this study, the values of koff, O2 for RBCs was 2.5–10 fold less than that of acellular Hbs (Table 1). These values were comparable to koff, O2 values for RBCs reported in the literature.49 However, recently Gelderman et al.50 reported koff, O2 values for human RBCs similar to that of unencapsulated Hbs (≈ 40.00 s−1). In that study, the authors used 50 mM Tris buffer for their experimental measurements and do not report washing the human RBCs before measuring the kinetics in order to remove any free Hb that may have been in solution. In addition, there was no discussion about the ability of human RBCs to resist lysis when suspended in 50 mM Tris buffer. Previously, it has been shown that RBCs are prone to hypotonic shock, which results in their lysis and release of free Hb.14, 25 Instead of Tris buffer, we have used PBS (pH 7.4) to maintain the osmotic environment of the RBCs and prevent RBC lysis. In addition, in this current study RBCs were washed with 0.9% saline in order to remove any free Hb contained in the RBC solution. Therefore, we obtained results comparable to that reported in the literature (Table 1). Hence, the artificially high koff, O2 values for RBCs reported by Gelderman et al.50 may be due to the presence of free Hb (originating from RBC storage or RBC lysis) in their solutions.
Interestingly, koff, O2 for PEG-LEH dispersions showed retardation in O2 offloading as compared to acellular Hbs and were slightly higher than the values observed for RBCs (Table 1). This suggests that encapsulation of Hb inside a particle plays a critical role in regulating the delivery of O2 and other gases. In fact, the higher values of koff, O2 for PEG-LEHs as compared to RBCs can be attributed to the smaller size of the PEG-LEH particles as compared to the size of RBCs (200 nm versus 8000 nm), which provides a smaller intracellular diffusion barrier to O2 offloading. The main components of this intracellular diffusion barrier being the size of the particle and the intracellular concentration of Hb. Based on the hematocrit of PEG-LEH dispersions prepared in this study (~ 20%), the intracellular Hb concentration inside PEG-LEH particles ranges from 50–75 g/dL. This intracellular Hb concentration is much higher than that inside red blood cells (30 g/dL).24 However, as was previously mentioned, particle size also factors into the magnitude of the intracellular diffusion barrier. Therefore, the 40-fold increase in the size of the RBC compared to the PEG-LEH particles in this study explains the higher retardation in O2 offloading for RBCs versus PEG-LEHs.
It has been advocated that moderate O2 release rates are important for the successful design of any HBOC, as the oversupply of O2 can trigger autoregulatory induced vasoconstriction.51 Interestingly, the reduction in koff, O2 for PEG-LEHs was 2.5–9 fold less than the acellular HBOCs listed in Table 1. Moreover, the values of koff, O2 for PEG-LEH dispersions prepared in this study were 1.5–2.5 fold lower than that of PEG-LEHs reported in the literature (Table 1). Although previously formulated PEG-LEH particles were larger in diameter (~ 250 nm) compared to PEG-LEH particles in this current study (~ 200 nm), the much higher intracellular Hb concentration inside PEG-LEHs formulated in this current study (50–70 g/dL) explains the observed retardation in koff, O2 of current PEG-LEHs compared to previous PEH-LEH formulations (30 g/dL). Hence, the PEG-LEH dispersions described in this work can provide moderate O2 delivery compared to existing PEG-LEHs dispersions, once administered in vivo. This will negate any autoregulatory induced vasoconstriction due to oversupply of O2.
Reactions with CO
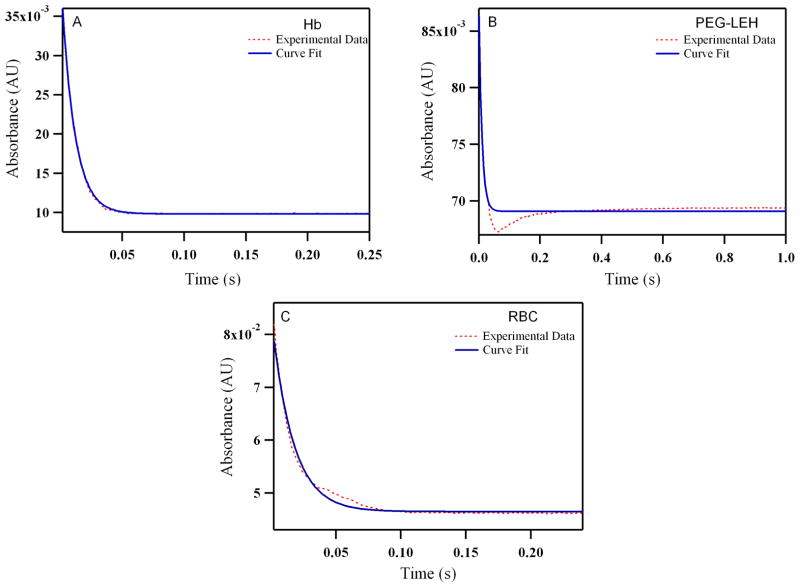
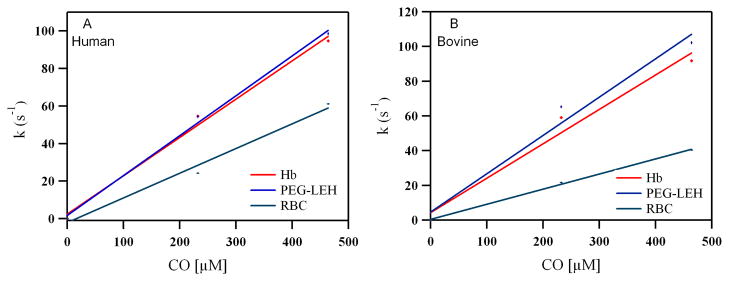
Figure 10 shows time courses for the association reaction between CO and deoxygenated human RBCs/Hb and PEG-LEHs encapsulating human Hb. The time courses were similar for bovine RBCs/Hb and PEG-LEHs encapsulating bovine Hb (see Supporting Information). The values of the CO association rate constants (kon, CO) are shown in Table 1. Figure 11 shows the dependence of the observed rates on CO concentration for both human and bovine Hbs, PEG-LEHs and RBCs. The kon, CO values for Hb and PEG-LEH dispersions were almost similar (p > 0.05). Thus, encapsulation of Hb inside PEG-LEHs did not affect the CO binding kinetics. A similar trend was observed for other PEG-LEH dispersions in the literature 52. This has been attributed to the fact that the magnitude of the CO association rate constants are much smaller than those of O2 and NO.53 However the kon, CO rate constants for RBCs obtained in this study or those found in the literature are smaller than that of Hb. This is mainly due to the larger diameter and thus larger intracellular barrier presented by RBCs as compared to PEG-LEHs (8000 nm versus ~ 200 nm).52
Figure 10.
Time courses for CO (464 μM) association with human: (A) Hb (B) PEG-LEHs and (C) RBCs. The experimental data shows an average of 8–10 kinetic traces. For experiments with Hb and PEG-LEHs, both CO and Hb solutions were made in 50 mM Tris buffer (pH 7.4) in the presence of 1.5 mg/mL of sodium dithionite. For experiments with RBCs, CO and RBC, solutions were made in PBS (pH 7.4) in the presence of 1.5 mg/mL of sodium dithionite, in order to avoid hypotonic shock and lysis of RBCs. The reactions were monitored at 437.5 nm and 25°C.
Figure 11.
Dependence of the observed rates on CO concentration when (A) Human and (B) Bovine Hb (15 μM) is rapidly mixed with different concentrations of CO (0–464 μM).
Reactions with NO
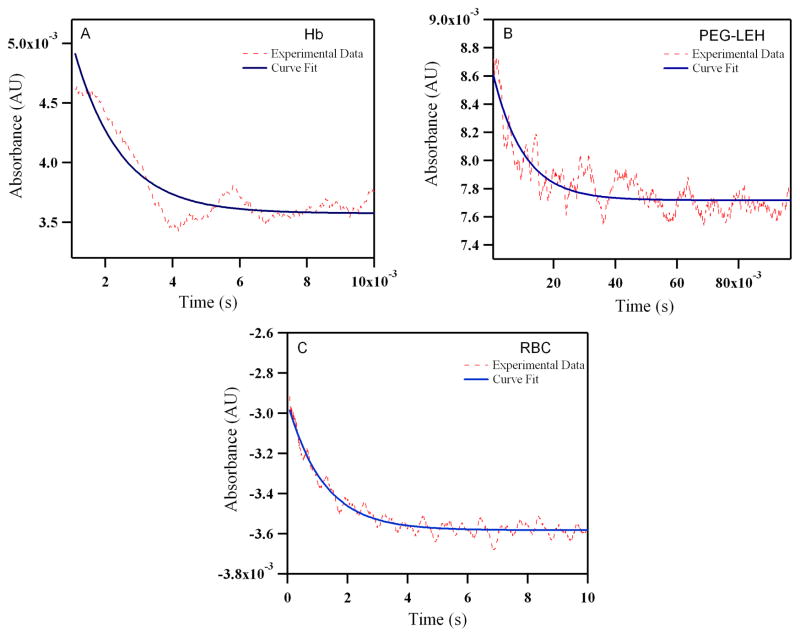
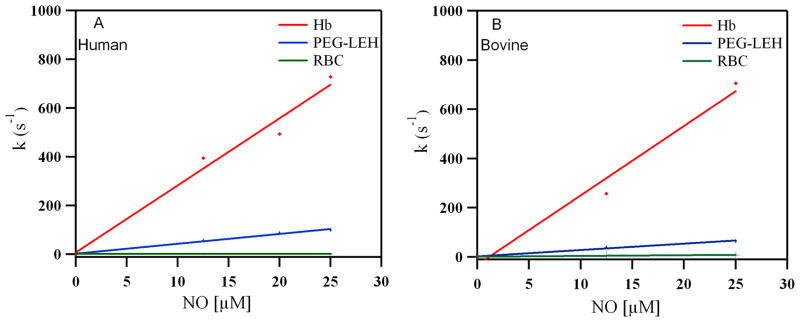
Figure 12 shows time courses for the NO dioxygenation reaction with oxygenated human RBCs/Hb and PEG-LEHs encapsulating human Hb. The time courses were similar for bovine RBCs/Hb and PEG-LEHs encapsulating bovine Hb (see Supporting Information). The values for the NO dioxygenation rate constants (kox, NO) are shown in Table 1. It should be noted that the low HbO2 concentrations in these experiments (0.5 μM) resulted in small absorbance changes. Hence, 7–10 kinetic transients were signal-averaged for each experimental time course in order to improve the signal-to-noise ratio. Figure 13 shows the dependence of the observed rates of NO dioxygenation on NO concentration in both human and bovine Hbs, PEG-LEHs and RBCs. The kox, NO rates for Hbs are comparable to values reported in the literature (27–28 μM 1 s−1 compared to 20–34 μM 1 s−1).47, 54 However, Tsuchida and coworkers46 reported higher kox, NO values for the Hb used in their study (87 μM 1 s−1 compared to 20–35 μM 1 s−1).28, 47, 54 The variation in the rate constants as compared to normal purified Hb again suggests the presence of some sort of structural modification to the Hb molecule as a result of heat pasteurization and/or use of organic solvents during the purification of Hb used in their studies.
Figure 12.
Time courses for NO (25 μM) induced oxidation with human: (A) Hb (B) PEG-LEHs and (C) RBCs. The experimental data shows an average of 8–10 kinetic traces for Hb/PEG-LEHs and 2–3 kinetic traces for RBCs. For experiments with Hb and PEG-LEHs, both NO and Hb, solutions were made in 50 mM Tris buffer (pH 7.4). For experiments with RBCs, NO and RBC, solutions were made in PBS (pH 7.4), to avoid hypotonic shock and lysis of RBCs. The reactions were monitored at 420 nm and 25°C.
Figure 13.
Dependence of the observed NO oxidation rates on NO concentration when (A) Human and (B) Bovine Hb (0.5 μM) is rapidly mixed with different concentrations of NO (0–25 μM).
The kox, NO for human and bovine RBCs was almost 1000 and 100 fold less than that of Hb, respectively (Table 1). A similar retardation effect has been reported in the literature (~650 fold) for RBCs.55 It has been shown that the intracellular diffusion barrier as a result of the RBC size and high intracellular Hb concentration in the RBC facilitates retardation in NO binding.52
The value of kox, NO was significantly retarded (p < 0.05) in PEG-LEHs as compared to acellular Hbs. The kox, NO for PEG-LEHs was 6.5– 10 fold lower than that of Hb. Moreover, the reduction in koff, O2 was 2.5–8 fold less than acellular HBOCs and 2–3 fold lower than that of PEG-LEHs reported in the literature (Table 1). However, kox, NO for PEG-LEHs was significantly lower (p < 0.05) than that of RBCs. This is expected given the smaller size of PEG-LEHs as compared to RBCs, which provides a smaller diffusion barrier to NO scavenging. Computer simulations have shown that PEG-LEH particles extrapolated to the size of a RBC (8000 nm in diameter) possess similar kox, NO values as that of a RBC.52
CONCLUSION
Here we report a simple and economic method to prepare PEG-LEH dispersions. The ease of preparation and unique physico-chemical properties that are comparable to RBCs, makes these PEG-LEH dispersions promising candidates for use as artificial RBC substitutes. The reaction kinetics of acellular Hbs, PEG-LEHs and RBCs with physiological ligands (O2, CO and NO), provides further insight into the role of the intracellular diffusion barrier in the transport of gases in the circulation.
Supplementary Material
Acknowledgments
This work was supported by National Institutes of Health grants R01HL078840 and R01DK070862 to AFP. SR would like to thank Jacob Elmer and Ning Zhang, for help with the MALDI experiments and for useful discussions. We greatly acknowledge Dr. Yiping Jia, Center for Biologics Evaluation and Research, United States Food and Drug Administration, Bethesda, Maryland, for help with the experimental details used in the kinetic experiments conducted in this study. We also acknowledge Dr. Christopher M. Hadad, Department of Chemistry, and Dr. Robert Lee, Department of Pharmacy, The Ohio State University, Columbus OH, for their willingness to let us use their stopped-flow spectrophotometer and homogenizer, respectively.
Footnotes
Supporting Information Available
This material is available free of charge via the Internet at http://pubs.acs.org.
References
- 1.Moore EE. J Am Coll Surg. 2003;196:1–17. doi: 10.1016/s1072-7515(02)01704-0. [DOI] [PubMed] [Google Scholar]
- 2.Basu P. Nature Med. 2003;11:1336. doi: 10.1038/nm1103-1336a. [DOI] [PubMed] [Google Scholar]
- 3.Awasthi VD, Garcia D, Goins BA, Phillips WT. Int J Pharm. 2003;253:121–32. doi: 10.1016/s0378-5173(02)00703-2. [DOI] [PubMed] [Google Scholar]
- 4.Awasthi VD, Garcia D, Klipper R, Goins BA, Phillips WT. J Pharmacol Exp Ther. 2004;309:241–248. doi: 10.1124/jpet.103.060228. [DOI] [PubMed] [Google Scholar]
- 5.Awasthi VD, Garcia D, Klipper R, Phillips WT, Goins BA. Int J Pharm. 2004;283:53–62. doi: 10.1016/j.ijpharm.2004.06.015. [DOI] [PubMed] [Google Scholar]
- 6.Kato A, Arakawa M, Kondo T. Microencapsulation. 1984;1:105–112. doi: 10.3109/02652048409038514. [DOI] [PubMed] [Google Scholar]
- 7.Phillips WT, Klipper RW, Awasthi VD, Rudolph AS, Cliff R, Kwasiborski V, Goins BA. J Pharmacol Exp Ther. 1999;288:665–70. [PubMed] [Google Scholar]
- 8.Sakai H, Cabrales P, Tsai AG, Tsuchida E, Intaglietta M. Am J Physiol Heart Circ Physiol. 2005;288:H2897–2903. doi: 10.1152/ajpheart.01184.2004. [DOI] [PubMed] [Google Scholar]
- 9.Sakai H, Horinouchi H, Masada Y, Takeoka S, Ikeda E, Takaori M, Kobayashi K, Tsuchida E. Biomaterials. 2004;25:4317–25. doi: 10.1016/j.biomaterials.2003.11.005. [DOI] [PubMed] [Google Scholar]
- 10.Sakai H, Masada Y, Horinouchi H, Yamamoto M, Ikeda E, Takeoka S, Kobayashi K, Tsuchida E. Crit Care Med. 2004;32:539–45. doi: 10.1097/01.CCM.0000109774.99665.22. [DOI] [PubMed] [Google Scholar]
- 11.Yoshioka H. Biomaterials. 1991;12:861–864. doi: 10.1016/0142-9612(91)90075-l. [DOI] [PubMed] [Google Scholar]
- 12.Farmer MC, Gaber BP. Methods Enzymol. 1987;149:184–200. doi: 10.1016/0076-6879(87)49056-3. [DOI] [PubMed] [Google Scholar]
- 13.Rudolph AS, Klipper RW, Goins B, Phillips WT. Proc Natl Acad Sci. 1991;88:10976–80. doi: 10.1073/pnas.88.23.10976. [DOI] [PMC free article] [PubMed] [Google Scholar]
- 14.Sakai H, Tomiyama KI, Sou K, Takeoka S, Tsuchida E. Bioconjug Chem. 2000;11:425–32. doi: 10.1021/bc990173h. [DOI] [PubMed] [Google Scholar]
- 15.Sakai H, Takeoka S, Park SI, Kose T, Nishide H, Izumi Y, Yoshizu A, Kobayashi K, Tsuchida E. Bioconjug Chem. 1997;8:23–30. doi: 10.1021/bc960069p. [DOI] [PubMed] [Google Scholar]
- 16.Sakai H, Tsai AG, Kerger H, Park SI, Takeoka S, Nishide H, Tsuchida E, Intaglietta M. J Biomed Mater Res. 1998;40:66–78. doi: 10.1002/(sici)1097-4636(199804)40:1<66::aid-jbm8>3.0.co;2-p. [DOI] [PubMed] [Google Scholar]
- 17.Sou K, Naito Y, Endo T, Takeoka S, Tsuchida E. Biotechnol Prog. 2003;19:1547–1552. doi: 10.1021/bp0201004. [DOI] [PubMed] [Google Scholar]
- 18.Agashe H, Lagisetty P, Awasthi S, Awasthi V. Colloids and Surfaces B: Biointerfaces. 2010;75:573–583. doi: 10.1016/j.colsurfb.2009.09.038. [DOI] [PMC free article] [PubMed] [Google Scholar]
- 19.Hunt CA, Burnette RR, MacGregor RD, Strubbe AE, Lau DT, Taylor N, Kiwada H. Science. 1985;230:1165–1168. doi: 10.1126/science.4071041. [DOI] [PubMed] [Google Scholar]
- 20.Jopski B, Pirkl V, Jaroni H-W, Schubert R, Schmidt K-H. Biochim Biophys Acta. 1989;978:79–84. doi: 10.1016/0005-2736(89)90501-4. [DOI] [PubMed] [Google Scholar]
- 21.Brandl M, Gregoriadis G. Biochim Biophys Acta. 1994;1196:65–75. doi: 10.1016/0005-2736(94)90296-8. [DOI] [PubMed] [Google Scholar]
- 22.Gaber BP, Yager P, Sheridan JP, Chang EL. FEBS Letters. 1983;153:285–288. doi: 10.1016/0014-5793(83)80625-5. [DOI] [PubMed] [Google Scholar]
- 23.Rahman MS. CRC Press. 2007. p. 539. [Google Scholar]
- 24.Pandit SA, Bostick D, Berkowitz ML. Biophysical J. 2004;86:1345–1356. doi: 10.1016/S0006-3495(04)74206-X. [DOI] [PMC free article] [PubMed] [Google Scholar]
- 25.Sakai H, Okamoto M, Ikeda E, Horinouchi H, Kobayashi K, Tsuchida E. J Biomed Mater Res. 2009;90A:1107–1119. doi: 10.1002/jbm.a.32164. [DOI] [PubMed] [Google Scholar]
- 26.Szebeni J, Baranyi L, Savay S, Bodo M, Morse DS, Basta M, Stahl GL, Bunger R, Alving CR. Am J Physiol Heart Circ Physiol. 2000;279:H1319–H1328. doi: 10.1152/ajpheart.2000.279.3.H1319. [DOI] [PubMed] [Google Scholar]
- 27.Miller CR, Bondurant B, McLean SD, McGovern KA, O’Brien DF. Biochemistry. 1998;37:12875–12883. doi: 10.1021/bi980096y. [DOI] [PubMed] [Google Scholar]
- 28.Sakai H, Sato A, Sobolewski P, Takeoka S, Frangos JA, Kobayashi K, Intaglietta M, Tsuchida E. Biochim Biophys Acta. 2008;1784:1441–1447. doi: 10.1016/j.bbapap.2008.03.007. [DOI] [PubMed] [Google Scholar]
- 29.Sakai H, Suzuki Y, Kinoshita M, Takeoka S, Maeda N, Tsuchida E. Am J Physiol Heart Circ Physiol. 2003;285:H2543–2551. doi: 10.1152/ajpheart.00537.2003. [DOI] [PubMed] [Google Scholar]
- 30.Valenzuela A, Sanhueza J, Nieto S. J Food Science. 2002;67:2051–2055. [Google Scholar]
- 31.Palmer AF, Sun G, Harris DR. Biotechnol Prog. 2009;25:189–199. doi: 10.1002/btpr.119. [DOI] [PMC free article] [PubMed] [Google Scholar]
- 32.Greenwald AR. CRC Handbook of Methods for Oxygen Radical Research. 1985. pp. 137–141. [Google Scholar]
- 33.Elmer J, Harris D, Palmer AF. J Chromatogr B. 2010;879:131–138. doi: 10.1016/j.jchromb.2010.11.021. [DOI] [PMC free article] [PubMed] [Google Scholar]
- 34.Sakai H, Hara H, Yuasa M, Tsai AG, Takeoka S, Tsuchida E, Intaglietta M. Am J Physiol Heart Circ Physiol. 2000;279:H908–915. doi: 10.1152/ajpheart.2000.279.3.H908. [DOI] [PubMed] [Google Scholar]
- 35.Sakai H, Sato A, Takeoka S, Tsuchida E. Langmuir. 2007;23:8121–8128. doi: 10.1021/la7004503. [DOI] [PubMed] [Google Scholar]
- 36.Sakai H, Horinouchi H, Tomiyama K, Ikeda E, Takeoka S, Kobayashi K, Tsuchida E. Am J Pathol. 2001;159:1079–1088. doi: 10.1016/S0002-9440(10)61783-X. [DOI] [PMC free article] [PubMed] [Google Scholar]
- 37.Sakai H, Masada Y, Takeoka S, Tsuchida E. J Biol Chem. 2002;131:611–7. doi: 10.1093/oxfordjournals.jbchem.a003141. [DOI] [PubMed] [Google Scholar]
- 38.Sakai H, Takeoka S, Wettstein R, Tsai AG, Intaglietta M, Tsuchida E. Am J Physiol Heart Circ Physiol. 2002;283:H1191–9. doi: 10.1152/ajpheart.00080.2002. [DOI] [PubMed] [Google Scholar]
- 39.Sakai H, Tsuchida E, Horinouchi H, Kobayashi K. Artif Cells Blood Substit Immobil Biotechnol. 2007;35:81–91. doi: 10.1080/10731190600974582. [DOI] [PubMed] [Google Scholar]
- 40.Tsai AG, Cabrales P, Manjula BN, Acharya SA, Winslow RM, Intaglietta M. Blood. 2006;108:3603–3610. doi: 10.1182/blood-2006-02-005272. [DOI] [PMC free article] [PubMed] [Google Scholar]
- 41.Awasthi V, Yee SH, Jerabek P, Goins B, Phillips WT. J Appl Physiol. 2007;103:28–38. doi: 10.1152/japplphysiol.00136.2006. [DOI] [PubMed] [Google Scholar]
- 42.Philippot RJ, Schuber F. CRC Press; 1995. p. 62. [Google Scholar]
- 43.Linberg R, Conover CD, Shum KL, Shorr RG. Artif Cells Blood Substit Immobil Biotechnol. 1998;26(2):133–48. doi: 10.3109/10731199809119772. [DOI] [PubMed] [Google Scholar]
- 44.Wang L, Morizawa K, Tokuyama S, Satoh T, Tsuchida E. Polymers for Advanced Technologies. 1993;4:8–11. [Google Scholar]
- 45.Antonini E, Brunori M. Amsterdam: North-Holland Pub. Co; 1971. [Google Scholar]
- 46.Sakai H, Okuda N, Sato A, Yamaue T, Takeoka S, Tsuchida E. Am J Physiol Heart Circ Physiol. 2010;298:H956–965. doi: 10.1152/ajpheart.00741.2009. [DOI] [PubMed] [Google Scholar]
- 47.Elmer J, Buehler PW, Jia Y, Wood F, Harris DR, Alayash AI, Palmer AF. Biotech Bioeng. 2010;106:76–85. doi: 10.1002/bit.22659. [DOI] [PubMed] [Google Scholar]
- 48.Sakai H, Takeoka S, Yokohama H, Seino Y, Nishide H, Tsuchida E. Protein Expression and Purification. 1993;4:563–569. doi: 10.1006/prep.1993.1074. [DOI] [PubMed] [Google Scholar]
- 49.Vandegriff KD, Olson JS. J Biochem. 1984;259:12609–12618. [PubMed] [Google Scholar]
- 50.Gelderman MP, Yazer MH, Jia Y, Wood F, Alayash AI, Vostal JG. Transfusion Med. 2010;20:341–345. doi: 10.1111/j.1365-3148.2010.01016.x. [DOI] [PubMed] [Google Scholar]
- 51.Billett HH. Clinical Methods: The History, Physical, and Laboratory Examinations. 3. Vol. 151. Boston: Butterworths; 1990. [PubMed] [Google Scholar]
- 52.Harder DR, Narayanan J, Birks EK, Liard JF, Imig JD, Lombard JH, Lange AR, Roman RJ. Circ Res. 1996;79:54–61. doi: 10.1161/01.res.79.1.54. [DOI] [PubMed] [Google Scholar]
- 53.Sakai H, Sato A, Masuda K, Takeoka S, Tsuchida E. J Biochem. 2008;283:1508–1517. doi: 10.1074/jbc.M707660200. [DOI] [PubMed] [Google Scholar]
- 54.Olson JS, Foley EW, Maillett DH, Paster EV. Methods Mol Med. 2003:65–91. doi: 10.1385/1-59259-373-9:065. [DOI] [PubMed] [Google Scholar]
- 55.Eich RF, Li T, Lemon DD, Doherty DH, Curry SR, Aitken JF, Mathews AJ, Johnson KA, Smith RD, Phillips GN, Olson JS. Biochemistry. 1996;35:6976–6983. doi: 10.1021/bi960442g. [DOI] [PubMed] [Google Scholar]
- 56.Liu X, Miller MJS, Joshi MS, Sadowska-Krowicka H, Clark DA, Lancaster JR. J Biol Chem. 1998;273:18709–18713. doi: 10.1074/jbc.273.30.18709. [DOI] [PubMed] [Google Scholar]
- 57.Buehler PW, Zhou Y, Cabrales P, Jia Y, Sun G, Harris DR, Tsai AG, Intaglietta M, Palmer AF. Biomaterials. 2010;31:3723–3735. doi: 10.1016/j.biomaterials.2010.01.072. [DOI] [PMC free article] [PubMed] [Google Scholar]
- 58.Buehler PW, Boykins RA, Jia Y, Norris S, Freedberg DNI, Alayash AI. Anal Chem. 2005;77:3466–3478. doi: 10.1021/ac050064y. [DOI] [PubMed] [Google Scholar]
- 59.Boykins RA, Buehler PW, Jia Y, Venable R, Alayash AI. Proteins: Structure, Function, and Bioinformatics. 2005;59:840–855. doi: 10.1002/prot.20453. [DOI] [PubMed] [Google Scholar]
Associated Data
This section collects any data citations, data availability statements, or supplementary materials included in this article.


