

Abstract
We describe a comprehensive quantitative measure of the splicing impact of a complete set of RNA 6-mer sequences by deep sequencing successfully spliced transcripts. All 4096 6-mers were substituted at five positions within two different internal exons in a 3-exon minigene, and millions of successfully spliced transcripts were sequenced after transfection of human cells. The results allowed the assignment of a relative splicing strength score to each mutant molecule. The effect of 6-mers on splicing often depended on their location; much of this context effect could be ascribed to the creation of different overlapping sequences at each site. Taking these overlaps into account, the splicing effect of each 6-mer could be quantified, and 6-mers could be designated as enhancers (ESEseqs) and silencers (ESSseqs), with an ESRseq score indicating their strength. Some 6-mers exhibited positional bias relative to the two splice sites. The distribution and conservation of these ESRseqs in and around human exons supported their classification. Predicted RNA secondary structure effects were also seen: Effective enhancers, silencers and 3′ splice sites tend to be single stranded, and effective 5′ splice sites tend to be double stranded. 6-mers that may form positive or negative synergy with another were also identified. Chromatin structure may also influence the splicing enhancement observed, as a good correspondence was found between splicing performance and the predicted nucleosome occupancy scores of 6-mers. This approach may prove of general use in defining nucleic acid regulatory motifs, substitute for functional SELEX in most cases, and provide insights about splicing mechanisms.
The transfer of genetic information from DNA to protein in living things is accomplished with accuracy, precision, and fidelity. These qualities characterize pre-mRNA splicing as much as transcription and translation (Fox-Walsh and Hertel 2009). The accurate identification of splice sites in long metazoan transcripts depends not only on the splice-site sequences that are substrates for the splicing reaction, but also on short RNA stretches known as exonic and intronic splicing enhancers (ESEs and ISEs) and silencers (ESSs and ISSs). These so-called splicing regulatory motifs are manifold and, like their transcriptional counterparts, are thought to act in combination. Several different approaches have been used to identify ESEs and ESSs, each with strengths and weaknesses. Motifs have been defined as binding sites to targeted RNA-binding proteins, mostly SR (serine and arginine rich) proteins; these experiments define the mediator as well as the motif, but typically lack a functional correlate. The iterative nature of these selections also limits the results to motifs with the highest binding affinities (Tacke and Manley 1995; Cavaloc et al. 1999), although a newer implementation circumvents this problem (Ray et al. 2009; Reid et al. 2009). Binding analysis has also been used to identify in vivo RNA-binding sites for targeted proteins by immunoprecipitation and high-throughput sequencing (e.g., Licatalosi et al. 2008; Sanford et al. 2009; Xue et al. 2009; Yeo et al. 2009). Although the sequences so far identified are comprehensive and reflect those actually present in living cells, in most cases the connection to function is inferred rather than measured. Global transcriptome analyses have also been used to identify splicing regulatory motifs. Here, not only are sequences identified, but they can also be assigned roles in tissue-specific (Castle et al. 2008) or environmentally cued (Hartmann et al. 2009) alternative splicing. RNAi-mediated depletion of splicing factors has also been used to identify targets of specific splicing factors (Blanchette et al. 2005, 2009). These powerful methods are comprehensive and go beyond simple identification; however, the activity of the motifs is once again inferred rather than measured and they have yielded mainly intronic rather than exonic sequences. Direct functional selections for exonic splicing sequences have been carried out both in vitro (Tian and Kole 1995, 2001; Liu et al. 1998; Schaal and Maniatis 1999; Smith et al. 2006) and in vivo (Coulter et al. 1997; Wang et al. 2004), sometimes tied to responses to specific SR proteins (Liu et al. 1998). These elegant experiments usually involve iterative selection and, so, lack comprehensiveness and quantitation. Genomic statistical analyses have also been used to discover ESEs and ESSs based on assumptions linking function to relative abundance or evolutionary conservation (Fairbrother et al. 2002; Zhang and Chasin 2004; Goren et al. 2006). These methods are comprehensive, but functional connections are indirect, as are any quantitative interpretations. The definition of ISEs and ISSs has proceeded along similar lines (Yeo et al. 2004, 2007; Zhang et al. 2005b; Voelker and Berglund 2007; Aznarez et al. 2008; Friedman et al. 2008; Ke and Chasin 2010).
The success of these motif identification methods has in one sense been too great, in that over 75% of the nucleotides in a typical human exon are now found within a motif that is on one list or another (Chasin 2007). Somehow, the cell is integrating all of this information to come up with a splicing decision. One way to explain this apparent excess of information is the effect of context. In some contexts, a particular ESE may not, in fact, be active, because it is occluded by secondary structure or because it lacks a required synergistic partner sequence or is subject to interference by a particular ESS. One way to demonstrate such context effects is to place one or a few defined oligomers in several different locations in an RNA molecule, such as a predicted RNA-binding target sequence at several places within an exon (Goren et al. 2006). Another way to systematically study context effects is to compare the effectiveness of many different sequences placed in a few different locations.
With the advent of affordable high-throughput sequencing it has become possible to follow this second approach on a large scale. In vivo splicing measurements can now be carried out on a scale that allows exhaustive testing of the activity of all possible k-mers for k in the range from 5 to 8. Here, we describe the quantitation of in vivo splicing enhancement or silencing afforded by all 4096 6-mers placed at five different positions in two model exons. The spectra of activities of the 6-mers often differed among the different locations. Much of this context effect was due to the creation of different overlapping sequences at each site. Taking these overlaps into account, 6-mers could be classified as ESEs or ESSs with scores indicating their strengths. The classes so defined exhibited genomic characteristics that indicated their widespread class-defined use. Several context effects beyond overlapping sequences were identified, including positional bias with respect to the two splice sites, pre-mRNA secondary structure, synergistic partner requirements, and a possible nucleosome positioning influence.
Results and Discussion
Overview of the method
We started with a 3-exon minigene, in which a central target exon was flanked by two hamster Dhfr gene exons. For illustrative purposes we will describe an experiment using Wilm's Tumor gene exon 5 (WT1-5) as the central exon. The inclusion of WT1-5 was rendered inefficient by depriving it of its natural exon flanks, resulting in its being predominantly skipped in transient transfections (Zhang et al. 2005a). A library of variant minigenes was then constructed to include a random 6-mer occupying positions +5 to +10 of the central exon (Fig. 1A); mutation at this location was known to affect splicing (Zhang et al. 2005a). The contents of this library were then sequenced using an Illumina Genome Analyzer, and from the millions of high-confidence reads a relative concentration was assigned to all 6-mers. The library was then transfected into human embryonic kidney cells (HEK293), and 24 h later the mRNA molecules that had successfully included the central exon (termed hereafter as “spliced”) were isolated by size selection. After conversion to cDNA, the substituted regions of these output molecules were similarly sequenced. For each 6-mer an enrichment of output proportion over input proportion (enrichment index, EI) was calculated. A greater EI value means that the central exon is spliced more efficiently, i.e., contains a splicing enhancer. Likewise, a smaller EI value signifies splicing silencing, which can be considered analogously. Thus, we obtain a measurement of the splicing regulatory effects for each of the 4096 6-mers. This scheme is illustrated in Figure 1B.
Figure 1.

High-throughput definition of pre-mRNA splicing signals from sequence space. (A) The architecture of a linear minigene library. This minigene contains the Wilm's tumor gene 1 exon 5 (WT1-5) as a central exon (yellow box) flanked by sequences from a Dhfr minigene (blue boxes, Dhfr exons). A random 6-mer library (gray box) is located from +5 to +10 in the central exon (termed location WA) and the detailed sequences of the central exon and its 3′ and 5′ splice sites are shown. (B) The scheme of the high-throughput in vivo functional selection of splicing motifs. The Enrichment Index (EI) for a particular 6-mer is defined as the output proportion of this motif divided by its input proportion. The numbers represent six exemplary cases. (C) Minigene library construction. See Methods for details. (D) The distribution of the 4096 6-mers in the DNA input (dashed black) and RNA output (red) sequences. (E) Duplicate PCR preparations and sequencings of the DNA input library designated by the CG and TA barcodes yield very similar compositions. The proportions of the 6-mers are presented as counts per million reads. (F) The compositions of 6-mers in the RNA output sequences from two independent transfections labeled with either the CG or the TA barcode. The proportions of the 6-mers are presented as counts per million reads. (G) The distribution of 6-mer log2EI values. The results represent the average of two transfections.
Library construction
Problems in the construction of an effective library were readily apparent in the abundance of data produced in these experiments. The final method included the use of PCR rather than E. coli to create the minigenes, carefully designed PCR templates, and exceptional measures to avoid molecular contamination (see Methods). The final libraries displayed a bell-shaped distribution (Fig. 1D, black line). We used 6-mers rather than longer k-mers in order to ensure adequate representation of all 4096 sequences. To measure reproducibility we produced duplicate minigene libraries that could be identified with a barcode. As can be seen in Figure 1E, duplicate library preparations were very similar in composition (R2 = 0.98).
Identification and measurement of splicing regulatory sequences
The duplicate libraries were used for independent transfections of HEK293 cells, after which RT–PCR and gel purification were used to isolate the minority (∼16%) of molecules that had included, rather than skipped, the central exon of the minigene. We found it necessary to transfect a relatively large number of cells (4 × 10⁶) and to use a strong promoter (CMV-based) to ensure a yield of purified RNA molecules sufficient to cover all k-mers. As expected, the distribution of these output sequences, selected for their ability to promote splicing, was quite different from that of the input, with most minigenes generating few spliced mRNA molecules (Fig. 1D, red line). The composition of output sequences was highly reproducible in two independent transfections in this experiment (Fig. 1F, R2 = 0.99).
The output proportion of each spliced mRNA molecule containing a particular 6-mer was normalized by dividing by its input proportion. The resulting EI (enrichment index) values provide a relative measure of central exon inclusion for each pre-mRNA molecule. Their distribution for this WT1-5 experiment is shown in Figure 1G. This method, quantifying extensive phenotypic arrays from sequence arrays, we term QUEPASA.
The effect of RNA context on the activity of all 6-mers
The effect of a splicing regulatory motif can depend on the RNA sequence that surrounds it. We examined the extent of such effects by extending the experiment described above to test a total of five locations (Fig. 2A), as follows: WA, near the acceptor site (3′ splice site) preceding the WT1-5 exon (51 nt), described above; WD, near the donor site (5′ splice site) of WT1-5; HA, near the acceptor site of human beta globin exon 2 (Hb2, 223 nt); HM, near the middle of Hb2; and HD, near the donor site of Hb2. To compare the results from different locations we expressed all EI scores as the log2 so as to give comparable weight to enhancers and silencers and scaled the results from each location so that the range from −1 to +1 captured 95% of the 6-mers. We termed this scaled value LEIsc (log of the enrichment index, scaled); the LEIsc value of a 6-mer represents the splicing behavior of a pre-mRNA molecule harboring it at a particular location in a particular exon. The 10 pairwise comparisons of LEIscs between the five locations generally showed fair to poor correlations with a median R2 value of 0.10. The best (WA vs. WD) yielded an R2 of 0.34 and the worst (HA vs. WD) 3 × 10⁻⁵ (Fig. 2B,C, respectively; see Supplemental Fig. 1 for all 10 scatter plots). Thus, the context of a substituted 6-mer can greatly influence its effect. The LEIsc values for all five locations can be found in Supplemental Table 1. (The same table is also listed at http://www.columbia.edu/cu/biology/faculty/chasin/ESRseq.) Despite the variability seen between locations, LEIscs seem to be identifying ESEs and ESSs that are generally used, since 6-mers with high scores at each location were found to be enriched and 6-mers with low scores depleted in human exons compared with introns (Supplemental Fig. 2A–O); exons with lower average LEIsc values taken from each location tend to have stronger 3′ and 5′ splice site sequences (Supplemental Fig. 2P–T).
Figure 2.

Examples of the effect of location on the splicing behavior of substituted pre-mRNA molecules. (A) The five locations in exons WT1-5 (top, 51 nt) and Hb2 (bottom, 223 nt). (B) The best correlation of the effect of 6-mer substitutions (LEIsc, log of the enrichment index, scaled) was between the WA and WD locations (R2 = 0.34). (C) The worst correlation was between WD and HA (R2 = 3 × 10⁻⁵). The dashed line is the least squares regression fit. The results for all five locations are shown in Supplemental Figure 1.
To minimize the effect of NMD, we had used a minigene mutated so as to have no ATG triplets in exon 1 (but with a start codon in exon 3) (kindly provided by Mauricio Arias, Dept. of Biological Sciences, Columbia University). However, some 6-mer substitutions could give rise to in-frame premature termination codons (PTC) at the substitution location if an ATG triplet in the central exon is used as a start site, and we considered the possibility that some poor representation of mRNA molecules was due to nonsense-mediated decay (NMD) rather than inefficient splicing. At the WA, WD, and HD locations, these PTCs will reside at positions <50 nt from the end of a penultimate exon, positions from which NMD is not usually seen (Isken and Maquat 2007). Such is not the case for locations HA and HM, and so we looked for evidence of an NMD bias in the Enrichment Index. An examination of trinucleotide normalized frequencies showed the stop codons TAA and TAG were among the lowest (Supplemental Table 2). However, NMD is unlikely to be the cause, as this result was also seen at locations that should be immune to NMD (WA, WD, and HD), and the low frequencies were not sensitive to position within the exon (potential reading frame). Most telling, the TGA stop codon in all three reading frames at all five locations is not selected against, occurring with a frequency close to the average (1.56%, 1/64).
Validation of individual sequences
We reasoned that the probability of inclusion of each mutant exon should be proportional to the intrinsic ability of each central exon to be spliced, which, in turn, is dependent on the strength of a splicing element created by the substituted 6-mer. If both of these assumptions hold, then the proportion of inclusion yielded by a given pre-mRNA (i.e., included/[included + skipped]) should be a linear function of its EI and (less obviously) of the inclusion yield of the library as a whole. The derivation (see Methods) shows that the inclusion yield due to motif A (percent spliced in, PSIA) equals the EI of A multiplied by the observed inclusion yield of the library as a whole (PSIL). We tested these ideas by constructing 50 minigenes harboring 6-mers spanning the entire range of observed EI values and measuring exon inclusion after transfection into HEK293 cells. The experiment included substitutions at all five locations. The results showed a very good concordance between the inferred percent inclusion calculated from the digital data and the observed percent inclusion for the data overall (a slope of 0.94, close to the predicted 1.0, and an R2 of 0.97). The results from the WA context are shown in Figure 3 and those from the remaining four contexts in Supplemental Figure 3. All of the inferred and observed percent inclusions are listed in Supplemental Table 3. We conclude that this high-throughput digital method for detecting splicing after transfection provides a quantitative measure of splicing efficiency. A similar digital approach for measuring alternative splicing has been successfully used by Mereau et al. (2009). It should be noted that the ∼1000-fold dynamic range seen using this digital method is greater than the usual gel-based measurements.
Figure 3.

Experimental validation of the effect of substituting individual 6-mer sequences. The observed percent inclusion resulting from testing 14 6-mers at the WA location (y-axis) agreed well with those calculated from the digital data (x-axis) as described in Methods. Tested 6-mers were chosen from the entire range of EI values observed. After transfection into HEK293 cells, RT–PCR products in ethidium bromide-stained gels were quantified by ImageJ. Error bars show the range from duplicate transfections. Observed inclusion is 100 × included/(included + skipped). The observed percent inclusion of 36 additional 6-mers from the WD, HA, HM, and HD locations also agreed well with those calculated from the digital data (Supplemental Fig. 3A–D). The locations are depicted schematically in Figure 2A.
Effect of context created by overlapping 6-mers
One evident source of difference between any two locations lies in the nature of the five bases that flank the site of 6-mer substitution. As these are different at each site, each of the 4096 substitutions gives rise to a unique set of 10 overlapping 6-mers (from −5 to +5 relative to the ends of the substitution) (Fig. 4A) at each location. We consider the overlapping sequences as 6-mers for consistency. For any particular mutant pre-mRNA molecule, the dominant splicing regulatory sequence may well lie within one or more of the overlapping 6-mers in this 16-nt region rather than being the substitution 6-mer itself. This state of affairs could be the source of much of the apparent variation seen among different substitution locations. To take this overlap effect into account, for each possible 6-mer we collected the LEIsc values from all pre-mRNA molecules that contained it anywhere within the 16-nt region. For example, the 6-mer GACGTC was created 17 times among all five locations: once each in the WA and HM locations and five times each in WD, HA, and HD (Fig. 4B). Each of these occurrences is associated with a particular pre-mRNA molecule and a particular LEIsc value for that molecule (Fig. 4B). We then calculated the average of these LEIsc values and used a t-test to compare it with the average of the LEIsc values of molecules that did not contain the 6-mer. This latter value is always close to zero since it is comprised of almost all of the 20,480 (5 × 4096) molecules considered. If a 6-mer had a significantly higher average LEIsc value (P < 0.05, t-test) it was viewed as splicing enhancer (“ESEseq,” e.g., GACGTC in Fig. 4C), and we defined its ESEseq score as the difference between the averages of the two categories described above (present vs. absent). ESSseq scores were defined similarly for 6-mers that had a significantly lower average LEIsc value (e.g., CCAGCA in Fig. 4C). The term “ESRseq” refers to the above two categories as a group. The 6-mers that showed no significant differences have been provisionally regarded as neutral (e.g., AAAGAG) (Fig. 4C). Failure to achieve this cutoff depends on two factors: the variance among the results from the five different locations and the magnitude of the effect on splicing. In this way, we defined 1182 ESEseqs (FDR = 17.3%) and 1090 ESSseqs (FDR = 18.8%) as well as their ESRseq scores (Supplemental Tables 4–7). Similar results were obtained using a Kolmogorov-Smirnov (K-S) test. A few 6-mers appear more than once in an overlap region. In these cases we counted only the presence or absence of the 6-mer, as a regression model in which the effect on splicing was assumed to be linearly dependent on the number of occurrences of these 6-mers produced virtually the same results.
Figure 4.

Contexts created by overlapping 6-mers. (A) An example of how a substitution (GACGTC) creates 11 overlapping WA 6-mers spanning a 16-nt region. The 11 variable 6-mers are distinct for each location and all are assumed capable of influencing splicing. To take the overlapping 6-mers into account, each was assigned the value 1.033, representing the LEIsc value observed for this pre-mRNA molecule. Library bases are underlined. (B) An example of one 6-mer (GACGTC) and the LEIsc values of all the molecules from all locations that contain it in the 16-nt overlap region. (C) Assignment examples for an ESEseq (GACGTC), an ESSseq (CCAGCA), and a neutral 6-mer (AAAGAG). The 20,480 total molecules were classified into two categories: those in which a 6-mer was absent (−) or present (+). Average LEIsc values for each category are shown. Splicing enhancers (ESEseqs) are defined as 6-mers, for which the average LEIsc value is significantly higher when present and its ESEseq score is the difference between the average LEIsc values of the two categories. Splicing silencers (ESSseqs) are defined as 6-mers, for which the average LEIsc value is significantly lower when present. Neutral 6-mers are defined as 6-mers, for which the two values are not significantly different. P-values are from a t-test. The error bar is SEM. (D) Comparison of the observed LEIsc value of a library pre-mRNA molecule with the splicing strength predicted from the additive model described in the text. The chart contains 20,480 points.
To test the validity of these ESRseq (ESEseq or ESSseq) scores, we constructed an additive model to calculate the net effect of the 11 6-mers found in a given pre-mRNA molecule, weighting each ESRseq present by its ESRseq score. In this way (see Methods) a predicted splicing strength was calculated for each of the 20,480 pre-mRNA molecules created in these experiments. The observed LEIsc values agreed well with these predicted values (R2 = 0.71 for all 20,480 molecules) (Fig. 4D). The R2 values for each individual location ranged from 0.53 to 0.84 (Supplemental Fig. 4A–E). We also tested this model by leaving out one location and using the remaining four for prediction; the predictions for the left-out location were then tested against the corresponding observed LEIsc values. The observed LEIsc values again agreed well with the predicted values, with R2 values ranging from 0.21 to 0.67 for the five tests (Supplemental Fig. 4F–J) and 0.39 overall (Supplemental Fig. 4K). We conclude that this treatment successfully takes into account the contributions of the created overlapping sequences, and that such sequences are responsible for a large part of the context effect. Additional sources of context effects are considered below.
Characteristics of ESRseqs
ESEseqs as defined above exhibit a sharply higher abundance in exons compared with their intronic flanks (Fig. 5A), while ESSseqs show the opposite behavior (Fig. 5B). This enrichment/depletion is somewhat lower in alternative cassette exons compared with constitutive exons, and is not seen in pseudo exons. In addition, using the ratio of abundance in exons divided by abundance in intronic flanks as a sign of enhancer function, the top ESEseqs consistently outperformed the top 6-mers derived from LEIscs at individual locations (Fig. 5C); the same was true, in reverse, for ESSseqs (Fig. 5D). ESEseqs are conserved in evolution and exhibit a lower SNP density compared with scrambled controls; the reverse is true for ESSseqs (Fig. 5E; Supplemental Fig. 5A,B). We also surveyed ESRseq scores of 6-mers in and around more than 100,000 human exons at single-nucleotide resolution. Scores were strikingly higher in exons compared with adjacent intronic sequences; alternative cassette exons exhibited a somewhat lower difference from constitutive exons, while pseudo exons showed no such difference (Fig. 5F). The differences between the average ESRseq scores of constitutive, alternative, and pseudo exons were all highly significant (P < 10−140).
Figure 5.

Genomic characteristics of ESEseqs and ESSseqs. (A) Frequency of the top 400 ESEseqs in human constitutive (119,006, black), alternative cassette (25,807, red), and pseudo exons (134,994, gray), all >50 nt, and their flanking introns. The frequency of the top 400 6-mers per exon at each nucleotide position is shown on the y-axis. The black bars on the x-axis represent a composite exon comprising 50 nt downstream from the 3′ splice site abutted to 50 nt upstream of the 5′ splice site. Thin lines indicate intronic flanks. Positions overlapping the 3′ and 5′ splice sites (−14 to +1 and −3 to +6) were excluded. (B) Frequency of the bottom 400 ESSseqs, presented as in A. (C) ESEseqs are more highly enriched in constitutive exons than are the top performing 6-mers from any individual location. (T) Top; (**) P < 10−136 (χ2 test). (D) ESSseqs are more highly enriched in intronic regions (note the reversal of the ratio on the y-axis) than are the bottom performing 6-mers from any individual location. (B) Bottom; (**) P < 10−140 (χ2 test). (E, left) ESEseqs are conserved in macaque-human evolution and ESSseqs are not. (Right) SNP density is lower in ESEseqs and higher in ESSseqs. Only non-CpG containing ESRseqs and ESSseqs (filled bars) were used; the controls (open bars) were scrambled non-CpG-containing versions of the ESRseqs. (**) P < 10−140 (χ2 test). Analyses that included CpG-containing 6-mers yielded similar results (Supplemental Fig. 5A,B). Error bars, SEM. (F) Distribution of average ESRseq scores in and around human constitutive (black), alternative cassette (red), and pseudo exons (gray).
We used the ESRseq scores as a yardstick to interpret previously published determinations of splicing elements. ESEseqs coincided with many ESEs defined by computation (RESCUE-ESEs [Fairbrother et al. 2002], PESEhexs, [Ke et al. 2008], and ESR [Goren et al. 2006]), by five functional SELEX studies (Tian and Kole 1995; Coulter et al. 1997; Liu et al. 1998; Schaal and Maniatis 1999; Wang et al. 2004; Smith et al. 2006), and by SR protein-binding SELEX studies (ASF/SF2 [Tacke and Manley 1995], 9G8 [Cavaloc et al. 1999], SC35 [Cavaloc et al. 1999]). Likewise, ESSseqs coincided with ESSs defined computationally (PESShexs [Ke et al. 2008]), by functional selection (FAShex3s [Wang et al. 2004]), and by hnRNP A1 binding SELEX (Burd and Dreyfuss 1994) (Table 1; Supplemental Table 8A, and references therein). This coincidence is all the more remarkable given that many of these predictors do not agree with each other (e.g., PESS and FAShex3). No significant overlap was found for SRp40 (Tacke et al. 1997) nor for PTB (Singh et al. 1995). Interestingly, these proteins have been reported to act as both enhancers and silencers (Buratti et al. 2007; Llorian et al. 2010). All of the splicing factors mentioned are abundantly expressed in the HEK293 cell line based on microarray data (e.g., GSE10241, from GEO at the NCBI).
Table 1.
Overlap of ESRseqs with previously described exonic splicing sequences

While the overlap with all classes of previously described splicing regulatory sequences is highly significant, there are also a large number of ESRseqs that do not appear on previous lists (Supplemental Tables 5–7, also listed at http://www.columbia.edu/cu/biology/faculty/chasin/ESRseq/). This result is not so surprising, since the SELEX-based methods yield only the best performers and the computationally derived sequences have been predicted with great conservatism (low P-value cutoffs) due to high noise and the desire to maximize validation.
We also examined a set of 58 human mutations known to affect splicing (Zhang and Chasin 2004): 83% could be explained by a change in an ESRseq score in the predicted direction, compared with 33% for 39 mutations not affecting splicing and 51% for a random simulation of point mutations (Supplemental Table 9; Supplemental Fig. 6). Finally, we applied ESRseq scores to the extensive data of Goren et al. (2006), who proposed a positional effect to explain consistent differences in splicing caused by the substitution of 7-mers throughout an exon. We found that 78% (14/18) of these changes could be explained by changes in ESRseq scores of 6-mers created in sequences that overlapped the substitution (Supplemental Table 10).
Overlapping elements represent a major context effect here and, by extension, in any consideration of the effect of an RNA sequence change on function. By taking overlaps into account, we greatly improved the assessment of the effect of 6-mers on splicing. According to the experiment shown in Figure 4D (R2 = 0.71), the overlap effects explain ∼70% of the variance in observed splicing behavior. The remaining 30% is likely due to context effects other than overlaps such as proximity to a splice site, secondary structure, and combination with other splicing regulatory sequences considered below.
6-mers exhibiting positional bias
Splicing regulatory factors (e.g., SR proteins and hnRNPs) may participate differentially in the recognition of 3′SSs and 5′SSs. Such selectivity could give rise to a positional bias for proximity to one or the other splice site. We searched for such specificity by extracting 6-mers that exhibited differential effects, depending on whether they were close to the 3′SS (HA location) or close to the 5′SS (HD location) in the long (223 nt) Hb2 exon (Fig. 6A).
Figure 6.

Detection of 6-mers exhibiting positional bias. (A) Scatter plot of 6-mer LEIscs in the HA and HD contexts. Six-mers eliciting LEIsc values that were significantly (FDR = 1%) higher in the HA context are blue and those significantly higher in the HD context are red. (B) HA context preferred motifs (blue in A) are more highly enriched in the exonic region closer to the 3′SS in human constitutive exons. The average 6-mer density in the four regions (−100 nt to −51 nt in the upstream intron, +2 nt to +50 nt the exon body, −50 nt to −4 nt in the exon body, and +51 nt to +100 in the downstream intron) was set equal to one and other values adjusted accordingly. (C) HD context preferred motifs (red in A) are more highly enriched in the exonic region closer to the 5′SS. The data are presented as in B. (D) HD context preferred motifs resembling 9G8 binding sites are more highly enriched in the exonic region closer to the 5′SS in human constitutive exons. (E) HD context preferred motifs resembling PTB binding sites are less depleted in the exonic region closer to the 5′SS. (*) P < 3 × 10⁻¹³; (**) P < 2 × 10⁻¹⁶; (***) P < 3 × 10−40 (t-test). Error bars, SEM.
We then tested the generality of these differences by mapping these 6-mers to human constitutive exons. Six-mers that preferentially affect the HA compared with the HD location (Fig. 6A, blue points) were enriched in exonic regions closer to the 3′SS in constitutive human exons (Fig. 6B), while those that preferentially affect the HD location (Fig. 6A, red points) were enriched in exonic regions closer to the 5′SS (Fig. 6C). Interestingly, we found that the 6-mers resembling ASF/SF2, PTB, and 9G8 binding sites were preferentially active at the HD location, i.e., at the downstream end of the Hb2 exon (Supplemental Table 8B). This positional bias could be due either to interactions with other features of the Hb2 exon or to proximity to the 5′SS. A check of the genomic distribution of these 6-mers in human constitutive exons showed that: (1) The 9G8 sequences are preferentially enriched near the 5′SS, supporting the idea of an interaction with factors specific for the 5′SS (Fig. 6D); (2) the PTB sequences were preferentially depleted near the 3′SS, in agreement with the finding that PTB acts to silence the 3′SS (Fig. 6E; Llorian et al. 2010); and (3) the ASF/SF2 sequences showed no preferential exonic location, suggesting that they may act in Hb2 in conjunction with some other fixed exonic motif (s).
When a library was placed at the WD location we noticed the minor (∼10%) use of a downstream (“proximal” relative to the intron) cryptic 5′SS (Supplemental Fig. 7A). Sequencing this minor class of molecules allowed us to define 6-mers that tended to either enhance or silence the use of the cryptic site (blue and red points, respectively, in Supplemental Fig. 7B). Six-mers that exhibited a significantly higher use of the wild-type 5′SS were found to be enriched in the region upstream of the 5′SS in human constitutive exons (Supplemental Fig. 7C). Accordingly, 6-mers that exhibited a lower use of the wild-type 5′SS were found to be depleted in this region (Supplemental Fig. 7D). The latter could be a candidate for silencers that encourage the use of an alternative splice site.
Effects of 6-mer substitutions on RNA secondary structure
RNA secondary structure has been shown to influence splicing in many individual cases (Buratti and Baralle 2004) and may act in general by keeping many splicing elements single stranded to allow the binding of protein factors. In support of this idea Hiller et al. (2007) found that predicted ESE sequences in human exons tend to remain single stranded. The system described here provides an unprecedented opportunity to tie observed splicing efficiencies to computationally calculated secondary structures in thousands of RNA molecules that differ only in a prescribed 6-base region. We applied the method of Hiller et al. (2007) to calculate the predicted single-stranded state of ESRseqs in all five locations. We found that for four of the five locations ESEseqs have a higher probability of being unpaired (PU) when present in transcripts with enhanced splicing as opposed to those exhibiting average splicing, and which were matched for G+C content (Fig. 7A,B). ESSseqs also have a higher PU when present in transcripts with silenced splicing as opposed to average splicing (Fig. 7C). These results suggest that many of these splicing regulatory elements, both positive and negative, act through the binding of factors that require accessible single-stranded sequences. We then asked whether the single-stranded state of the splice sites (SSs) could be influenced by the substitution of a nearby 6-mer. For the 3′SS, both the WA and HA locations could be analyzed as they are close enough to a 3′SS splice site to be within the local folding range used in the Hiller et al. (2007) method (a maximum total window size of 66 nt centered on the 6-mer; see Methods). At both locations, we found that 3′SSs have a higher PU in transcripts with enhanced splicing and a lower PU in transcripts with silenced splicing compared with transcripts with average splicing (Fig. 7E). This finding suggests that occlusion of the 3′SS in a double-stranded structure dampens its activity, most likely by preventing access to spliceosomal and related factors. We tested the generality of this idea by comparing the PU of 3′SSs in large databases of human constitutive exons versus pseudo exons; PU values are indeed higher for the real exons (Fig. 7E, right). For the 5′SS, only the WD location lies within the local folding range. Surprisingly, we found that 5′SSs have a lower PU in transcripts with enhanced splicing than in transcripts with average splicing (Fig. 7F). This finding, opposite to that found for the 3′SSs, was supported by a genomic analysis that showed that 5′SSs in constitutive exons have a lower PU than 5′SSs in pseudo exons (Fig. 7F, right). It is tempting to speculate that this bias toward a double-stranded state is related to the finding that U1C in U1 snRNP is bound to duplexed RNA in the crystal structure (Pomeranz Krummel et al. 2009).
Figure 7.

Secondary structure effects of 6-mer substitution. (A) Maps for B and C. (B) Effective ESEseqs tend to be single stranded. Single strandedness of ESEseqs was measured by the probability of being unpaired (PU) (Hiller et al. 2007). (Filled bars) All ESEseqs in the 16-nt region of the top scoring 400 transcripts; (open bars) all ESEseqs in the 16-nt region drawn from the middle scoring 1000 transcripts, as G+C–matched controls. The mean PU of each control was set to unity. (C) Effective ESSseqs tend to be single stranded. As in B except that filled bars show all ESSseqs in the 16-nt region of the bottom scoring 400 transcripts. (D) Maps for E and F. (E) The 3′ splice site (SS) tends to be single stranded in high-scoring transcripts. This analysis was restricted to locations WA and HA, where the substitution is close enough to the 3′SS (−14/+1) to influence local folding. T400 (set1): comparison of highly spliced transcripts with controls (set2) as in B. B400 (set1): comparison of poorly spliced transcripts with controls (set2) as in C. Bars on right: average PU of the 3′SS from constitutive exons (filled) and G+C–matched pseudo exons (open). (F) The 5′SS tends to be double stranded in high-scoring transcripts. This analysis was restricted to location WD, which is close enough to the 5′SS (−3/+6) to influence local folding. Data is presented as in E. Bars on right: average PU of the 5′SS from constitutive exons (filled) and G+C–matched pseudo exons (open). (*) P < 5 × 10⁻²; (**) P < 10−2; (***) P < 10−3; (****) P < 10−4 (t-test). Error bars, SEM. See Methods for details.
6-mers that may have combinatorial requirements
Combinatorial effects among motifs could play a role in explaining the remaining 30% of the variance where the additivity of the model does not hold. If a motif was positively or negatively synergistic with another within the 16-nt summed region, then the observed splicing would be significantly higher or lower than predicted, respectively. Such synergies could result from interactions among factors binding within this region or from competition for overlapping binding sites. Using this definition we identified 232 motifs that could form positive synergies and 262 motifs that could form negative synergies (P-value <0.05, t-test; FDRs of 17.7% and 15.6%, respectively, listed in Supplemental Table 11) (for examples, see Fig. 8A,B). Similar results were obtained using a Kolmogorov-Smirnov (K-S) test. Many of these motifs resemble the binding sites of the known splicing factors ASF, 9G8, SRp30c, and hnRNPs A1/A2, K, M, L, and F/H (Fig. 8C,D). All of the splicing factors mentioned are abundantly expressed in the HEK293 cell line based on microarray data. Splicing factors binding within the 16-nt substitution region could also be interacting with factors that bind outside of the substituted region, either elsewhere in the exon or in the introns. Such synergistic effects could be effective at one location but not at another, and so result in a high variance, a misclassification as a neutral rather than an ESRseq, and a failure to be accurately predicted by the additive model. Saturation mutagenesis experiments using a similar high-throughput sequencing approach should allow us to identify the partnering sequences in these putative synergic pairs, both beyond the 16-nt substitution region and within it.
Figure 8.

Six-mers that are candidates for combinatorial requirements. The hypothesis here is that the target 6-mer is influenced by a partner sequence within the 16-nt summed region, leading to a deviation from the additive model. (A) One example of a 6-mer (AGAAGA) that may have positive synergy with another within the 16-nt summed region. In the case of positive synergy, the observed splicing strength (LEIsc) would be significantly higher than that predicted whenever AGAAGA is present in the 16-nt region. The predicted LEIscs were converted from the splicing strength predicted by the additive model shown in Figure 4D by linearly scaling the values to fit the scale of the observed LEIscs. The total 20,480 molecules were classified into two categories: those in which this 6-mer was absent and those in which it was present. The average of (observed LEIsc—predicted LEIsc) in each category is shown. P-values were calculated using a t-test. Error bars are the SEM. (B) One example of a 6-mer (TCCCTC) that may have negative synergy with another within the 16-nt summed region. In this case, the observed splicing strength (LEIsc) would be significantly lower than that predicted whenever TCCCTC is present. P-values were calculated using a t-test. Error bars are the SEM. (C) Clusters of 6-mers that may have positive synergy with others and resemble the binding sites of known splicing factors. (D) Clusters of 6-mers that may have negative synergy with others and resemble the binding sites of known splicing factors.
A possible influence of chromatin
Several recent studies have reported that exons are associated with greater nucleosome densities and distinctive histone modifications and that perturbation of histone modification can affect alternative splicing (Andersson et al. 2009; Schwartz et al. 2009; Spies et al. 2009; Tilgner et al. 2009; Luco et al. 2010). It is possible that some of the 6-mers act as ESEs by promoting nucleosome assembly or positioning at the test exon and vice versa. The data from all five locations consistently showed a good correspondence between LEIsc values and predicted nucleosome occupancy scores as described by Kaplan et al. (2009), leaving open the possibility that chromatin structure is playing a role in the splicing enhancement seen here (Fig. 9A–E).
Figure 9.

LEIscs are positively correlated with their predicted nucleosome occupancy scores. The full set of 4096 6-mers were divided into 64 groups of 64 ranked by their LEIscs values at a particular location (the first group of 6-mers represents those with the highest LEIscs). Nucleosome positioning scores of 6-mers were extracted from the data as measured by sequencing 150-mers described by Kaplan et al. (2009) and found at http://genie.weizmann.ac.il/pubs/nucleosomes08/nucleosomes08_data.html. The average nucleosome occupancy score of the 64 6-mers in each set was used for each bin. Pearson's correlation coefficient and the P-value (F test) were calculated from the unbinned data and are shown for each indicated location. Note that a rank of 1 represents the highest LEIsc value.(A) WA location; (B) WD location; (C) HA location; (D) HM location; (E) HD location.
Summary
The high-throughput mutational results reported here show that context is a dominating factor in the effect of a splicing motif. A major source of this context effect lies in the nature of the nucleotides that flank any sequence under consideration. Proximity to splice sites, RNA secondary structure, and combinatorial effects of splicing motifs all appear to play a role in defining context. Future high-throughput mutational analyses will provide a sharper definition of these roles.
Although we have carried out considerable genomic analysis of this data, we need to emphasize that the QUEPASA method described here is genetic, not genomic. In one sense it is a classical approach, studying the effect of genotypic perturbation (i.e., mutation) on phenotype. It differs from classical genetics mainly in its high-throughput nature, allowing a complete definition of a mutational class. In this case, that class can be seen as approximating the binding sites of proteins that regulate splicing. However, the approach can be extended to many more biological questions, the main limitation being the ability to select for numerous examples of a phenotype of interest. These questions include any process dependent on a nucleic acid sequence, including the production of proteins.
Methods
Design of the linear minigene library
A diagram of the minigene library is depicted in Figure 1A. The framework contains a minigene consisting of a CMV-based tet-off promoter (Gossen and Bujard 1992), exon 1 of the hamster Dhfr gene mutated to contain no start codons, an intron derived from Dhfr introns 1 and 3, and a second exon made up of merged Dhfr exons 4–6 terminated by the SV40 late poly(A) site. The expression of this minigene requires the tTA transcription activator protein, which is provided by transfecting HEK293tTA cells carrying an integrated copy of the tTA gene. A plasmid carrying this framework and this host cell line were constructed by Mauricio Arias and will be described elsewhere.
We inserted a central exon into the intron of this framework to form a three-exon minigene construct. The Wilm's tumor gene 1 exon 5 (WT1–5, 51 bp) and the human globin gene exon 2 (Hb2, 223 bp) were chosen as central exons to carry the random 6-mer library at different positions: for WT1-5, two positions designated WA and WD, where A and D denote proximity to the 3′SS (acceptor) and 5′SS (donor), respectively; and for Hb2, three positions HA, HM, and HD, where M denotes a middle position. The five exon positions were chosen because point mutations at these positions affect exon inclusion substantially (Zhang et al. 2005a). Thus, 6-mers placed at these locations should be effective in influencing splicing. The WT1-5 exon also carries a T-to-A mutation at position +23 for past cloning purposes. The starting positions of the substitutions in the five locations relative to the start of the exon were: WA, +5; WD, +35; HA, +19; HM, +105; and HD, +192.
The deprivation of the natural intronic flanks of these wild-type exons reduced their inclusion to 6% for WT1-5 and 2% for Hb2. The dynamic range for detecting low levels of inclusion is great in these experiments, as we are measuring splicing efficiencies digitally rather than by using band intensities on gels (e.g., Mereau et al. 2009). For instance, a silencer may yield two output counts with 200 input counts, and an enhancer may yield 2000 output counts with 200 input counts (>90% of the 20,480 measurements had ≥200 input counts, >99.6% had ≥10 input counts, and there was no 6-mer that is represented less than 10 times in more than one of the five locations). Thus, the dynamic range is about 1000-fold here, allowing us to detect more than an order of magnitude enhancements or silencings relative to the wild-type values of 2% and 6%. However, the “wild type” may have little special significance here: In a sense, the wild type is just one of the 4096 6-mers in exons that are being used as a framework for evaluating the effects of RNA sequence on splicing. The overall inclusion levels of the libraries varied from 1% to 16% depending on the specific location.
Construction of the linear minigene library by overlapping PCR
The first step in this method was library construction, and it required dealing with several superventions. We initially attempted to create the input minigene library as a large population of plasmids cloned in E. coli. Despite what should have been adequate coverage (as judged from the number of drug-resistant transformant colonies) and a minimal growth period following transformation, these libraries proved totally inadequate as they were comprised of only a fraction of the expected panoply of all possible sequences. This E. coli bias problem was solved by using PCR to create the minigene library, keeping all manipulations at the molecular level. When transfected into HEK293 cells these ∼3-kb linear DNA molecules were expressed and their transcripts spliced at efficiencies similar to plasmids. Importantly, they yielded representation of all k-mer sequences. Second, library construction using PCR primers with a tail harboring random 6-mers and a wild-type gene as a template produced a large excess of sequences corresponding to those library members that happened to be complementary to the template. These offenders could be greatly reduced by using templates prepared so as to physically lack the targeted 6-mer region (Fig. 1C). Third, to eliminate a residual over-representation of 6-mers corresponding to the template sequence it was necessary to carry out the electrophoretic purification of templates using a gel that contained no other nucleic acid molecules in neighboring lanes. These improvements resulted in a minigene library with the expected bell-shaped distribution of k-mer coverage (Fig. 1D). The overall layout of the minigene library construction is shown in Figure 1C. The first fragment of the library, with a length of ∼1 kb, was generated by PCR with primers 1 and 2; the latter contains the random library (Operon). The second fragment of the library, with a length of ∼2 kb, was produced by PCR using primers 3 and 4. Each fragment was gel purified separately in a solitary lane of a gel chamber with no other nucleic acid molecules applied. The full-length 3-kb minigene library was generated by a subsequent overlapping PCR step using primers 1 and 4, and the first and second fragments, simultaneously. The library was then gel-purified to eliminate the remaining templates and primers and used for the transient transfection of HEK293tTA cells. A mixture of 25:1 (v/v) of RedTaq ReadyMix (Sigma) to Native Pfu DNA polymerase (Stratagene) was used for PCR. Primer sequences are available upon request.
Transfection and RNA extraction
HEK293tTA cells cultured in two 100-mm dishes per independent transfection (∼4 × 10⁶ cells total) were transfected with 2.5 μg of the minigene DNA library per 100-mm dish, using Lipofectamine 2000 (Invitrogen) following the manufacturer's protocol. After cells were incubated for 24 h, total RNA was extracted and purified using illustra RNAspin Mini Kits (GE Healthcare). A sample of 2 μg of RNA was reverse transcribed (RT) using Omniscript (Qiagen) and a specific primer, AGAGTCTGAGATGGCCTGGCT, which pairs with a region in the third exon. RT product (40 μL, 80% of the total RT reaction) was used as the template in the following PCR amplification using the same enzyme mixture mentioned above: forward primer, GTCAGATCCGCCTCCGCGTA (targeting a region near the start of exon1); reverse primer, GTAAACGGAACTGCCTCCAA (targeting a region in the third exon; initial denaturation, 94° for 2 min; denaturation, 94°, 45 sec; annealing, 60°, 1 min; extension, 72°, 1 min; 20 cycles; final extension, 72°, 5 min). Splicing products were separated in 1.8% agarose gels stained with SYBR Safe (Invitrogen). The included splicing product was identified by its size, gel purified, and resuspended in Qiagen elution buffer (EB).
PCR of the DNA input and RNA output libraries for deep sequencing
The overall scheme for the WA location is shown at the bottom of Figure 1C. For PCR of the DNA input library, the template was the linear minigene DNA library suspended in EB, the same DNA library used for in vivo transfection. The upstream primer (primer 5 in Fig. 1C) contained the standard Illumina adapter sequence, followed by a sequence complementary to positions −119 to −100 in Dhfr intron 1; the downstream primer contained (5′–3′) the Illumina adapter sequence, the Illumina sequencing primer template, a CG or a TA barcode tag, and a sequence corresponding to positions +30 to +11 in WT1 exon 5. Two separate primers with the distinct barcodes (CG or TA) were used to amplify the DNA input library to produce two duplicate samples of this library. For PCR of the output cDNA library, the template was the included splicing PCR product suspended in EB; the two primers (6 and 7) were the same as for the input DNA library, except that the upstream primer ended with a sequence corresponding to positions −105 to −86 in exon 1. Two separate primer 6 sequences with barcodes (CG or TA) were used in amplifying the two distinct RNA output libraries from independent transfections. The resulting PCR products were gel purified to remove the remaining template and PCR primers and resuspended in EB for deep sequencing. Note that no ligations were necessary in this scheme, as we could use primers specific to the constant regions of the genes and products being analyzed. For the other four locations, the same design was adopted. Details are available upon request.
High-throughput sequencing
The PCR products of the DNA input library with distinct barcodes (CG and TA) were mixed and sequenced in a single channel on an Illumina GA II. The standard sequencing primer starts DNA synthesis at the 2-nt barcode and proceeds through a 20-nt upstream constant region, the 6-nt random library region, and an 8-nt downstream constant region, for a total sequencing length of 36 nt. The PCR products of the RNA output library with distinct barcodes (CG and TA) were pooled and sequenced similarly in a single channel. DNA samples were checked for purity using an Agilent 2100 Bioanalyzer and quantified using a Qubit fluorimeter.
Analysis of sequenced reads
High-quality 6-mer sequences were obtained by subjecting the raw sequence reads to three filters. The first filter was a sequence check for the 2-nt barcode; only sequences with either a TA or CG were allowed. The second filter was a sequence check of the 20-nt upstream and 8-nt downstream constant regions; only sequences with perfect matches to both were kept. The third filter was a quality check of the library 6-mer estimated from the Illumina sequence quality code provided in the raw sequencing output (probability of a correct read); the product of the quality scores for the six positions had to be at least 0.9. About half of the total reads passed all three filters.
For the WA location, the DNA input library yielded 3,657,452 qualified 6-mers; the qualified reads for the TA and CG barcodes were 1,827,226 and 1,830,226, respectively. The RNA output library yielded 3,943,635 qualified 6-mers; the qualified reads for the TA and CG barcodes were 2,481,757 and 1,461,878, respectively, for the two transfections. In the DNA input library, the minimum count for a 6-mer was two and the maximum and median counts were 2765 and 890, respectively. Therefore, our DNA input library covers all 4096 6-mers, and for every 6-mer we can calculate its input proportion and Enrichment Index (EI, output proportion/input proportion). Very few input counts were low enough to produce possible high fluctuations (less than six had less than 10 reads). We decided to include all of the data for most analyses, but in some cases we did not use those data produced by low-input counts, as noted. In the RNA output library the minimum count for a 6-mer was 0 and the maximum and median were 8542 and 448, respectively. Figure 1D shows the 6-mer distributions of the DNA input and RNA output libraries. Similar results were obtained for the other four locations.
EI, LEI, and LEIsc calculation
In QUEPASA, an Enrichment Index (EI) for a 6-mer is defined as its output proportion divided by its input proportion. Because all of the 4096 6-mers were covered in the input DNA library, we could calculate an EI for every 6-mer. From the derivation shown in the Methods section we know that for a particular 6-mer its proportion of inclusion PSIA is equal to EIA times PSIL, the overall proportion of inclusion for the whole library. So, EIA = PSIA/PSIL, and for the WA library PSIL, was measured to be ∼16% based on band intensities after RT–PCR. Since the maximum value for PSIA is 100%, the maximum value for EIA is about 100/16 = 6.25. Indeed, the EIs of almost all 6-mers (99.8%) were <6.25. The 10 6-mers that had EI values greater than 6.25 all had relatively low numbers of input DNA library.
About 1% of the 4096 6-mers yielded no counts in the RNA output libraries and, therefore, EI values of zero; the proportions of these zero counts were 1.4%, 2.0%, 0.0%, 1.0%, and 0.5% for the WA, WD, HA, HM, and HD locations, respectively. In these cases, a pseudo count of 1 was assigned to avoid the generation of values of infinity in the transformation of an EI to a log2EI. The introduction of this pseudo count also allows an estimate of the upper limit on the EIs that generated zero output counts, and this limit will be affected by the corresponding input values. For example, AAGCTA has a zero output for the WA location, an input of 1358, and an approximate upper limit of 0.0007, while for AGAGGG in WA, the corresponding values are 0, 76, and 0.013. Although their numerical assignments are only approximate in these cases, these 6-mers represent an important part of the data, as their lack of representation in the output is an indicator of strong silencing.
Zeros or very low numbers of input 6-mers, on the other hand, represent a limitation in this analysis, as they preclude a conclusion. Zero cases were very rare (nine of 20,480 measurements) and even outcomes with less than 10 input counts were infrequent (81 of 20,480, or 0.4%). However, even in these cases the low inputs did not greatly affect the scores we assigned to each 6-mer, since these scores (ESRseq scores, see below) were based on the combined effects at five locations, and in no case was there more than one low input count among the five.
The LEI distribution of all 4096 6-mers is shown in Figure 1G. To compare 6-mer performances from different locations, these LEI values were scaled so that the median was set to 0 and the range from −1 to +1 captured 95% of the 6-mers (termed LEIsc). The same strategy was applied to the other four locations,.
Validation of individual sequences
We calculated an inferred proportion of central exon inclusion (PSIA, percent spliced in for molecule A) in these experiments as follows. If
IA% is the proportion of molecule A in the input library and
OA% is the proportion of molecule A in the output library.
Then the enrichment index of A is
Let T = the total number of pre-mRNA molecules produced by the input library and
PSIL = the PSI of the library as a whole. Then,
IA% × T = the number of pre-mRNAA molecules produced,
IA% × T × PSIA = the number of mRNAA molecules with an included central exon, and
T × PSIL = the total number of mRNA molecules with an included central exon.
Therefore,
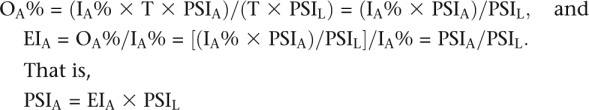 |
EIA was observed in the sequencing data and PSIL was estimated from the relative intensities of the included and skipped PCR product bands after RT–PCR of the RNA from the transfected cells.
Fifty 6-mer sequences, the EIs of which cover the entire range of values observed at each location, were chosen to validate the idea that their EIs reflect their quantitative splicing efficiencies (14 6-mers for the WA location, nine each for the remaining four locations). Each of the 50 6-mers was cloned into the random library position of the corresponding 3-kb linear minigene construct. HEK293tTA cells cultured in 35-mm dishes were transfected as described above, except splicing products were stained with ethidium bromide. The intensity of each splicing product was quantified with ImageJ. At least two independent transfections were performed for each construct. Proportion included (I) was defined as included product/(skipped product + included product) in relative molar quantities.
Genome-wide sequence analysis
To collect human constitutive and alternative exons, human mRNA sequences and ESTs were downloaded from the UniGene database (ftp://ftp.ncbi.nih.gov/repository/UniGene/Homo_sapiens/Hs.seq.all.gz) and were aligned to the assembled genomic sequences (hg18) obtained from ftp://ftp.ncbi.nih.gov/genomes/H_sapiens/ using Sim4. Only ESTs that spanned at least two exon–exon junctions were used. Genes that exhibited no intron–exon junctions were excluded. Exons with no evidence of skipping or alternative splice site use were identified as constitutive exons. An exon that was excluded in one or more transcripts and present in at least one transcript was defined as an alternative cassette exon. Only exons flanked by canonical AG and GT dinucleotides were included. Pseudo exons were defined as intronic sequences having lengths between 50 and 250 nt and consensus values of ≥75 for 3′ splice sites and ≥78 for 5′ splice sites. The consensus values (CV) were based on a position-specific weight matrix and were calculated essentially according to Shapiro and Senapathy (1987). In addition, pseudo exons had to be at least 100 nt away from the closest real exon.
For genome-wide 6-mer density analysis in Figure 5 and Supplemental Figure 2, the exon lengths of human constitutive exons and alternative cassette exons were required to be at least 50 nt and the lengths of both flanking introns to be at least 100 nt. The total numbers of qualified constitutive exons and alternative cassette exons were 119,006 and 25,807, and the total number of pseudo exons (repeat-free) was 134,994. For a composite exon body, we extracted 50 nt from each end of each exon. For the two composite flanking introns, we extracted the 86-nt upstream and 94-nt downstream intronic sequences (excluding the 3′ and 5′ splice-site sequences). The 6-mers were enumerated starting at the borders of the splice-site sequences (−14 to +1 for the 3′SS and −3 to +6 for the 5′SS).
To measure the association of exonic LEIsc values and CV scores presented in Supplemental Figure 2, P–T, an average LEIsc per nucleotide was calculated by averaging the LEIscs of 6-mers at each nucleotide position of the exon body for each constitutive exon; 6-mers that overlapped with the splice-site sequences (+1 and −3 to −1) were excluded. All of the constitutive exons were ranked by their average LEIsc per nucleotide, and then were separated evenly into two groups: a top half with higher LEIsc values per nucleotide and a bottom half with lower LEIsc values per nucleotide. A random set of 5000 exons was selected from the top set, and then 5000 exons from the bottom set were randomly chosen to exactly match the G+C content of each exon in the top set. The G+C contents of the exons of the two sets were exactly matched so as to minimize the influence of base composition on any correlations seen. For instance, regions high in G+C content will tend to be associated with splice sites that are high in G+C content, which in turn are associated with poorer splice-site consensus scores. The consensus values of 3′ and 5′ splice sites were calculated essentially according to Shapiro and Senapathy (1987). For the scoring of exons in Figure 5F, an average ESRseq score per nucleotide was calculated by averaging the ESEseq and ESSseq scores for 6-mers at each nucleotide position of the exon body for each constitutive exon, alternative cassette exon, and pseudo exon. Note that 6-mers that did not meet the criterion to be classified as ESRseqs were given an ESRseq score of zero.
ESRseq scores, the additive predictive model and the combinatorial effects analysis
To calculate an ESRseq score for a 6-mer, we first collected the LEIsc values from all pre-mRNA molecules that contained it anywhere within the 16-nt region. We then calculated the average of these LEIsc values and used a t-test to compare it with the average of the LEIsc values of molecules that did not contain the 6-mer. This latter value is always close to zero since it is comprised of almost all of the 20,480 (5 × 4096) molecules considered. If a 6-mer had a significantly higher average LEIsc value (P < 0.05, t-test) it was viewed as a splicing enhancer (“ESEseq”, e.g., GACGTC) (Fig. 4C) and we defined its ESEseq score as the difference between the averages of the two categories described above (present vs. absent). ESSseq scores were defined similarly for 6-mers that had a significantly lower average LEIsc value (e.g., CCAGCA in Fig, 4C). The term “ESRseq” refers to the above two categories as a group. The 6-mers that showed no significant differences have been provisionally regarded as neutral (e.g., AAAGAG, Fig. 4C). Failure to achieve this P-value cutoff depends on two factors: the variance among the results from the five different locations and the magnitude of the effect on splicing. In this way, we defined 1182 ESEseqs (FDR = 17.3%) and 1090 ESSseqs (FDR = 18.8%). Similar results were obtained by a Kolmogorov-Smirnov (K-S) test. The two samples t-test and Kolmogorov-Smirnov (K-S) tests were performed using the R t.test and ks.test functions, respectively. The regression analysis for the comparison between LEIsc values and the splicing strength predicted by the model (Fig. 4D) was carried out using the R glm function, and the significance of the correlation was assessed by the F statistic computed by the glm function. The additive model constructed to calculate the net effect of ESRseqs in a given pre-mRNA molecule is:
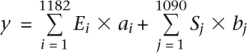 |
where Ei and Sj are ESEseq and ESSseq scores, respectively; ai and bj are the occurrences of the corresponding 6-mers within all 11 overlapping 6-mers; and y is the predicted splicing strength of the pre-mRNA molecule.
For detecting 6-mers that are candidates for combinatorial requirements, the hypothesis is that the candidate 6-mer is influenced by a partner sequence within the 16-nt summed region, leading to a deviation from the additive model. In the case of positive synergy, the observed splicing strength (LEIsc) would be significantly higher than that predicted when the candidate 6-mer is present anywhere in the 16-nt region. In the case of negative synergy, the observed splicing strength (LEIsc) would be significantly lower than that predicted when the candidate 6-mer is present. The predicted LEIscs were converted from the splicing strength predicted by the additive model shown above by linearly scaling the predicted values to fit the scale of the observed LEIscs. P-values were calculated using a t-test.
Conservation analysis of ESRseqs
Based on the coordinates of the human exons, orthologous macaque exons were extracted from a 17-genome multialignment (http://hgdownload.cse.ucsc.edu/goldenPath/hg17/multiz17way/). In this way we were able to survey a total of 59,221 constitutive exon pairs of equal lengths (no alignment gaps). Proportion of conservation was defined as the proportion of 6-mers existing in human exons that were also present at the same position in orthologous macaque exons. Human SNP data were downloaded from dbSNP Build 130. SNPs that mapped to multiple genomic regions or known repetitive elements were excluded. Proportion of SNP density was defined as the proportion of 6-mers that contained at least one SNP when they appeared in human exons.
Detection of 6-mers with positional bias
The data from the HA and HD locations were compared. To lower the sampling noise and get an accurate estimate of the intragroup and intergroup variances of splicing behavior for each 6-mer, all transcripts considered for the HA and HD pairwise comparison were required to have at least 50 reads for each input barcode for the two locations (3791 of 4096 were kept). All transcripts considered for the wild-type 5′SS and downstream cryptic 5′SS pairwise usage comparison had at least 50 counts in each input barcode at the WD position (4029 out of 4096 were kept). The LEIsc values for each 6-mer were calculated separately for each output barcode considering all 11 overlapping 6-mers created by the library substitution (each output barcode represents one independent transfection). For the measured splicing behavior of each 6-mer (LEIsc value), the intergroup variance (between HA and HD locations or between two 5′SS usages) was compared with the intragroup variance by a modified t-test (Tusher et al. 2001), and a false discovery rate (FDR) for selecting 6-mers with significantly different splicing behavior was calculated according to the Benjamini-Hochberg method (Benjamini and Hochberg 1995).
RNA secondary structure analysis
The method described by Hiller et al. (2007) was used, which here consisted of calculating the predicted folding free energy of 20 windows of increasing size (28–66 nt) centered on a 6-mer. Folding was calculated allowing or disallowing pairing of the 6-mer bases and the energy differences were converted to pairing probabilities (PU, the probability of being unpaired). The average of the 20 PU values was assigned to each 6-mer.
We asked whether ESEseqs that promote the splicing of a transcript are found in regions of different secondary structure than ESEseqs that do not (Fig. 7B). We compared two sets of ESEseqs: set 1, all ESEseqs (as defined in the section “Effect of context created by overlapping 6-mers” in the text, 1182 in total) residing in transcripts with high LEIsc values (top 400) and set 2, all ESEseqs residing in transcripts drawn from those with average LEIsc values (middle 1000). These ESEseqs could be located anywhere within the 16-nt region defined by positions overlapping the substituted 6-mer. Since G+C content is a major determinant of RNA secondary structure, these two sets were matched for G+C content at two levels (as illustrated in Fig. 7A). First, on a one-to-one basis, each 6-mer substitution in set 2 was chosen so as to match the G+C content of a 6-mer substitution in set 1. Second, on a one-to-one basis, each ESEseq in set 2 had to match the G+C content of an ESEseq in set 1. In this way both sets contained the same distribution of molecules with respect to G+C content in the region being locally folded. PU values were then calculated for each set; each of the five substitution locations was analyzed separately (i.e., the matching took place only within a location). In each case, the mean PU of set 2 was set equal to unity for comparison. The actual PUs for ESEseqs in set 2 (Fig. 7B) were: 0.037 for WA, 0.075 for WD, 0.057 for HA, 0.099 for HM, and 0.062 for HD.
To ask whether ESSseqs that silence splicing are found in regions of different secondary structure from ESSseqs that do not (Fig. 7C), we compared two sets of ESSseqs, exactly as described above for ESEseqs, except that transcripts with low LEIsc values (bottom 400) were chosen for set 1; each of the five substitution locations was analyzed separately (i.e., the matching took place only within a location). Once again, the mean PU of set 2 was set equal to unity for comparison. The actual PUs for ESSseqs in set 2 (Fig. 7C) were 0.071 for WA, 0.126 for WD, 0.156 for HA, 0.120 for HM, and 0.053 for HD.
We asked whether the single strandedness of 3′SSs differed in substituted transcripts that had been induced to splice well compared with those with just average splicing. This analysis was restricted to locations WA and HA, which are close enough to the 3′SS to allow testing the effect of local folding. The PU of a 3′SS (the 15 nt from −14 to +1) was calculated as the average of the PUs of the 10 6-mers within it, and each calculated using the series of windows ranging from 28 to 66 nt; and the substituted 6-mer library position is required to be within the folding windows ranges considered. Two sets of transcripts were chosen for comparison: Set 1 was comprised of molecules with the top 400 LEIsc values (T400) and set 2 molecules were randomly drawn from transcripts with average LEIsc values (middle 1000). On a one-to-one basis, each 6-mer substitution chosen for set 2 had to match the G+C content of a 6-mer substitution in set 1 (Fig. 7D). The mean PU of set 2 was set equal to unity for comparison (Fig. 7E). The same procedure was used for transcripts comprising the bottom 400 LEIsc values (B400). The actual PUs for the 3′SSs in set 2 were 0.283 for WA T400, 0.528 for HA T400, 0.244 for WA B400, and 0.579 for HA B400. The single strandedness of 3′SSs was also examined in human constitutive exons compared with pseudo exons. Here, 5000 exons of each kind were randomly chosen while matching the G+C-content of the 3′SS region from −44 to +31 (75 nt). The mean PU of the pseudo exons (0.180) was set equal to unity for comparison in Figure 7E.
The single-strandedness of 5′SSs was measured analogously. This analysis was restricted to location WD, which is close enough to the 5′SS to allow testing the effect of local folding. The PU of a 5′SS (9 nt from −3 to +6) was calculated as the average of the PUs of the four 6-mers within it, and each calculated using the series of windows ranging from 28 to 66 nt; the substituted 6-mer library position is required to be within the folding windows ranges considered. Two sets of transcripts were chosen for comparison exactly as for the 3′SS (as illustrated in Fig. 7D). The PUs for the 5′SSs in set 2 were set equal to unity for comparisons (Fig. 7F) and were actually 0.179 for WD T400 and 0.169 for WD B400. The state of 5′SSs in constitutive exons was carried out as described above for 3′Sss, except matching the G+C-content of the 5′SS region was from −33 to +36 (69 nt). The mean PU of the pseudo exons (0.111) was also set equal to unity for comparison.
The predicted nucleosome occupancy of 6-mers
To evaluate the potential of 6-mers to influence nucleosome positioning, we used the data of Kaplan et al. (2009) who assembled tens of thousands of competing synthetic ∼150-mers into nucleosomes in vitro using purified chicken histones. Each 150-mer was assigned a score based on its relative abundance in the assembled nucleosomes. As done for 5-mers by these investigators, all 6-mers were extracted from these 150-mers and each was assigned the relative assembly score attached to the 150-mer in which it resided. The average score of each 6-mer across ∼27,000 oligomers was calculated, and these values were normalized to a mean of zero by subtracting the mean of all 6-mers from each individual 6-mer value and then normalizing to a maximum of +1 and a minimum of −1, as was done by Kaplan et al. (2009). Finally, these values were used to calculate an average predicted nucleosome occupancy score for the 6-mers in each set of 64 that were binned on the basis of decreasing average LEIsc to provide the data shown in Figure 9.
Analysis of reported splicing mutations
Exonic mutations that have been reported to affect splicing, mostly in the HPRT gene, were taken from Zhang and Chasin (2004). A single point mutation always changes a set of six overlapping 6-mers to a new set of six sequences. If the average ESRseq score for the six 6-mers after mutation was lower than that for the six 6-mers before mutation, the change was recorded as an ESRseq score decrease; an ESRseq score increase was defined analogously. Random mutations were simulated by randomly placing single base substitutions into ∼100,000 constitutive exons (excluding splice site sequences).
Acknowledgments
We thank Dennis Weiss, Christina Leslie, Mauricio Arias, Jon Cacciatore, and Ron Gejman for many helpful discussions. We appreciate the help of Peter Schweitzer at the Cornell University Life Sciences Core Laboratories in getting us started in Illumina deep sequencing. We are especially grateful to Mauricio Arias for a plasmid with the framework minigene used here and for the HEK293tTA host cells. This work was supported by a grant from the NIH (GM072740) to L.A.C.
Authors' contributions: S.K. and L.A.C. designed the experiments, analyzed the data, and wrote the manuscript. S.S. initiated the project and built the E. coli libraries. S.K. performed all the experimental work reported here except the Illumina sequencing, which was carried out by S.M.K., I.M., L.Y., J.J.R., and J.J.
Footnotes
[Supplemental material is available for this article.]
Article published online before print. Article, supplemental material, and publication date are at http://www.genome.org/cgi/doi/10.1101/gr.119628.110.
References
- Andersson R, Enroth S, Rada-Iglesias A, Wadelius C, Komorowski J 2009. Nucleosomes are well positioned in exons and carry characteristic histone modifications. Genome Res 19: 1732–1741 [DOI] [PMC free article] [PubMed] [Google Scholar]
- Aznarez I, Barash Y, Shai O, He D, Zielenski J, Tsui LC, Parkinson J, Frey BJ, Rommens JM, Blencowe BJ 2008. A systematic analysis of intronic sequences downstream of 5′ splice sites reveals a widespread role for U-rich motifs and TIA1/TIAL1 proteins in alternative splicing regulation. Genome Res 18: 1247–1258 [DOI] [PMC free article] [PubMed] [Google Scholar]
- Benjamini Y, Hochberg Y 1995. Controlling the false discovery rate: A practical and powerful approach to multiple testing. J R Stat Soc Ser B Methodol 57: 289–300 [Google Scholar]
- Blanchette M, Green RE, Brenner SE, Rio DC 2005. Global analysis of positive and negative pre-mRNA splicing regulators in Drosophila. Genes Dev 19: 1306–1314 [DOI] [PMC free article] [PubMed] [Google Scholar]
- Blanchette M, Green RE, MacArthur S, Brooks AN, Brenner SE, Eisen MB, Rio DC 2009. Genome-wide analysis of alternative pre-mRNA splicing and RNA-binding specificities of the Drosophila hnRNP A/B family members. Mol Cell 33: 438–449 [DOI] [PMC free article] [PubMed] [Google Scholar]
- Buratti E, Baralle FE 2004. Influence of RNA secondary structure on the pre-mRNA splicing process. Mol Cell Biol 24: 10505–10514 [DOI] [PMC free article] [PubMed] [Google Scholar]
- Buratti E, Stuani C, De Prato G, Baralle FE 2007. SR protein-mediated inhibition of CFTR exon 9 inclusion: molecular characterization of the intronic splicing silencer. Nucleic Acids Res 35: 4359–4368 [DOI] [PMC free article] [PubMed] [Google Scholar]
- Burd CG, Dreyfuss G 1994. RNA binding specificity of hnRNP A1: significance of hnRNP A1 high-affinity binding sites in pre-mRNA splicing. EMBO J 13: 1197–1204 [DOI] [PMC free article] [PubMed] [Google Scholar]
- Castle JC, Zhang C, Shah JK, Kulkarni AV, Kalsotra A, Cooper TA, Johnson JM 2008. Expression of 24,426 human alternative splicing events and predicted cis regulation in 48 tissue and cell lines. Nat Genet 40: 1416–1425 [DOI] [PMC free article] [PubMed] [Google Scholar]
- Cavaloc Y, Bourgeois CF, Kister L, Stevenin J 1999. The splicing factors 9G8 and SRp20 transactivate splicing through different and specific enhancers. RNA 5: 468–483 [DOI] [PMC free article] [PubMed] [Google Scholar]
- Chasin LA 2007. Searching for splicing motifs. Adv Exp Med Biol 623: 85–106 [DOI] [PubMed] [Google Scholar]
- Coulter LR, Landree MA, Cooper TA 1997. Identification of a new class of exonic splicing enhancers by in vivo selection. Mol Cell Biol 17: 2143–2150 [DOI] [PMC free article] [PubMed] [Google Scholar]
- Fairbrother WG, Yeh RF, Sharp PA, Burge CB 2002. Predictive identification of exonic splicing enhancers in human genes. Science 297: 1007–1013 [DOI] [PubMed] [Google Scholar]
- Fox-Walsh KL, Hertel KJ 2009. Splice-site pairing is an intrinsically high fidelity process. Proc Natl Acad Sci 106: 1766–1771 [DOI] [PMC free article] [PubMed] [Google Scholar]
- Friedman BA, Stadler MB, Shomron N, Ding Y, Burge CB 2008. Ab initio identification of functionally interacting pairs of cis-regulatory elements. Genome Res 18: 1643–1651 [DOI] [PMC free article] [PubMed] [Google Scholar]
- Goren A, Ram O, Amit M, Keren H, Lev-Maor G, Vig I, Pupko T, Ast G 2006. Comparative analysis identifies exonic splicing regulatory sequences–The complex definition of enhancers and silencers. Mol Cell 22: 769–781 [DOI] [PubMed] [Google Scholar]
- Gossen M, Bujard H 1992. Tight control of gene expression in mammalian cells by tetracycline-responsive promoters. Proc Natl Acad Sci 89: 5547–5551 [DOI] [PMC free article] [PubMed] [Google Scholar]
- Hartmann B, Castelo R, Blanchette M, Boue S, Rio DC, Valcarcel J Global analysis of alternative splicing regulation by insulin and wingless signaling in Drosophila cells. 2009. Genome Biol 10: R11 doi: 10.1186/gb-2009-10-1-r11 [DOI] [PMC free article] [PubMed] [Google Scholar]
- Hiller M, Zhang Z, Backofen R, Stamm S 2007. Pre-mRNA secondary structures influence exon recognition. PLoS Genet 3: e204 doi: 10.1371/journal.pgen.0030204 [DOI] [PMC free article] [PubMed] [Google Scholar]
- Isken O, Maquat LE 2007. Quality control of eukaryotic mRNA: safeguarding cells from abnormal mRNA function. Genes Dev 21: 1833–1856 [DOI] [PubMed] [Google Scholar]
- Kaplan N, Moore IK, Fondufe-Mittendorf Y, Gossett AJ, Tillo D, Field Y, LeProust EM, Hughes TR, Lieb JD, Widom J, et al. 2009. The DNA-encoded nucleosome organization of a eukaryotic genome. Nature 458: 362–366 [DOI] [PMC free article] [PubMed] [Google Scholar]
- Ke S, Chasin LA 2010. Intronic motif pairs cooperate across exons to promote pre-mRNA splicing. Genome Biol 11: R84 doi: 0.1186/gb-2010-11-8-r84 [DOI] [PMC free article] [PubMed] [Google Scholar]
- Ke S, Zhang XH, Chasin LA 2008. Positive selection acting on splicing motifs reflects compensatory evolution. Genome Res 18: 533–543 [DOI] [PMC free article] [PubMed] [Google Scholar]
- Licatalosi DD, Mele A, Fak JJ, Ule J, Kayikci M, Chi SW, Clark TA, Schweitzer AC, Blume JE, Wang X, et al. 2008. HITS-CLIP yields genome-wide insights into brain alternative RNA processing. Nature 456: 464–469 [DOI] [PMC free article] [PubMed] [Google Scholar]
- Liu HX, Zhang M, Krainer AR 1998. Identification of functional exonic splicing enhancer motifs recognized by individual SR proteins. Genes Dev 12: 1998–2012 [DOI] [PMC free article] [PubMed] [Google Scholar]
- Llorian M, Schwartz S, Clark TA, Hollander D, Tan LY, Spellman R, Gordon A, Schweitzer AC, de la Grange P, Ast G, et al. 2010. Position-dependent alternative splicing activity revealed by global profiling of alternative splicing events regulated by PTB. Nat Struct Mol Biol 17: 1114–1123 [DOI] [PMC free article] [PubMed] [Google Scholar]
- Luco RF, Pan Q, Tominaga K, Blencowe BJ, Pereira-Smith OM, Misteli T 2010. Regulation of alternative splicing by histone modifications. Science 327: 996–1000 [DOI] [PMC free article] [PubMed] [Google Scholar]
- Mereau A, Anquetil V, Cibois M, Noiret M, Primot A, Vallee A, Paillard L 2009. Analysis of splicing patterns by pyrosequencing. Nucleic Acids Res 37: e126 doi: 10.1093nar/gkp626 [DOI] [PMC free article] [PubMed] [Google Scholar]
- Pomeranz Krummel DA, Oubridge C, Leung AK, Li J, Nagai K 2009. Crystal structure of human spliceosomal U1 snRNP at 5.5 A resolution. Nature 458: 475–480 [DOI] [PMC free article] [PubMed] [Google Scholar]
- Ray D, Kazan H, Chan ET, Pena Castillo L, Chaudhry S, Talukder S, Blencowe BJ, Morris Q, Hughes TR 2009. Rapid and systematic analysis of the RNA recognition specificities of RNA-binding proteins. Nat Biotechnol 27: 667–670 [DOI] [PubMed] [Google Scholar]
- Reid DC, Chang BL, Gunderson SI, Alpert L, Thompson WA, Fairbrother WG 2009. Next-generation SELEX identifies sequence and structural determinants of splicing factor binding in human pre-mRNA sequence. RNA 15: 2385–2397 [DOI] [PMC free article] [PubMed] [Google Scholar]
- Sanford JR, Wang X, Mort M, Vanduyn N, Cooper DN, Mooney SD, Edenberg HJ, Liu Y 2009. Splicing factor SFRS1 recognizes a functionally diverse landscape of RNA transcripts. Genome Res 19: 381–394 [DOI] [PMC free article] [PubMed] [Google Scholar]
- Schaal TD, Maniatis T 1999. Selection and characterization of pre-mRNA splicing enhancers: identification of novel SR protein-specific enhancer sequences. Mol Cell Biol 19: 1705–1719 [DOI] [PMC free article] [PubMed] [Google Scholar]
- Schwartz S, Meshorer E, Ast G 2009. Chromatin organization marks exon-intron structure. Nat Struct Mol Biol 16: 990–995 [DOI] [PubMed] [Google Scholar]
- Shapiro MB, Senapathy P 1987. RNA splice junctions of different classes of eukaryotes: sequence statistics and functional implications in gene expression. Nucleic Acids Res 15: 7155–7174 [DOI] [PMC free article] [PubMed] [Google Scholar]
- Singh R, Valcarcel J, Green MR 1995. Distinct binding specificities and functions of higher eukaryotic polypyrimidine tract-binding proteins. Science 268: 1173–1176 [DOI] [PubMed] [Google Scholar]
- Smith PJ, Zhang C, Wang J, Chew SL, Zhang MQ, Krainer AR 2006. An increased specificity score matrix for the prediction of SF2/ASF-specific exonic splicing enhancers. Hum Mol Genet 15: 2490–2508 [DOI] [PubMed] [Google Scholar]
- Spies N, Nielsen CB, Padgett RA, Burge CB 2009. Biased chromatin signatures around polyadenylation sites and exons. Mol Cell 36: 245–254 [DOI] [PMC free article] [PubMed] [Google Scholar]
- Tacke R, Manley JL 1995. The human splicing factors ASF/SF2 and SC35 possess distinct, functionally significant RNA binding specificities. EMBO J 14: 3540–3551 [DOI] [PMC free article] [PubMed] [Google Scholar]
- Tacke R, Chen Y, Manley JL 1997. Sequence-specific RNA binding by an SR protein requires RS domain phosphorylation: creation of an SRp40-specific splicing enhancer. Proc Natl Acad Sci 94: 1148–1153 [DOI] [PMC free article] [PubMed] [Google Scholar]
- Tian H, Kole R 1995. Selection of novel exon recognition elements from a pool of random sequences. Mol Cell Biol 15: 6291–6298 [DOI] [PMC free article] [PubMed] [Google Scholar]
- Tian H, Kole R 2001. Strong RNA splicing enhancers identified by a modified method of cycled selection interact with SR protein. J Biol Chem 276: 33833–33839 [DOI] [PubMed] [Google Scholar]
- Tilgner H, Nikolaou C, Althammer S, Sammeth M, Beato M, Valcarcel J, Guigo R 2009. Nucleosome positioning as a determinant of exon recognition. Nat Struct Mol Biol 16: 996–1001 [DOI] [PubMed] [Google Scholar]
- Tusher VG, Tibshirani R, Chu G 2001. Significance analysis of microarrays applied to the ionizing radiation response. Proc Natl Acad Sci 98: 5116–5121 [DOI] [PMC free article] [PubMed] [Google Scholar]
- Voelker RB, Berglund JA 2007. A comprehensive computational characterization of conserved mammalian intronic sequences reveals conserved motifs associated with constitutive and alternative splicing. Genome Res 17: 1023–1033 [DOI] [PMC free article] [PubMed] [Google Scholar]
- Wang Z, Rolish ME, Yeo G, Tung V, Mawson M, Burge CB 2004. Systematic identification and analysis of exonic splicing silencers. Cell 119: 831–845 [DOI] [PubMed] [Google Scholar]
- Xue Y, Zhou Y, Wu T, Zhu T, Ji X, Kwon YS, Zhang C, Yeo G, Black DL, Sun H, et al. 2009. Genome-wide analysis of PTB-RNA interactions reveals a strategy used by the general splicing repressor to modulate exon inclusion or skipping. Mol Cell 36: 996–1006 [DOI] [PMC free article] [PubMed] [Google Scholar]
- Yeo G, Hoon S, Venkatesh B, Burge CB 2004. Variation in sequence and organization of splicing regulatory elements in vertebrate genes. Proc Natl Acad Sci 101: 15700–15705 [DOI] [PMC free article] [PubMed] [Google Scholar]
- Yeo GW, Van Nostrand EL, Liang TY 2007. Discovery and analysis of evolutionarily conserved intronic splicing regulatory elements. PLoS Genet 3: e85 doi: 10.1371/journal.pgen.0030085 [DOI] [PMC free article] [PubMed] [Google Scholar]
- Yeo GW, Coufal NG, Liang TY, Peng GE, Fu XD, Gage FH 2009. An RNA code for the FOX2 splicing regulator revealed by mapping RNA-protein interactions in stem cells. Nat Struct Mol Biol 16: 130–137 [DOI] [PMC free article] [PubMed] [Google Scholar]
- Zhang XH, Chasin LA 2004. Computational definition of sequence motifs governing constitutive exon splicing. Genes Dev 18: 1241–1250 [DOI] [PMC free article] [PubMed] [Google Scholar]
- Zhang XH, Kangsamaksin T, Chao MS, Banerjee JK, Chasin LA 2005a. Exon inclusion is dependent on predictable exonic splicing enhancers. Mol Cell Biol 25: 7323–7332 [DOI] [PMC free article] [PubMed] [Google Scholar]
- Zhang XH, Leslie CS, Chasin LA 2005b. Dichotomous splicing signals in exon flanks. Genome Res 15: 768–779 [DOI] [PMC free article] [PubMed] [Google Scholar]