

Abstract
The pathogenesis of neurodevelopmental disorders such as autism is believed to be influenced by interactions between genetic and environmental factors, and appropriate animal models are needed to assess the influence of such factors on relevant neurodevelopmental phenotypes. A set of inbred mouse strains (Atchley strains) including A12 (E+L0) and A22 (E-L0) were generated by age-specific restricted index selection from a baseline random-bred ICR mouse population obtained from Harlan Sprague-Dawley (Atchley et al., 1997; Indianapolis, IN). As compared with the A22 strain, A12 mice had significantly increased early (P0-P10) body weight gain with minimal changes in late (P28 to P56) body weight gain. We found that these strains also differed in brain weight, brain volume, cell proliferation, and FGF-2 levels in certain brain regions. Specifically, brain weight and volume were significantly greater in A12 mice than that in A22 mice at P10 and P28. Quantitative analysis of Bromodeoxyuridine (BrdU) labeling of proliferating cells showed that the number of BrdU-positive cells in the A12 strain was significantly greater in the frontal cortex and lesser in the dentate gyrus than that in the A22 strain at P28. Western blot revealed that fibroblast growth factors-2 (FGF-2), but not brain-derived neurotrophic factor (BDNF), expression was significantly increased in the frontal cortex of A12 strain at P28. Also, A12 mice exhibited decreased intra-strain social interaction and increased repetitive stereotyped behaviors at P28. Our study suggests that A12 mice may partially mimic the anatomic and behavioral traits of patients with neurodevelopmental disorders such as autism spectrum disorders, and therefore may yield insights into the developmental mechanisms involved in their pathogenesis.
Keywords: neurodevelopment, brain weight, brain volume, neurogenesis, social interaction, Autism
Early postnatal neurodevelopment lays the groundwork for critical behavioral capacities, including memory-related behaviors, exploratory behaviors and social interaction. Many severe mental disorders, such as autism, schizophrenia and bipolar disorder, are associated with abnormal early neurodevelopment (Walsh et al., 2008; Crow, 2004; Gur et al., 1994). Patients with such neurodevelopmental disorders display departures from the trajectory of normative brain volume changes, especially in the first few years of life. For example, individuals with autism demonstrate a normal brain weight at birth, elevated brain growth rate during the first two years of life, and then a normal growth rate thereafter (Hardan et al., 2001; Walsh et al., 2008; Stokstad, 2001). The critical symptoms accompanying the anatomic abnormalities in autism patients are the behavioral deficits characterized by aberrant reciprocal social interactions, impaired communication, and stereotyped repetitive behaviors with narrow restricted interests (Geschwind, 2008; Lord et al., 2000; Palmen et al., 2004; 2009). However, the mechanisms responsible for this anomalous growth and how these anatomic changes are associated with the behavioral outcomes are not clear.
It is widely accepted that autism has multiple causes, including a strong genetic contribution (Giza et al., 2010; Janusonis et al., 2006; Tabuchi et al., 2007; Yochum et al., 2010; Gregg et al., 2008; Ronald et al., 2006). Therefore, rodent models of autism based on genetic selection may have significant value in exploring pathogenic mechanisms (Yochum et al., 2010; Martin et al., 2010; Frye and Llaneza, 2010). Furthermore, rodent models may have translational value through identifying preclinical biomarkers to aid diagnosis and discovering new targets for psychopharmacological treatments. Currently, mouse models for autism research are limited, although several have been proposed as potential candidates (Bolivar et al., 2007; Brodkin, 2007; Cheh et al., 2006; DeLorey, 2005; Frye and Llaneza, 2010; Tabuchi et al., 2007). One approach is to mutate target genes that code for neurotransmitters and developmental processes that may regulate social behavior. An example of this method involves oxytocin, a hypothalamic neuropeptide that contributes to pair-bonding and social affiliation behaviors in some species. Oxytocin knockout mice display deficits in social recognition and social memory (Young, 2001). A second approach is to generate deficits in neurotransmitters or brain regions that are analogous to the neurochemical or anatomical abnormalities seen in the brains of humans with autism. For example, Goldowitz et al. used heterozygous Lurcher (Lcl/+) mutant mice to study the cerebellar abnormalities associated with autism (Chen and Toth, 2001). A third approach is to study human diseases known to have a high comorbidity with autism. Several mouse lines have been generated with targeted gene mutations relevant to Angelman syndrome (Sinkkonen et al., 2003), Fragile X syndrome (Chen and Toth, 2001), and many other conditions associated with autism. Although most of these models have manipulated loci that mediate single-gene linked autistic symptoms, or involve mutations in pathways thought to be altered in autism, and display either neuroanatomical or behavioral traits (Moy et al., 2006), at this moment there is no ideal animal model that mimics the early trajectory of developmental abnormalities. The development of such animal models for autism is therefore greatly needed.
The Atchley mouse strains are serial age-specific restricted index selection mice which were created in the laboratory of geneticist William R. Atchley at North Carolina State University (Atchley et al., 1997). These mouse lines were originally created to explore the cellular and genetic responses to selection for unique patterns of early and late age-specific growth. A restricted index selection experiment was carried out for 35 generations from a base population of randomly bred ICR mice by selecting for both increased (E+) and decreased (E-) early body weight gain (postnatal 0~10 days of age) while holding late growth (postnatal 28~56 days of age) constant, and increased (L+) and decreased (L-) late body weight gain holding early growth constant. Each condition was applied to three replicate populations. This generated 12 distinct mouse lines in four groups that display varying combinations of early and late growth acceleration and deceleration. After 35 generations of selection the two best performing replicates from each condition were inbred by brother-sister mating for 8 generations. The mice were then transferred to James M. Cheverud at Washington University where they have been maintained for 20 generations of brother-sister mating. These strains should now be fully inbred (F > 0.986).
An appealing characteristic of these mice for the study of autism is that the early selection generated significant changes in the number of cells in the brain (Atchley et al., 2000). One set of these strains, A12, was selected for increased early body weight gain and constant late body weight gain while its reciprocal treatment, A22, was selected for decreased early body weight gain and constant late body weight grain. In addition, among the aforementioned four selection treatments, the A12 strain, which was selected for rapid early body weight gain and constant late gain, was also found to undergo rapid early overgrowth in the brain by total DNA measurement (Atchley et al., 2000). This pattern may mimic findings in human subjects with autism who display unusual early brain overgrowth (Courchesne et al., 2003; Sparks et al., 2002; Courchesne et al., 2001). In light of the similarity between the early brain development of A12 Atchley mice and humans with autism, we hypothesized that A12 Atchley mice would demonstrate other phenotypes consistent with those found in autism spectrum disorders. It is important to determine if altered neurodevelopmental trajectory of the A12 strain results in behavioral changes resembling those observed in other models of autism. In this study, we first replicated the early body weight growth trajectories in A12 and A22 strains, then characterized their neuroanatomical features as the result of early growth disparity by measuring brain weight, region specific brain volume and cell proliferation. Additionally, we studied the brain-derived neurotrophic factor (BDNF) and fibroblast growth factors (FGF-2) expression, specifically in the cortex and hippocampus, as these two pivotal neurochemicals are play a key role in plasticity of early brain development and neurodevelopmental disorders. Finally, we evaluated the aberrant reciprocal social behavior by testing intra-strain social interaction, and stereotyped repetitive behavior with restricted interest was measured by observing their repetitive self-grooming behavior, which reflects core symptoms of autism.
EXPERIMENTAL PROCEDURES
Animals
Two Atchley mouse strains: A12 and A22 were selected for this study (Atchley et al., 1997). Breeding pairs were obtained from Cheverud’s laboratory at Washington University. The animals were maintained in an environmentally controlled facility at 60% relative humidity. Food and water were available ad libitum. Procedures involving animals were conducted in accordance with institutional guidelines and are in compliance with national standards and policies (1985), with approval from the Institutional Animal Care and Use Committee at Northwestern University. Male offspring were collected at postnatal day 3 (P3), day 10 (P10), day 28 (28) and day 56 (P56) from each strain. Each group contained 6 animals for the morphological study and 12 animals for behavioral tests. In this study, only male offspring were selected for evaluation because males are more susceptible to developing autism, with male-female ratio 4:1 (Tanguay, 2010).
5-Bromodeoxyuridine injections
5-Bromodeoxyuridine (BrdU) (Sigma-Aldrich, St. Louis, MO, USA) was dissolved in 0.9% NaCl and sterile filtered. To evaluate the cell proliferation in the cortex and hippocampus at P28, mice received an intraperitoneal injection of 5-bromo-2’-deoxyuridine (BrdU) 24h before sacrifice (50 mg/kg body weight at a concentration of 15 mg/ml) (Dong et al., 2003).
Tissue preparation
For P3 and P10 old pups, the brain tissue was directly immersed in 4% paraformaldehyde. Whole brains were rapidly dissected and immersed in 4% paraformaldehyde fixative solution. Brains were post-fixed for 10 days, and then transferred into 30% sucrose/PBS buffer for 2 days. For P28 and P56 old mice, animals were deeply anesthetized with sodium pentobarbital (60 mg/kg, i.p.) and then transcardially perfused with heparinized saline flush, followed by a solution of 4% paraformaldehyde in PBS, pH 7.4, for 15 min. After perfusion, brains were removed and post-fixed in the same solution for 10 days, then transferred to 30% sucrose for 2 days. Body weight was measured just prior to euthanasia on P3, P10, P28, or P56. Brain weights (excluding olfactory bulbs and pons) were measured before embedding tissue for sectioning. Six sets of serial sections (50 μm in thickness) were cut using a freezing microtome. All sections were stored in PBS until needed for analysis.
Nissl staining and brain volume measurement
One set of serial sections was mounted on gelatin-coated slides and allowed to air-dry. The slides were then rehydrated in double distilled water, submerged in 0.3% cresyl violet (Sigma-Aldrich) for 45 to 60 s until the desired depth of staining was achieved, and then gradually dehydrated for 5 min in successive baths of ethanol (i.e. 50%, 75%, 90%, 95% and 100%). Each slide was then given three 5 min baths in 100% xylene and coverslipped for hippocampal and cortical volume measurement under a light microscope.
Digital images of cresyl violet-stained (Nissl staining) coronal sections of mouse brains were taken with a Nikon camera attached to the light microscope in JPEG format. The final resolution of the images was one pixel=0.000685 mm2 and the images were imported into Analyze 9.0 (ANALYZEDIRECT, Overland Park, KS, USA) for assessment. Using the Analyze 9.0 stereology module, a grid was randomly placed over each section. The area of the hippocampus and cortical gray matter was measured in each coronal section using Cavalieri’s principle. The contours of the cortical gray matter and hippocampus were identified using landmarks derived from a mouse brain atlas. The points on the grid were spaced 8 pixels apart on the X and Y axes. Thus, the total number of grid points over the target area was multiplied by 64 to obtain the total pixels encompassing the hippocampus or cortical gray matter in each brain. This number was then multiplied by 0.000685 mm2 and 0.2 mm to obtain the volumes (mm3) (Dong et al., 2007).
BrdU labeling
Tissue sections were first denatured in 2N HCl for 60 min at 37°C and then neutralized in 0.1 M borate buffer, pH 8.5, for 10 min. After washing in PBS, the sections were incubated for 1 hour in 5% normal horse serum and 0.2% TritonX-100, then with anti-mouse BrdU (1:800; Roche Diagnostics, Basel, Schweiz) for 48 hours at 4°C, and then with a secondary antibody (biotinylated horse anti-mouse) (Vector Laboratories, Burlingame, CA, USA) for 2 hours, followed by amplification with an avidin-biotin complex (Vector Laboratories). BrdU-positive cells were visualized with DAB (Vector Laboratories) (Dong et al., 2004; Dong et al., 2003).
Western blotting
Western blot was used to measure levels of BDNF and FGF-2 in the hippocampus and frontal cortex of A12 and A22 mice. Mice were sacrificed on P28, the frontal cortex and hippocampus were quickly dissected on ice, snap-frozen, and stored at -80°C until biochemical analyses were conducted. The frozen brains were homogenized in 5 volumes of ice-cold homogenization buffer (0.2% NP-40 buffer and protease inhibitor in PBS buffer). Homogenates were centrifuged at 15,000g for 20 minutes at 4°C, and the supernatant was used to measure BDNF and FGF-2 protein levels in the brain. The concentration of the original protein was calculated from the light absorption (BCA method) (Thermo Fisher Scientific, Waltham, MA, USA) of the samples. 25μg of sample was further diluted in sample buffer (Bio-Rad, Hercules, CA, USA) and 15% polyacrylamide gels were used for SDS-PAGE. Proteins were transferred to PVDF membranes probed with primary antibodies against BDNF (1:500 dilution), FGF-2 (1:250 dilution) and β-actin (1:1000 dilution) (Santa Cruz Biotechnology, Santa Cruz, CA, USA)(Kim et al., 2010), followed by horseradish peroxidase (HRP)-conjugated secondary antibody (1:20,000) (BD Diagnostic Systems, Sparks, MD, USA). Immunoreactive proteins were visualized using the enhanced chemiluminescence Western blot detection system (Thermo Fisher Scientific). The light-emitting bands were detected with X-ray film (Thermo Fisher Scientific). Quantization of the blot was performed using Image J software (NIH Image 1.62, Bethesda, MD, USA), by plotting density. The relative concentration of BDNF and FGF-2 of each sample was measured by comparing the BDNF or FGF-2 binding density to the β-actin binding density on the same well.
Social interaction and self-grooming behavior
After weaning, same gender pups were housed in groups of 2-5 animals per cage. All testing took place in the light cycle and between 9am and 4pm. To elicit social interactions, a pair of male mice of the same strain (A12 or A22) were placed in the test chamber and allowed to explore freely for 10 minutes. Mice were naive to their same strain partners and the test chamber before starting the test. A new test chamber was used for each animal pair. The test chamber was identical to the standard housing cages, which was a clear polypropylene cage (27.5cm ×15.5cm × 12.0cm) with a thin layer of bedding (1 cm) covering the bottom (Silverman et al., 2010b). All behavior was videotaped with a JVC camcorder. The amount of time during which the mice engaged in social interactions was scored by an observer blind to the strain of each mouse (Bolivar et al., 2007). Social interaction behaviors we evaluated included: sniffing (also referred to as social sniffing, which includes sniffing of the head, trunk and anogenital areas of a novel partner), allogrooming (mutual grooming, which includes grooming of the head, trunk and anogenital areas of a novel partner), biting, close following, chasing, mounting and wrestling (Kalueff et al., 2007; Bolivar et al., 2007). These selected behaviors have been routinely used to evaluate social behavior in rodents and were coded according to established definitions (Kalueff et al., 2007).
In the 10min session of intra-strain social behavior testing, the amount of time involved in self-grooming (that is, spontaneous grooming behaviors, referring to grooming all body regions with the two front paws) was also scored by a trained observer blind to the strains of the mice. Because the thin layer of bedding in the testing chamber largely reduced digging behavior, self-grooming was used for evaluating the stereotyped behavior in our two strains (Yu et al., 2010; Silverman et al., 2010a; Cook, 2010; Fraser and Waddell, 1974; Kalueff et al., 2007).
Data analysis
Two-sample comparisons were carried out using unpaired Student’s t-test, while multiple parameters comparisons in two strains were made using multiple t-test with Bonferroni correction. All data were presented as mean ± S.E.M., and the limit for statistical significance was maintained at P value <0.05.
RESULTS
Body weight and brain weight
We first confirmed that the body weight developmental trajectories in the A12 and A22 strains were consistent with the previously reports (Fig.1A) (Atchley et al. 1997, 2000). Then we measured the brain weight of both strains at different early developmental stages. We found no significant differences between the brain weight of A12 and A22 strains at P3 (A12: 0.12 ± 0.0022g vs. A22: 0.12 ± 0.0020g; P>0.05). However, the average brain weight of A12 mice (0.26±0.008g) was significantly greater than that of A22 mice (0.2± 0.013g; P<0.01) at P10. This significant difference was apparent at P28 (A12: 0.47±0.006 g vs A22: 0.39±0.01g; P<0.01). The net brain weight gain (brain weight increases) in A12 from P3 to P28 was significantly greater than that in A22 (A12: 0.35 ± 0.007g vs. A22: 0.27 ± 0.014g; P<0.01). Brain weight gains slowed between P28 and P56, reflecting that both strains held their late growth constant. At this time period, although the discrepancy in brain weight accumulated through early development was maintained in both strains, the net brain weight gain during this period was not significantly different between A12 and A22 mice (A12: 0.035 ± 0.006g vs. A22: 0.033± 0.007g; P>0.05) (Fig.1B).
Fig. 1.
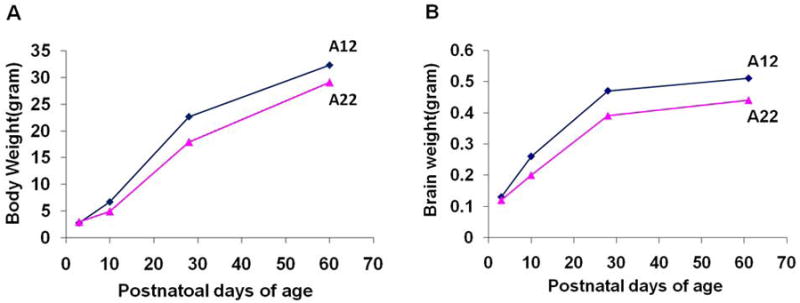
(A) Body weight and brain weight (B) growth curve of A12 and A22 strains at different postnatal time points. The significant brain weight gain increase in A12 is from P3 to P28 as compared to A22. Brain weight gains slowed down from P28 to P56, although the discrepancy in brain weight accumulated through early development was maintained in both strains at this time point.
Brain volume
To explore whether the A12 strain, with its excessive early brain weight gain, also showed corresponding enlargement of brain volume, we measured brain volumes in A12 and A22 strains using stereological methods described previously (Dong et al., 2007). We found a strain effect on brain volume at both P10 and P28. As shown in figure 2, brain volume of A12 at both P10 (381 ± 17.44 mm3) and P28 (679 ± 23.4mm3) was significantly larger than brain volume of A22 at P10 (266±37.32mm3) and P28 (536±21.4mm3) (* P< 0.05; ** P<0.01), respectively (Fig.2).
Fig. 2.
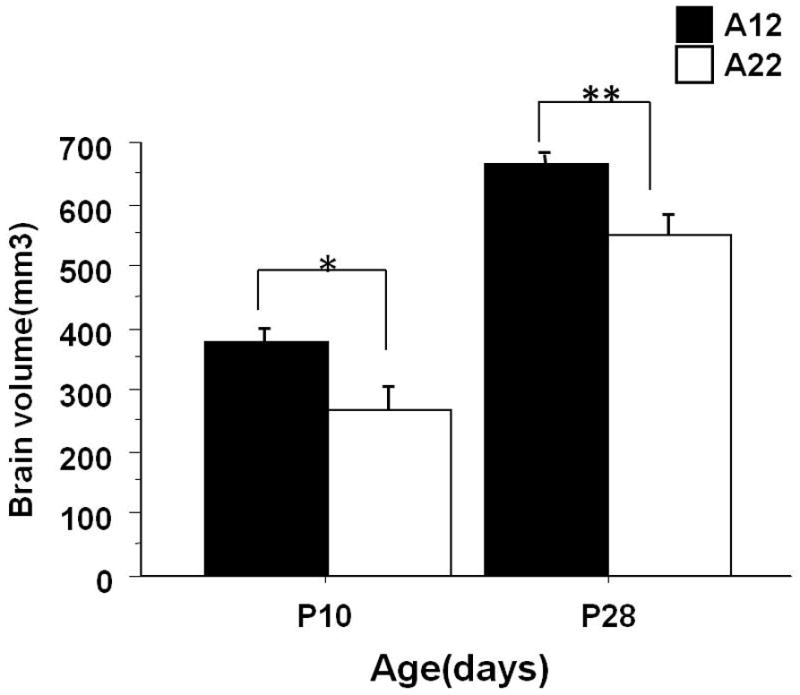
Brain volumes of A12 and A22 strains at P10 and P28 indicated that A12 mice have a significantly larger brain volume than A22 mice at both P10 and P28 (* denotes P value < 0.05; ** P value < 0.01; data were presented as mean ± S.E.M.).
Cell proliferation
To determine whether the early brain overgrowth of A12 is due to increased cell proliferation in the brain, we characterized cell proliferation in both A12 and A22 strains in frontal cortex and hippocampus. As expected, with quantitative analysis of BrdU labeling, we found that BrdU positive cells were significantly increased in the frontal cortex of A12 as compared to A22 at P28 (16.6 ± 1.2 vs 8.5 ± 1.1/section; P<0.01) (Fig. 3 A, B and E). However, despite the early rapid brain overgrowth, A12 mice had significantly less BrdU-positive cells in the dentate gyrus (DG) as compared to that of A22 mice at P28 (14.6 ± 1.8 vs 26.1 ± 1.6/section; P< 0.01) (Fig. 3 C, D and F).
Fig. 3.
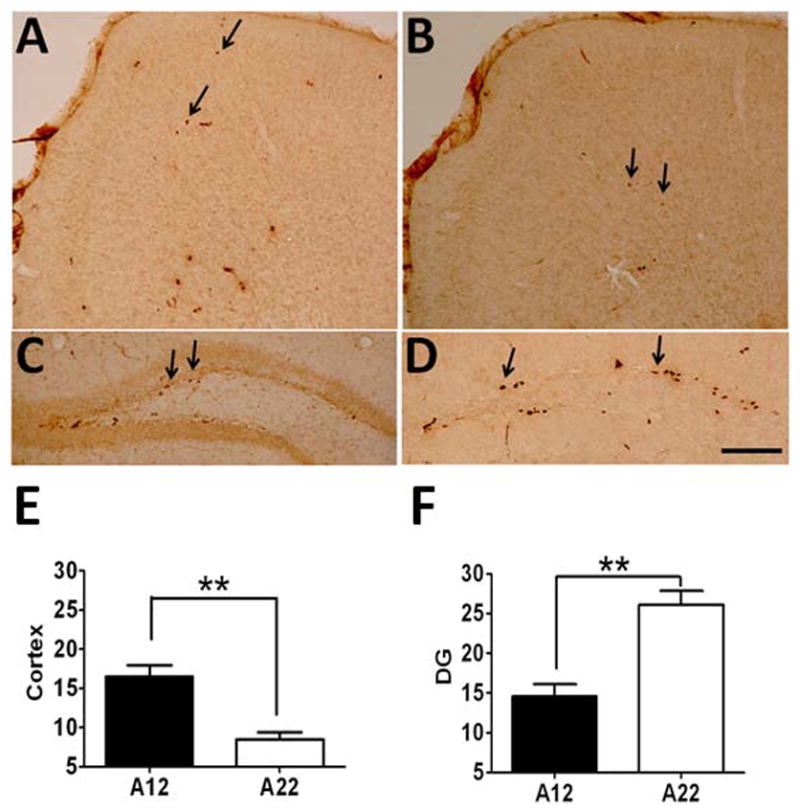
Cell counting for BrdU-labeling in the frontal cortex and dentate gyrus of A12 and A22 mice at P28. Panels A and C represent the frontal cortex and dentate gyrus of A12 mice; Panels B and D represent the cortex and dentate gyrus of A22 mice. Panel E: semi-quantitative analysis of the positive cell numbers in the cortex; Panel F: semi-quantitative analysis of the positive cell numbers in the dentate gyrus (DG) (**means P value < 0.01; Data were presented as mean ± S.E.M.)
BDNF and FGF-2 expression
To investigate whether growth factors play a role in brain overgrowth during the postnatal period, we assessed levels of brain-derived neurotrophic factor (BDNF) and fibroblast growth factor-2 (FGF-2) in the frontal cortex and hippocampus in A12 and A22 strains at P28 (Fig. 4A and D). We did not find a significant difference in BDNF expression between strains, although a trend towards increased BDNF was observed in the cortex of the A12 strain (P=0.06) (Fig. 4B). FGF-2 expression was significantly increased in the cortex (P=0.03) (Fig. 4C) but not in the hippocampus of A12 as compared to A22 (Fig. 4F).
Fig. 4.
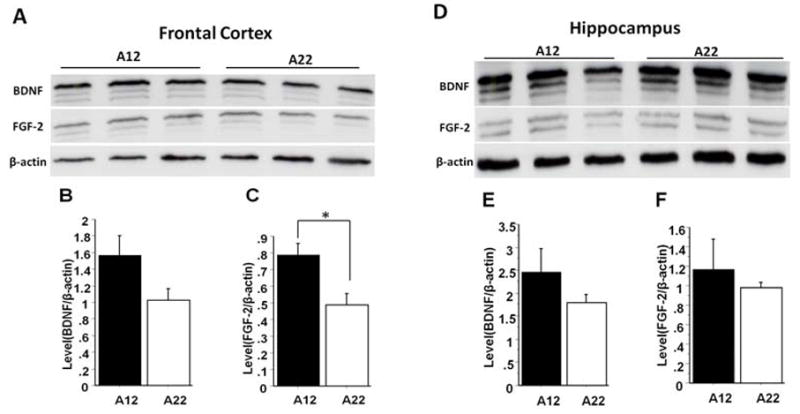
Analysis of BDNF and FGF-2 protein levels in the frontal cortex and hippocampus of A12 and A22 mice at P28 detected by western blot. Panels A and D represent western blot of the membrane fractions in the frontal cortex and hippocampus; Panels B and C represent semi-quantitative analysis for BDNF and FGF-2 expression in the frontal cortex of A12 and A22 mice; Panels E and F represent semi-quantitative analysis for BDNF and FGF-2 expression in the hippocampus of A12 and A22 mice (* P value < 0.05; data were presented as mean ± S.E.M).
Intra-strain social interaction and repetitive self-grooming
Intra-strain social behavioral assays were performed to investigate social interaction in A12 and A22 strains at P28. Table 1 indicates that the specific social behaviors we selected for this study and the strain differences such as sniffing others and following were observed. From the results indicated in the table, it was clear that some behaviors were more common than others and were seen in both strains tested. For example, sniffing the other mouse and following appeared in all animals of both strains during the test but A12 spent significantly less time than A22 (Sniffing, A12: 122.1±10.86 vs A22: 164.2±23.65, P<0.05; Following, A12: 7.3±1.0 vs 10.8± 0.5, P<0.05); whereas wrestling and allogrooming were only seen in 1 different pair of A22 mice. Statistic analysis did not show strain differences. Interestingly, huddling and mounting behavior were not observed in either pair of these two strains during the test sessions. Further statistical analysis on total time spent in the 10 minute test session amid social interaction indicated that A12 mice spent significantly less time during the session interacting with the novel, same strain partner when compared to the A22 strain (129.4± 10.6 vs 175.0 ± 23.5 respectively; P=0.03; Fig. 5).
Table 1.
The average time spent (number of pairs/total pairs) in various social interaction behaviors of A12 and A22 mice in Intra-strain Social Interaction Test
| Strains | Type of social interaction behavior | |||||
|---|---|---|---|---|---|---|
| Sniffing | Following | Wrestling | Allogrooming | Huddling | Mounting | |
| A12 | 122.1±10.9 (6/6) | 7.3±1.0 (6/6) | 0 (0/6) | 0 (0/6) | 0 (0/6) | 0 (0/6) |
| A22 | 164.2± 23.7 (6/6) | 10.8± 0.5 (6/6) | 26.5± 17.8 (1/6) | 2.0± 1.4 (1/6) | 0 (0/6) | 0 (0/6) |
| P value | <0.05 | <0.05 | >0.05 | >0.05 | >0.05 | >0.05 |
Fig. 5.
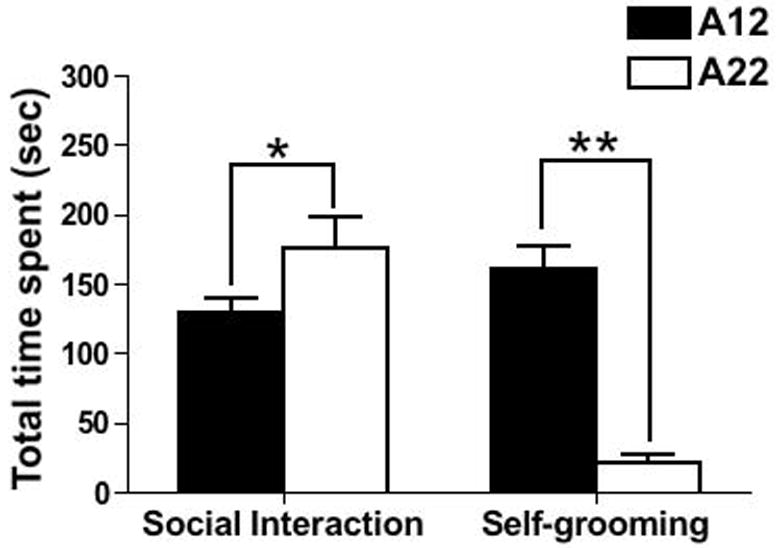
Social interaction and self-grooming behaviors in A12 and A22 mice at P28. Panel A: The total time spent engaged in social interaction with the novel same strain partners; Panel B: The total time spent engaged in self-grooming (* P value < 0.05, ** P value < 0.01; Data were presented as mean ± S.E.M.)
In addition, we scored and analyzed the repetitive self-grooming behavior in the A12 and A22 strains and found that A12 mice spent about one-fourth of the time during the testing session (160.5± 17.1 sec) on repetitive self-grooming; this was about seven folds the time A22 mice spent engaged in the same behavior (21.3 ± 5.6 sec). This difference was statistically significant (P<0.01) (Fig. 5).
DISCUSION
In this study, we found that brain weight and volume growth trajectories paralleled their body weight growth trajectories in A12 mice. The brains of A12 mice underwent rapid early overgrowth between P3 to P28, which then slowed down over time between P28 and P56. Consistent with our findings on gross measures of brain growth, increased cell proliferation was observed in the frontal cortex. However, decreased cell proliferation was detected in the dentate gyrus of the hippocampus in the A12 strain at P28. Also in parallel with brain overgrowth, increased FGF-2 expression was found in the cortex of A12 mice at P28.
The pattern of an early surge in brain growth followed by brain growth deceleration in A12 strain mice at least partly mimics the findings in the brains of humans with autism. Recent studies have revealed that although infants who eventually develop autism are born with normal to slightly smaller than normal brains, soon thereafter birth their brains grow at an excessive rate, resulting in enlarged brains in autistic toddlers (Courchesne et al., 2003; Sparks et al., 2002). This rate of brain growth, however, is not maintained and is followed by slowed or arrested growth (Courchesne et al., 2001). Whether the irregular enlargement of brain volume in autistic toddlers is due to increased cell number or size is not clear. In our study, A12 mice showed increased cell proliferation in the frontal cortex but decreased cell proliferation in the dentate gyrus of the hippocampus at P28. Increased cell proliferation in the frontal cortex may associate with overgrowth of brain. However, the disparate cell proliferation in the cortex and hippocampus at this age suggests that there may be variable genetic influences on region-specific cell proliferation. Normally, the cortex develops rapidly during the embryonic period, while the dentate gyrus continues its development after birth and even into adulthood; i.e., it preserves the ability for neurogenesis (Scherf et al., 2008). Our results suggest that hyperplasia in A12 strain is not proportionally distributed across the brain. Instead, early stage brain overgrowth in A12 was most prominent in the frontal cortex. This finding is also analogous to the observation of the disproportionately large frontal lobe in the brains of individuals with autism as reported with in vivo neuroimaging studies (Carper et al., 2002; Carper and Courchesne, 2005). Frontal lobe gray and white matter are both disproportionately deviant in size in relation to other cortical areas in autism (Carper et al., 2002; Carper and Courchesne, 2005).
In the central nervous system, growth factors such as brain-derived neurotrophic factor (BDNF) and fibroblast growth factors (FGF-2) play key roles in brain plasticity and development (Kim et al., 2010; Zhou et al., 1996). Alteration of these factors may also associate with neurodevelopmental disorders, such as autism. Studies indicated that FGF, which regulates cortical size and connectivity, might be responsible for these developmental alterations. Studies in animal models suggest that mutations in FGF genes lead to altered cortical volume, differences in the number of excitatory cortical neurons, hyperactivity and social deficits (Vaccarino et al., 2009). In our study, we found significantly increased FGF-2 protein expression in the frontal cortex of A12 mice, which were bred to gain weight more rapidly from P0 to P28. This result supports the hypothesis that dysregulation in amount or timing of FGF gene expression may be responsible for aberrantly regulated brain growth in autistic children, ultimately resulting in altered cortical modularity and connectivity (Vaccarino et al., 2009), consequently resulting in abnormal behavioral outcomes. In this study, we found the BDNF expression in the cortex of the A12 mice showed a treads of increasing, however, further confirmation of the BDNF function during the anomalous brain growth is still necessary in future.
Inappropriate social interaction is one of the core symptoms of autism (Bolivar et al., 2007; Crawley, 2007). Using an intra-strain social interaction test on P28, we found that A12 mice spent significantly less time interacting with a novel partner of the same strain than A22 mice. We evaluated several types of social behaviors including sniffing, mounting, huddling and allogrooming, as well as wrestling and biting. Certain behaviors such as huddling and mounting were never observed in either strain during this test, which might have occurred if the pairs were allowed to stay longer together. Wrestling and allogrooming were observed in only one different pair from A22 strain during the test, while sniffing and following were engaged by all the pairs of both strains during the social interaction test. The decreased social interaction behavior displayed by the A12 strain may be associated with their abnormal early stage frontal lobe overgrowth and the consequent altered neurochemical environment.
Another important behavioral finding that further supports A12 strain’s analogy to autism is their excessive repetitive self-grooming, which has been considered as a restricted and repetitive behavior in mice, and may have potential relevance to autism spectrum disorders (Pobbe et al., 2010; Blundell et al., 2010; Nicot et al., 2004; Silverman et al., 2010a; Klejbor et al., 2009). Several types of individual behavior, such as self-body sniffing, sniffing around, rearing, and locomotion, were observed in A12 and A22 mice, with no inter-strain differences. About half of the A12 and A22 mice also showed digging behaviors. No difference was found between the two strains (data not shown). Although self-grooming was observed in all tested mice in both strains, A12 mice spent significant longer time on this behavior resulting in a sevenfold increase as compared to A22 mice. This excessive self-grooming displayed by A12 could indicate as an increased repetitive stereotypic behavior, another key diagnostic symptom of autism in humans.
A12 mice showed both neuroanatomical and behavioral phenotypes that are analogous to those observed in humans with autism during the early developmental period, making this strain a promising animal model for autism. Current available animal models for the autism spectrum disorders mostly have been based on manipulations of loci that mediate single-gene human disorders characterized by autistic symptoms, or which have been identified through association or linkage studies in human genetics. Other mouse models involve mutations in pathways thought to be altered in autism, displaying either neuroanatomical or behaviorally significant traits (Moy et al., 2006). The animal models that mimic both neuroanatomical and behavioral phenotypes are limited. Until now, there was no one animal more naturally modeling the early trajectory of developmental abnormalities as autism. However, future studies are still needed to further confirm these phenotypes shown in A12 and to address whether these morphological and behavioral traits are preserved with age. We also need to continue the evaluation of the additional phenotypes of the A12 mice pertinent to animal models of autism. We are hoping to target genetic, biochemical and behavioral processes that share common characteristics with symptoms seen in autism. Since a rodent model cannot replicate a human psychiatric disorder, fundamental symptoms can be approximated for the purposes of testing theories about the biochemical, genetic, and environmental causes of the human condition. The A12 strain of Atchley mice could serve as a model to study critical processes or pathways associated with autism, such as the failure of apoptosis or neuronal pruning during development, leading to overgrowth or excessive retention of cells in the frontal lobe. Furthermore, the phenotypes of A12 mice related to autistic traits could be used to identify related genetic loci because of their phenotypic and genetic contrast with the A22 mice. These components may not be disorder-specific (i.e., there may not be a perfect mouse model for disorders such as autism); however, specific genetic findings could be used to search for candidate loci for human disorders, to help determine specific genotype-phenotype relationships, and to identify new targets for therapeutic intervention.
Research Highlights.
Our data suggest that A12 mice partially mimic anatomic and behavioral traits of patients with neurodevelopmental disorders, such as autism, and therefore may yield insights into the developmental mechanisms involved in their pathogenesis.
In A12 mice, brain weight and volume were significantly greater than that in A22 mice at P10 and P28.
BrdU-positive cells in the A12 strain were significantly greater in the FC and lesser in the DG.
The expression of FGF-2, but not BDNF, was significantly increased in the A12 strain.
A12 mice exhibited decreased intra-strain social interaction and increased repetitive stereotyped behaviors at P28.
Footnotes
Publisher's Disclaimer: This is a PDF file of an unedited manuscript that has been accepted for publication. As a service to our customers we are providing this early version of the manuscript. The manuscript will undergo copyediting, typesetting, and review of the resulting proof before it is published in its final citable form. Please note that during the production process errors may be discovered which could affect the content, and all legal disclaimers that apply to the journal pertain.
References
- National Institutes of Health Guide for the Care and Use of Laboratory Animals. 1985 NIH publication number 85-23. [Google Scholar]
- Autism and other developmental brain disorders. Nat Med. 2009;15(5):464. doi: 10.1038/nm0509-464. [DOI] [PubMed] [Google Scholar]
- Atchley WR, Wei R, Crenshaw P. Cellular consequences in the brain and liver of age-specific selection for rate of development in mice. Genetics. 2000;155(3):1347–1357. doi: 10.1093/genetics/155.3.1347. [DOI] [PMC free article] [PubMed] [Google Scholar]
- Atchley WR, Xu S, Cowley DE. Altering developmental trajectories in mice by restricted index selection. Genetics. 1997;146(2):629–640. doi: 10.1093/genetics/146.2.629. [DOI] [PMC free article] [PubMed] [Google Scholar]
- Blundell J, Blaiss CA, Etherton MR, Espinosa F, Tabuchi K, Walz C, Bolliger MF, Sudhof TC, Powell CM. Neuroligin-1 deletion results in impaired spatial memory and increased repetitive behavior. J Neurosci. 2010;30(6):2115–2129. doi: 10.1523/JNEUROSCI.4517-09.2010. [DOI] [PMC free article] [PubMed] [Google Scholar]
- Bolivar VJ, Walters SR, Phoenix JL. Assessing autism-like behavior in mice: variations in social interactions among inbred strains. Behav Brain Res. 2007;176(1):21–26. doi: 10.1016/j.bbr.2006.09.007. [DOI] [PMC free article] [PubMed] [Google Scholar]
- Brodkin ES. BALB/c mice: low sociability and other phenotypes that may be relevant to autism. Behav Brain Res. 2007;176(1):53–65. doi: 10.1016/j.bbr.2006.06.025. [DOI] [PubMed] [Google Scholar]
- Carper RA, Courchesne E. Localized enlargement of the frontal cortex in early autism. Biol Psychiatry. 2005;57(2):126–133. doi: 10.1016/j.biopsych.2004.11.005. [DOI] [PubMed] [Google Scholar]
- Carper RA, Moses P, Tigue ZD, Courchesne E. Cerebral lobes in autism: early hyperplasia and abnormal age effects. Neuroimage. 2002;16(4):1038–1051. doi: 10.1006/nimg.2002.1099. [DOI] [PubMed] [Google Scholar]
- Cheh MA, Millonig JH, Roselli LM, Ming X, Jacobsen E, Kamdar S, Wagner GC. En2 knockout mice display neurobehavioral and neurochemical alterations relevant to autism spectrum disorder. Brain Res. 2006;1116(1):166–176. doi: 10.1016/j.brainres.2006.07.086. [DOI] [PubMed] [Google Scholar]
- Chen L, Toth M. Fragile X mice develop sensory hyperreactivity to auditory stimuli. Neuroscience. 2001;103(4):1043–1050. doi: 10.1016/s0306-4522(01)00036-7. [DOI] [PubMed] [Google Scholar]
- Cook EH., Jr Reduction of increased repetitive self-grooming in ASD mouse model by metabotropic 5 glutamate receptor antagonism; randomized controlled trial of Early Start Denver Model. Autism Res. 2010;3(1):40–42. doi: 10.1002/aur.118. [DOI] [PubMed] [Google Scholar]
- Courchesne E, Carper R, Akshoomoff N. Evidence of brain overgrowth in the first year of life in autism. JAMA. 2003;290(3):337–344. doi: 10.1001/jama.290.3.337. [DOI] [PubMed] [Google Scholar]
- Courchesne E, Karns CM, Davis HR, Ziccardi R, Carper RA, Tigue ZD, Chisum HJ, Moses P, Pierce K, Lord C, Lincoln AJ, Pizzo S, Schreibman L, Haas RH, Akshoomoff NA, Courchesne RY. Unusual brain growth patterns in early life in patients with autistic disorder: an MRI study. Neurology. 2001;57(2):245–254. doi: 10.1212/wnl.57.2.245. [DOI] [PubMed] [Google Scholar]
- Crawley JN. Mouse behavioral assays relevant to the symptoms of autism. Brain Pathol. 2007;17(4):448–459. doi: 10.1111/j.1750-3639.2007.00096.x. [DOI] [PMC free article] [PubMed] [Google Scholar]
- Crow T. Review: brain weight is reduced in people with schizophrenia. Evid Based Ment Health. 2004;7(2):57. doi: 10.1136/ebmh.7.2.57. [DOI] [PubMed] [Google Scholar]
- DeLorey TM. GABRB3 gene deficient mice: a potential model of autism spectrum disorder. Int Rev Neurobiol. 2005;71:359–382. doi: 10.1016/s0074-7742(05)71015-1. [DOI] [PubMed] [Google Scholar]
- Dong H, Csernansky CA, Goico B, Csernansky JG. Hippocampal neurogenesis follows kainic acid-induced apoptosis in neonatal rats. J Neurosci. 2003;23(5):1742–1749. doi: 10.1523/JNEUROSCI.23-05-01742.2003. [DOI] [PMC free article] [PubMed] [Google Scholar]
- Dong H, Goico B, Martin M, Csernansky CA, Bertchume A, Csernansky JG. Modulation of hippocampal cell proliferation, memory, and amyloid plaque deposition in APPsw (Tg2576) mutant mice by isolation stress. Neuroscience. 2004;127(3):601–609. doi: 10.1016/j.neuroscience.2004.05.040. [DOI] [PubMed] [Google Scholar]
- Dong H, Martin MV, Colvin J, Ali Z, Wang L, Lu L, Williams RW, Rosen GD, Csernansky JG, Cheverud JM. Quantitative trait loci linked to thalamus and cortex gray matter volumes in BXD recombinant inbred mice. Heredity. 2007;99(1):62–69. doi: 10.1038/sj.hdy.6800965. [DOI] [PMC free article] [PubMed] [Google Scholar]
- Fraser D, Waddell MS. The importance of social and self-grooming for the control of ectoparasitic mites on normal and dystrophic laboratory mice. Lab Pract. 1974;23(2):58–59. [PubMed] [Google Scholar]
- Frye CA, Llaneza DC. Corticosteroid and neurosteroid dysregulation in an animal model of autism, BTBR mice. Physiol Behav. 2010;100(3):264–267. doi: 10.1016/j.physbeh.2010.03.005. [DOI] [PMC free article] [PubMed] [Google Scholar]
- Geschwind DH. Autism: Family connections. Nature. 2008;454(7206):838–839. doi: 10.1038/454838a. [DOI] [PMC free article] [PubMed] [Google Scholar]
- Giza J, Urbanski MJ, Prestori F, Bandyopadhyay B, Yam A, Friedrich V, Kelley K, D’Angelo E, Goldfarb M. Behavioral and cerebellar transmission deficits in mice lacking the autism-linked gene islet brain-2. J Neurosci. 2010;30(44):14805–14816. doi: 10.1523/JNEUROSCI.1161-10.2010. [DOI] [PMC free article] [PubMed] [Google Scholar]
- Gregg JP, Lit L, Baron CA, Hertz-Picciotto I, Walker W, Davis RA, Croen LA, Ozonoff S, Hansen R, Pessah IN, Sharp FR. Gene expression changes in children with autism. Genomics. 2008;91(1):22–29. doi: 10.1016/j.ygeno.2007.09.003. [DOI] [PubMed] [Google Scholar]
- Gur RE, Mozley PD, Shtasel DL, Cannon TD, Gallacher F, Turetsky B, Grossman R, Gur RC. Clinical subtypes of schizophrenia: differences in brain and CSF volume. Am J Psychiatry. 1994;151(3):343–350. doi: 10.1176/ajp.151.3.343. [DOI] [PubMed] [Google Scholar]
- Hardan AY, Minshew NJ, Mallikarjuhn M, Keshavan MS. Brain volume in autism. J Child Neurol. 2001;16(6):421–424. doi: 10.1177/088307380101600607. [DOI] [PubMed] [Google Scholar]
- Janusonis S, Anderson GM, Shifrovich I, Rakic P. Ontogeny of brain and blood serotonin levels in 5-HT receptor knockout mice: potential relevance to the neurobiology of autism. J Neurochem. 2006;99(3):1019–1031. doi: 10.1111/j.1471-4159.2006.04150.x. [DOI] [PubMed] [Google Scholar]
- Kalueff AV, Wheaton M, Murphy DL. What’s wrong with my mouse model? Advances and strategies in animal modeling of anxiety and depression. Behav Brain Res. 2007;179(1):1–18. doi: 10.1016/j.bbr.2007.01.023. [DOI] [PubMed] [Google Scholar]
- Kim J, Gale K, Kondratyev A. Effects of repeated minimal electroshock seizures on NGF, BDNF and FGF-2 protein in the rat brain during postnatal development. Int J Dev Neurosci. 2010;28(3):227–232. doi: 10.1016/j.ijdevneu.2010.02.003. [DOI] [PMC free article] [PubMed] [Google Scholar]
- Klejbor I, Kucinski A, Wersinger SR, Corso T, Spodnik JH, Dziewiatkowski J, Morys J, Hesse RA, Rice KC, Miletich R, Stachowiak EK, Stachowiak MK. Serotonergic hyperinnervation and effective serotonin blockade in an FGF receptor developmental model of psychosis. Schizophr Res. 2009;113(2-3):308–321. doi: 10.1016/j.schres.2009.06.006. [DOI] [PMC free article] [PubMed] [Google Scholar]
- Lord C, Cook EH, Leventhal BL, Amaral DG. Autism spectrum disorders. Neuron. 2000;28(2):355–363. doi: 10.1016/s0896-6273(00)00115-x. [DOI] [PubMed] [Google Scholar]
- Martin LA, Goldowitz D, Mittleman G. Repetitive behavior and increased activity in mice with Purkinje cell loss: a model for understanding the role of cerebellar pathology in autism. Eur J Neurosci. 2010;31(3):544–555. doi: 10.1111/j.1460-9568.2009.07073.x. [DOI] [PMC free article] [PubMed] [Google Scholar]
- Moy SS, Nadler JJ, Magnuson TR, Crawley JN. Mouse models of autism spectrum disorders: the challenge for behavioral genetics. Am J Med Genet C Semin Med Genet. 2006;142C(1):40–51. doi: 10.1002/ajmg.c.30081. [DOI] [PubMed] [Google Scholar]
- Nicot A, Otto T, Brabet P, Dicicco-Bloom EM. Altered social behavior in pituitary adenylate cyclase-activating polypeptide type I receptor-deficient mice. J Neurosci. 2004;24(40):8786–8795. doi: 10.1523/JNEUROSCI.1910-04.2004. [DOI] [PMC free article] [PubMed] [Google Scholar]
- Palmen SJ, van Engeland H, Hof PR, Schmitz C. Neuropathological findings in autism. Brain. 2004;127(Pt 12):2572–2583. doi: 10.1093/brain/awh287. [DOI] [PubMed] [Google Scholar]
- Pobbe RL, Pearson BL, Defensor EB, Bolivar VJ, Blanchard DC, Blanchard RJ. Expression of social behaviors of C57BL/6J versus BTBR inbred mouse strains in the visible burrow system. Behav Brain Res. 2010;214(2):443–449. doi: 10.1016/j.bbr.2010.06.025. [DOI] [PMC free article] [PubMed] [Google Scholar]
- Ronald A, Happe F, Plomin R. Genetic research into autism. Science. 2006;311(5763):952. doi: 10.1126/science.311.5763.952a. [DOI] [PubMed] [Google Scholar]
- Scherf KS, Luna B, Kimchi R, Minshew N, Behrmann M. Missing the big picture: impaired development of global shape processing in autism. Autism Res. 2008;1(2):114–129. doi: 10.1002/aur.17. [DOI] [PMC free article] [PubMed] [Google Scholar]
- Silverman JL, Tolu SS, Barkan CL, Crawley JN. Repetitive self-grooming behavior in the BTBR mouse model of autism is blocked by the mGluR5 antagonist MPEP. Neuropsychopharmacology. 2010a;35(4):976–989. doi: 10.1038/npp.2009.201. [DOI] [PMC free article] [PubMed] [Google Scholar]
- Silverman JL, Turner SM, Barkan CL, Tolu SS, Saxena R, Hung AY, Sheng M, Crawley JN. Sociability and motor functions in Shank1 mutant mice. Brain Res. 2010b doi: 10.1016/j.brainres.2010.09.026. [DOI] [PMC free article] [PubMed] [Google Scholar]
- Sinkkonen ST, Homanics GE, Korpi ER. Mouse models of Angelman syndrome, a neurodevelopmental disorder, display different brain regional GABA(A) receptor alterations. Neurosci Lett. 2003;340(3):205–208. doi: 10.1016/s0304-3940(03)00123-x. [DOI] [PubMed] [Google Scholar]
- Sparks BF, Friedman SD, Shaw DW, Aylward EH, Echelard D, Artru AA, Maravilla KR, Giedd JN, Munson J, Dawson G, Dager SR. Brain structural abnormalities in young children with autism spectrum disorder. Neurology. 2002;59(2):184–192. doi: 10.1212/wnl.59.2.184. [DOI] [PubMed] [Google Scholar]
- Stokstad E. Development. New hints into the biological basis of autism. Science. 2001;294(5540):34–37. doi: 10.1126/science.294.5540.34. [DOI] [PubMed] [Google Scholar]
- Tabuchi K, Blundell J, Etherton MR, Hammer RE, Liu X, Powell CM, Sudhof TC. A neuroligin-3 mutation implicated in autism increases inhibitory synaptic transmission in mice. Science. 2007;318(5847):71–76. doi: 10.1126/science.1146221. [DOI] [PMC free article] [PubMed] [Google Scholar]
- Vaccarino FM, Grigorenko EL, Smith KM, Stevens HE. Regulation of cerebral cortical size and neuron number by fibroblast growth factors: implications for autism. J Autism Dev Disord. 2009;39(3):511–520. doi: 10.1007/s10803-008-0653-8. [DOI] [PMC free article] [PubMed] [Google Scholar]
- Walsh CA, Morrow EM, Rubenstein JL. Autism and brain development. Cell. 2008;135(3):396–400. doi: 10.1016/j.cell.2008.10.015. [DOI] [PMC free article] [PubMed] [Google Scholar]
- Yochum CL, Bhattacharya P, Patti L, Mirochnitchenko O, Wagner GC. Animal model of autism using GSTM1 knockout mice and early post-natal sodium valproate treatment. Behav Brain Res. 2010;210(2):202–210. doi: 10.1016/j.bbr.2010.02.032. [DOI] [PubMed] [Google Scholar]
- Young LJ. Oxytocin and vasopressin as candidate genes for psychiatric disorders: lessons from animal models. Am J Med Genet. 2001;105(1):53–54. [PubMed] [Google Scholar]
- Yu H, Yue P, Sun P, Zhao X. Self-grooming induced by sexual chemical signals in male root voles (Microtus oeconomus Pallas) Behav Processes. 2010;83(3):292–298. doi: 10.1016/j.beproc.2010.01.012. [DOI] [PubMed] [Google Scholar]
- Zhou X, Hossain WA, Rutledge A, Baier C, Morest DK. Basic fibroblast growth factor (FGF-2) affects development of acoustico-vestibular neurons in the chick embryo brain in vitro. Hear Res. 1996;101(1-2):187–207. doi: 10.1016/s0378-5955(96)00122-0. [DOI] [PubMed] [Google Scholar]