Abstract
We have adapted bioluminescence methods to be able to measure phosphodiesterase (PDE) activity in a one-step technique. The method employs a four-enzyme system (PDE, adenylate kinase (AK) using excess CTP instead of ATP as substrate, pyruvate kinase (PK), and firefly luciferase) to generate ATP, with measurement of the concomitant luciferase-light emission. Since AK, PK, and luciferase reactions are coupled to recur in a cyclic manner, AMP recycling maintains a constant rate of ATP formation, proportional to the steady-state AMP concentration in. The cycle can be initiated by the PDE reaction that yields AMP. As long as the PDE reaction is rate-limiting, the system is effectively at steady state and the bioluminescence kinetics progresses at a constant rate proportional to the PDE activity. In the absence of cAMP and PDE, low concentrations of AMP trigger the AMP cycling, which allows standardizing the system. The sensitivity of the method enables detection of <1 μU (pmol/min) of PDE activity in cell extracts containing 0.25-10 μg protein. Assays utilizing pure enzyme showed that 0.2 mM IBMX completely inhibited PDE activity. This single-step enzyme- and substrate-coupled cyclic-reaction system yields a simplified, sensitive, reproducible and accurate method to quantify PDE activities in small biological samples.
Keywords: phosphodiesterase, assay, bioluminescence
Introduction
3′,5′- cyclic AMP (cAMP) is an essential signaling molecule within numerous cell types. Deficient regulation of cAMP is linked to many pathophysiological conditions. Phosphodiesterases (PDE) are enzymes that degrade cyclic nucleotides, such as cAMP. PDE activity can be determined either by the amount of cAMP consumption or by the amount of AMP production per unit time. Since its discovery, different approaches have been employed to measure cAMP(1). Almost all existing methods use radioactive isotopes based on either separation techniques or competitive-binding assays.
Very recently, PDE assays have been devised that link AMP production to bioluminescence reactions. Comparative studies of different bioluminescence coupled methods, i.e., homogeneous time-resolved fluorescence (HTRF), scintillation proximity assay, or PDE Light™ show that these methods are essentially equivalent at least for determination the IC50 values for a set of PDE4 inhibitors(2). Another coupling system, producing a fluorescent indicator in a cyclic manner at a rate proportional to the total adenylate concentration, to measure low levels of cAMP, has been described(3). However, the method is complicated and time consuming, and necessitates multiple steps to destroy unwanted adenylates and the enzymes used for that purpose. Moreover, even if this method were sufficiently sensitive to determine total tissue cAMP, it does not provide a direct readout of the hydrolysis of cAMP into AMP catalyzed by biological extracts, which often contain less than micrograms quantities of protein.
Direct and sensitive methods to “micro-assay” cAMP- and cGMP-hydrolyzing PDE activities in small samples have also been developed(4-6). These methods, however, are relatively cumbersome, requiring several operator-dependent steps: at the end of the incubation period, when cAMP is converted to AMP, the extract is treated to convert AMP to ATP, and the samples are then subsequently analyzed for ATP content by the firefly luciferase-luciferin technique. Furthermore, it is necessary to assay samples with and without added cAMP, and the difference between the two values is used to calculate the enzyme activity(7).
To avoid radioactive waste accumulation and to prevent the interference of certain inhibitors used with immunocomplex formation in immunoprecipitation studies (as well as to simplify the work-flow), we have adapted these prior methods in order to measure the kinetics of PDE activity in a one-step technique, by using CTP at saturating excess, instead of ATP, as Adenylate Kinase substrate(8-10). Our method employs a four-enzyme system (PDE, adenylate kinase (AK), pyruvate kinase (PK), and firefly luciferase) to generate ATP and the concomitant luciferase light emission. Since the AK, PK, and luciferase reactions are coupled to recur in a cyclic manner, AMP cycling maintains a constant basal rate of ATP formation, and therefore a constant light emission. The cycle is initiated by the PDE reaction that increases the AMP concentration proportionally to the PDE activity present within the system. In the absence of cAMP and PDE, low concentrations of AMP trigger the AMP cycling described above, which allows standardizing the system by maintaining constant ATP concentration, and thus a constant level of light emission. The sensitivity of the method enables detection of as little as micro-units (μU) of pure PDE activity, and in cell and tissues extract containing 0.25 to 10 μg proteins. Assays utilizing pure PDE showed that 0.2 mM IBMX completely inhibited PDE activity.
A method closest to our modified method is available as PDELight Kit at Cambrex Bio Science Rockland, Inc. However, unlike that commercial system, our method gives a linear relationship between light emission and either AMP concentration for the case where PDE activity is assessed by the product of the reaction, or PDE activity where the pure enzyme is used to establish the standard curve. Moreover, since all chemicals and solutions are well defined in our method, the researcher is in full possession of the experiment and is not dependent upon a kit of an unknown composition.
Materials and Methods
Luciferase-luciferin Mix (LLM)
This Adenosine 5′-triphosphate (ATP) assay mix (FLAAM, Sigma) is prepared in accordance with the company recommendation.
AB
All solutions are prepared in an assay buffer (AB) containing 20 mM Hepes, 0.8 mM MgCl2, 0.3 mM KCl, 100 mM NaCl, 1 mM EGTA, 1.0276 mM CaCl2 to have 30 μM free Ca2+ (4), 0.5 mM DTT, pH 7.4.
AB-AMP
This buffer is used to construct the standard curve; the AB buffer contains 1.875 mM CTP and 1.875 mM PEP.
AB-PDE
This buffer is used to determine the PDE activity; the AB buffer contains 0.01875 mM cAMP, 1.875 mM CTP, 1.875 mM PEP.
Enzyme Mix
The AB buffer contains in 5 μL 0.5 U PK and 0.1 U AK
Standard curve
AMP dilutions used for standard curves were prepared in the same buffer as samples.
Assay Procedures
Instrumentation
Assays were performed in a 96 well plates (Corning* 96-Well Clear-Bottom Half-Area Microplates, Fisher scientific) at 30°C using a PerkinElmer Luminometer as well as the manufacturer provided computer programs for running the luminometer and Prizm application for performing calculations.
50 μL of LLM and 75 μL of AB-AMP (for standards) or AB-PDE (for samples) are added to each well. Light emission is recorded for 15 min approximately. This delay is necessary owing to the contamination of CTP, AMP, and cAMP with ATP that is converted to AMP by the luciferin-luciferase reaction.
5 μL of the enzyme mix are then added; the light emission is recorded until it reaches a steady state, 15 min approximately. The level of the light emission during this delay determines the sensitivity of the assay.
20 μL of AMP standards or samples containing PDE activity are then added and the light emission recorded; assays of PDE activities are performed on purified PDE or cell lysates and fractions. Calmodulin (PDE 1 activator, in 10U/ml concentration) was added when Ca-dependent PDE activity was measured.
Cell lysates to be analyzed should be filtered in order to remove contaminating ATP. We used GE* Healthcare PD MidiTrap* G-25 Sample Preparation Columns for sample filtration. Buffers, nucleotides standards, and enzyme solutions are prepared the day of use and kept on ice.
Reagents
Phosphodiesterase from bovine brain, Adenosine 5′-triphosphate (ATP) assay mix, Calmodulin from bovine heart, Myokinase (Adenylate kinase) from rabbit muscle, Pyruvate Kinase from rabbit muscle, cAMP, ATP, AMP, CTP, DTT, Protease Inhibitor Cocktail and all other chemicals used in this experiment are from Sigma. It is important to note that nucleotides used for the reaction should be maximally pure; ATP contamination can dramatically effect the reaction.
Cell Preparation
We used single ventricular myocytes in order to demonstrate the utility of the present assay method; cells were isolated from the rabbit hearts as previously described(11). Intact ventricular myocytes were homogenized in cell lysis buffer contained 20 mM HEPES (pH 7.4), 0.5 mM EDTA, 2 mM MgCl2, 0.1% Triton X-100, 0.5 mM DTT, 1mM EGTA and Protease Inhibitor Cocktail 3ul/ml. Cell suspension was sonicated on ice 3 times for 30 s separated by 1 min; the sonicator setting was 2. The cell lysate was filtered on G-25 Sample Preparation Column in order to remove ATP. Sample was eluted in AB buffer.
Results and Discussion
How the assay works
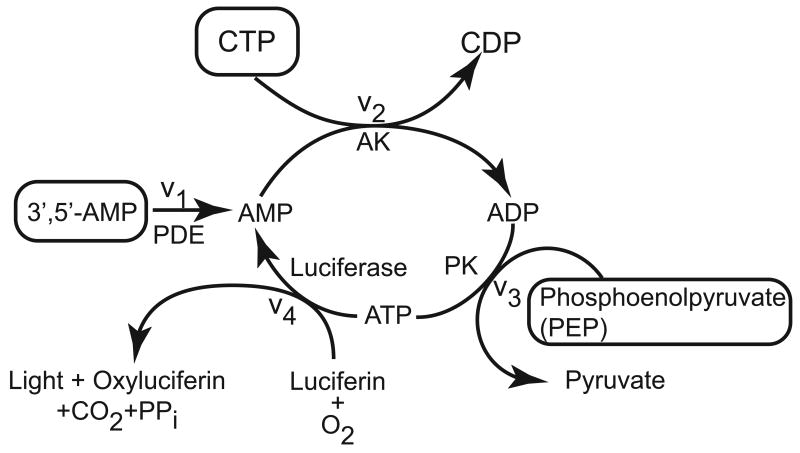
Figure 1 depicts the enzymatic coupling system. After cAMP is converted to 5′-AMP (AMP) by PDE (reaction v1), AMP is stoichiometrically converted to ATP in reactions catalyzed by AK (v2) and PK (v3), and luciferase (v4) that catalyzes the ATP-luciferin reaction that emits light. The level of enzyme activities is such that v1<v2<v3<v4, so the rate of light emission is directly proportional to PDE activity.
Figure 1.
Schematic of the coupled enzymatic reactions used in our bioluminescence assay to determine PDE activity by measuring the intensity of luciferase light emission. In the absence of cAMP and PDE, low concentrations of AMP trigger the AMP cycling described above, which allows standardization of the system by maintaining constant ATP concentration, and thus maintaining a constant level of light emission.
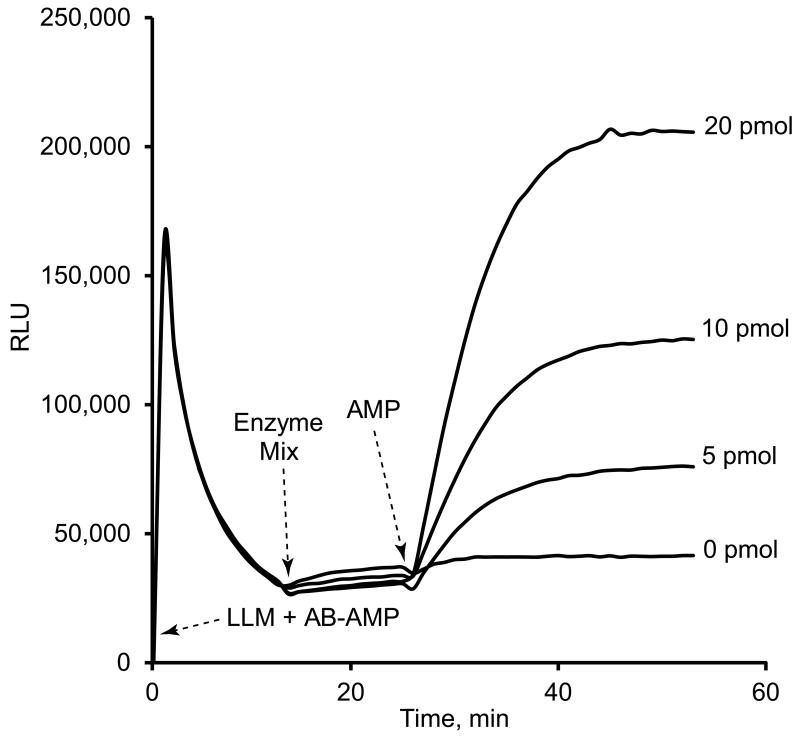
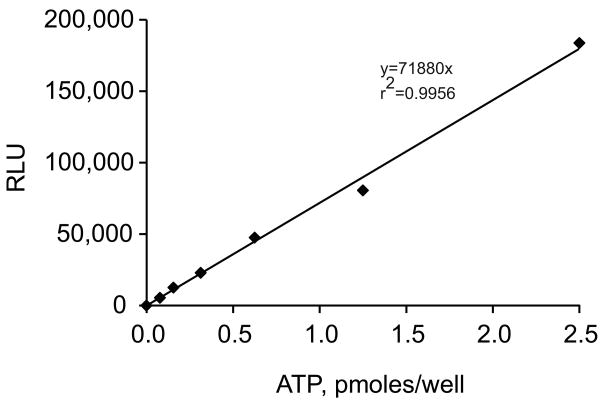
Figure 2 shows an example of the assay described above and demonstrated in Figure 1. At time zero there is a significant contamination with ATP (approximately 2.3 picomoles according to a standard curve obtained with ATP, Figure 3). Due to the luciferin-luciferase activity, the concentration of contaminant ATP decreases with time with a concomitant decrease in the light emission to a near stable value. The subsequent addition of AK and PK maintains a constant level of light emission, corresponding to an average ATP level of 0.55 picomoles produced by the recycling of the endogenous AMP (Figure 1) released from the ATP contaminated nucleotides.
Figure 2.
AMP Bioluminescence Coupled to the ATP-luciferin-luciferase Reaction. Reagents and instrumentation are described in Materials and Methods. The arrows indicate additions of different enzymatic mixtures. (1) LLM + AB-AMP are the luciferin-luciferase mix and the substrates, CTP and PEP, for adenylate kinase (AK) and pyruvate kinase (PK) reactions, respectively. This mixture is added to all wells. (2) Add the enzyme mixture containing AK and PK to all wells, and (3) the AMP standards are added to different wells, as indicated to the right of the traces.
Figure 3.
Luciferin-luciferase Bioluminescence Reaction Obtained with Standard ATP. With the same batch of the luciferin-luciferase mix, a close correlation between relative light units (RLU) and added ATP is usually observed, r2 = 0.9956, p < 0.001.
Construction of a standard curve
The initial rate of the kinetics of the light emission initiated by the AMP addition is a first order reaction . The highest AMP concentration used for the standard curve is 160 picomoles per well, corresponding to 1.05 μM, which is much lower than the Km value (35 μM) of the AK reaction(9) (v2 in Figure 1), which is the limiting step in the absence of PDE. Furthermore, when the ATP is substituted with another substrate, e.g., CTP in the present method, the Km values for AMP are much higher than that for ATP(10).
Analysis of the kinetics of this reaction system (Figure 1) shows that, under the defined conditions, the rate of ATP formation is equal to that of the AMP consumption before reaching a steady state when it becomes proportional to the added [AMP]0 as long as the reaction rates of v2, v3, and v4 remain in saturating conditions. This analysis, further shows that ATP concentration follows an exponential function related to the concentration of the added AMP and [AMP]0, , where K and K′ are related to the Michaelis constants and to the activities of reactions v2, v3, and v4. Since the amount of light emission expressed as Relative Light Units (RLU) is directly proportional to the ATP concentration (Figure 3), changing K to K″ to account for the proportionality coefficient, and rearranging the above equation to solve for RLU yields, .
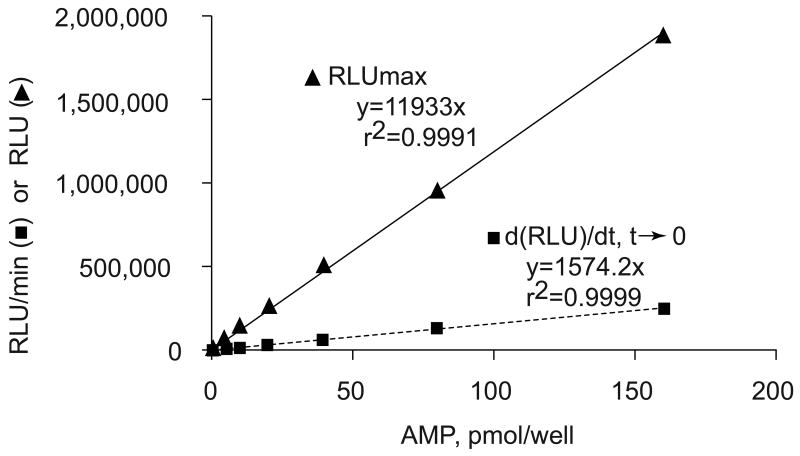
Based on this analysis, we may deduce that either the maximum of light emission, RLUmax in the steady state, or the initial rate of light emission obtained from the first derivative of the equation, should be proportional to the concentration of the added AMP. The experimental data fit perfectly with this model. Specifically, the kinetics of light emission, when RLU and the time are normalized to the AMP offset (Figure 2), are well fit by the same one phase exponential, in other words, both the initial and steady rates of light emission are directly proportional to the AMP concentrations (Figure 4). Either parameter can be used to determine cAMP concentrations as low as 35 nM (n.b., in the case when [cAMP] is to be measured, pure PDE should be added to the enzyme mix of the system described above).
Figure 4.
Luciferin-luciferase Bioluminescence reaction obtained with AMP coupled to ATP production. The values of the initial rates of light emission d(RLU)/dt,t→0 (dashed line) and the steady state RLUmax (solid line) are calculated according to the equations of the kinetics function and its first derivative, see the text.
Measurement of PDE activity
The present method that describes the assessment of cAMP hydrolysis by PDE is based on the bioluminescence of the ATP-luciferin-luciferase reaction coupled to the AMP produced during cAMP hydrolysis. PDE activities are determined from the initial rates (enzyme activity at zero time) as per convention (expressed as the amount of AMP produced per unit time). Because in the present reaction scheme, the kinetics of the PDE reaction are rate limiting and very slow compared to the rates of the cycle components, per se, that this reaction at each point of measurement is effectively at steady state from its initiation (Figures 6 and 8A). Thus, these PDE activities are calculated using the steady state portion of the RLU vs. [AMP] standard curves (Figure 4).
Figure 6.
Kinetics of PDE activity in presence of 10 units/mL of the PDE protein activator (Calmodulin). Reagents, instrumentation, and procedure are described under Materials and Methods. RLUs and time are normalized to the values at the PDE offset.
Figure 8.
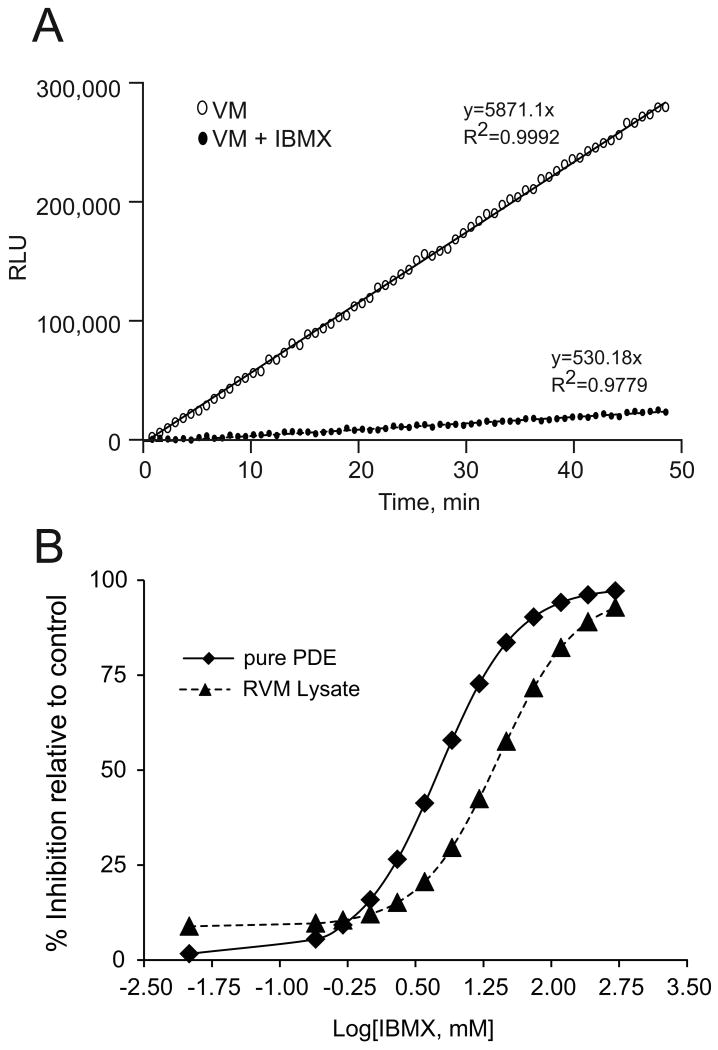
A. Example of PDE activities measurements in the absence and presence of 0.5 mM IBMX from ventricular cardiac myocyte lysates. See text for details. B. IBMX effects on cAMP-phosphodiesterase activities of pure PDE (bovine brain PDE in the presence of 10U/ml of Calmodulin) and rabbit ventricular myocytes lysates. Results are expressed as % inhibition of control.
In general the reaction rate is given by the Michaelis-Menten equation, . The Vm is obtained when the enzyme is saturated by the substrate, i.e., when [S] ≫ KM. By neglecting KM in the presence of [S] in the denominator, the reaction rate is the maximal rate (Vm = kcat.[E]0), and is directly proportional to the total concentration of the enzyme and to the rate constant kcat that characterizes the active site of the enzyme. In vitro, and in saturating conditions, changes in the maximal rate may be due to changes in the enzyme concentration or to the alteration of the active site.
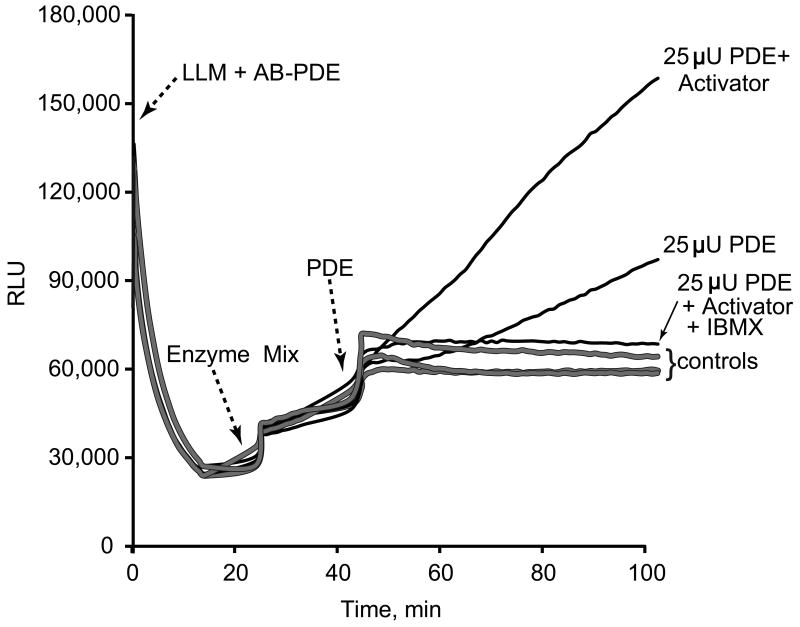
Figures 5 shows examples of the detection of PDE activity coupled to the ATP luciferin-luciferase reaction in a sample of pure PDE isolated from bovine brain. When the enzyme mixture is added to AB-PDE buffer, which contains cAMP, a certain level of AMP and ATP contamination may be introduced, explaining why these additions (contrary to the case of AB-AMP buffer alone (Figure 2)) results in some ATP production and an increase in luminescence. In the absence of calmodulin, the PDE activator(12), a latent period occurs prior to initiation of a first order kinetic reaction; this latency is not observed if calmodulin is added prior to starting the reaction. Addition of 0.2 mM IBMX, a non-specific inhibitor of phosphodiesterases(13), completely inhibits the enzyme activity.
Figure 5.
Bioluminescence detection of PDE activity. Reagents and instrumentation are described in Materials and Methods. The arrows indicate the additions of different enzymatic mixtures. 1) LLM + AB-PDE containing the luciferin-luciferase mix and the substrates cAMP, CTP, and PEP for phosphodiesterase (PDE), adenylate kinase (AK), and pyruvate kinase (PK) reactions are added to all wells, 2) the enzyme reagent containing AK and PK is also added to all wells, and 3) 25 μU of bovine brain PDE, Sigma, with and without Calmodulin (a PDE1 activator, 10U/ml), or with and without 0.2 mM IBMX are added to different wells as indicated to the right of the traces. Controls are assays without added PDE.
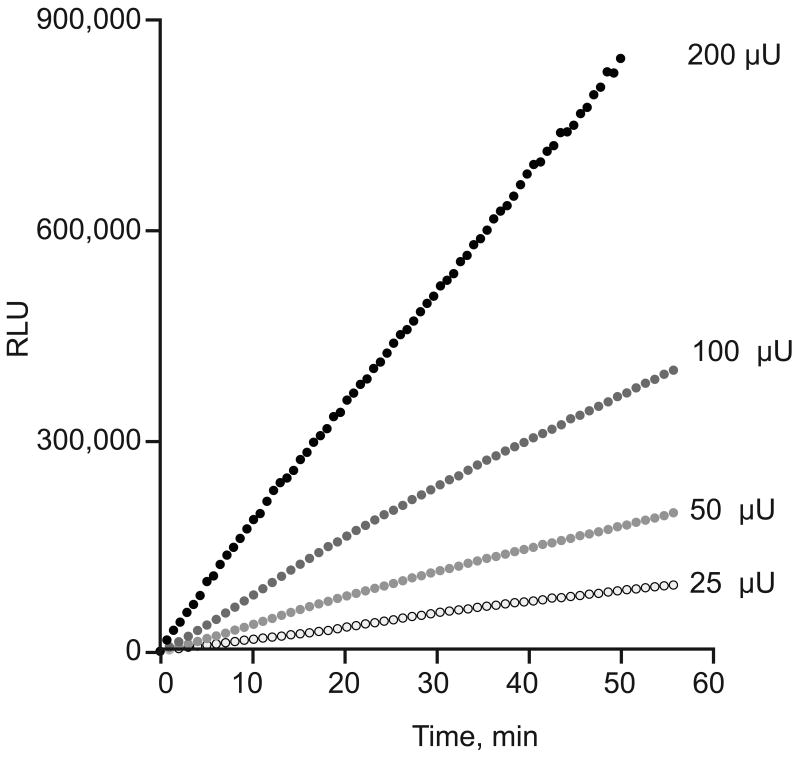
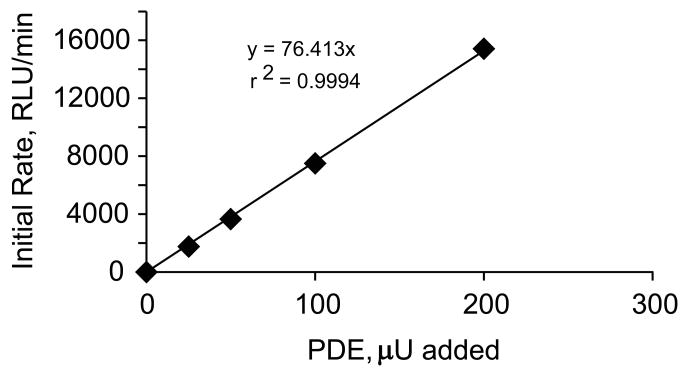
When RLU and time are normalized to the PDE offset the kinetics of PDE activity remain constant for as long as 60 min, consistent with the substrate (cAMP) concentration remaining essentially constant (Figure 6). In fact, the light emission observed after 60 min in presence of 200 μU corresponds to a negligible decrease in cAMP concentration relative to its initial value (i.e., of less than 150 pmoles consumed, compared to 1500 pmoles of cAMP added). These results show that the rate of light emission is a linear function of PDE activity (Figure 7).
Figure 7.
Linear relationship between the rate of light emission and the PDE activities added to the reaction medium of the AMP bioluminescence coupled to the ATP-luciferin-luciferase reaction.
In order to compare our assay with current established assays, we measured the IBMX effects both on pure PDE from bovine brain (Sigma), and on the PDE activity of a rabbit ventricular myocyte lysate. Figure 8A illustrates application of this new method to detection of PDE activity of rabbit ventricular myocytes. The biological assay shows linear kinetics that fit the model discussed above; the results from whole cell lysates (1.8 μg protein/experiment) give a PDE activity equivalent to 5871.1 RLU/min. From the steady-state standard curve, performed in conjunction with this experiment, we obtain the activity of 0.492 pmoles cAMP/min/experiment or 273 pmol/min/mg protein in ventricular myocytes lysates. The results also show that 0.5 mM IBMX inhibit 91% of PDE activity (Figure 8A).
Figure 8B illustrates the concentration-response curve for IBMX inhibition of PDE activity. In the absence of IBMX, the initial rate of pure PDE hydrolyzed 1.4 pmoles cAMP/min, corresponding to an activity of 140 nmol/min/mg protein. The IC50 values for pure PDE and the lysate are 5.6 μM and 26 μM, respectively. These values are comparable to those reported in the literature. Cardiac myocytes contain a number of distinct PDE isoforms (14,15) that have different IBMX sensitivities. In fact, IBMX is a nonselective PDE inhibitor with IC50 values ranging from 2 to 50 μM(13,16,17) but does not effectively inhibit PDE8 activity at concentration up to 200 μM(18-21). Thus, the IBMX IC50 value for the ventricular myocytes lysates shown here represents that of the ensemble PDE isoforms and their relative abundance in that tissue.
Abbreviations used
- AK
adenylate kinase
- CTP
Cytidine triphosphate
- IBMX
3-Isobutyl-1-methylxanthine
- LLM
Luciferase-Luciferin Mix
- PDE
phosphodiesterase
- PEP
phosphoenolpyruvate
- PK
pyruvate kinase
- RLU
relative light unit
- SANC
sinoatrial node isolated cells
Footnotes
This work was supported by the National Institutes of Health Intramural Research Program, NIA.
One unit will hydrolyze 1.0 μmole of 3′, 5′-cyclic-AMP to 5′-AMP per min at pH 7.5 at 30 °C.
Publisher's Disclaimer: This is a PDF file of an unedited manuscript that has been accepted for publication. As a service to our customers we are providing this early version of the manuscript. The manuscript will undergo copyediting, typesetting, and review of the resulting proof before it is published in its final citable form. Please note that during the production process errors may be discovered which could affect the content, and all legal disclaimers that apply to the journal pertain.
References
- 1.Beavo JA, Brunton LL. Nat Rev Mol Cell Biol. 2002;3(9):710–718. doi: 10.1038/nrm911. [DOI] [PubMed] [Google Scholar]
- 2.Hamon J, Whitebread S, Techer-Etienne V, Le Coq H, Azzaoui K, Urban L. Future Med Chem. 2009;1(4):645–665. doi: 10.4155/fmc.09.51. [DOI] [PubMed] [Google Scholar]
- 3.Breckenridge BM. Proc Natl Acad Sci U S A. 1964;52:1580–1586. doi: 10.1073/pnas.52.6.1580. [DOI] [PMC free article] [PubMed] [Google Scholar]
- 4.Weiss B, Lehne R, Strada S. Anal Biochem. 1972;45(1):222–235. doi: 10.1016/0003-2697(72)90022-x. [DOI] [PubMed] [Google Scholar]
- 5.Fertel R, Weiss B. Methods Enzymol. 1978;57:94–106. [Google Scholar]
- 6.Lundin A, Hasenson M, Persson J, Pousette A. Methods in enzymology. 1986;133:27–42. doi: 10.1016/0076-6879(86)33053-2. [DOI] [PubMed] [Google Scholar]
- 7.Strehler BL, Totter JR. Archives of biochemistry and biophysics. 1952;40(1):28–41. doi: 10.1016/0003-9861(52)90070-2. [DOI] [PubMed] [Google Scholar]
- 8.Brovko L, Romanova NA, Ugarova NN. Analytical biochemistry. 1994;220(2):410–414. doi: 10.1006/abio.1994.1358. [DOI] [PubMed] [Google Scholar]
- 9.Ito Y, Tomasselli AG, Noda LH. Eur J Biochem. 1980;105:85–92. doi: 10.1111/j.1432-1033.1980.tb04477.x. [DOI] [PubMed] [Google Scholar]
- 10.Tomasselli AG, Noda LH. European journal of biochemistry / FEBS. 1983;132(1):109–115. doi: 10.1111/j.1432-1033.1983.tb07333.x. [DOI] [PubMed] [Google Scholar]
- 11.Capogrossi MC, Kort AA, Spurgeon HA, Lakatta EG. The Journal of general physiology. 1986;88(5):589–613. doi: 10.1085/jgp.88.5.589. [DOI] [PMC free article] [PubMed] [Google Scholar]
- 12.Waisman D, Stevens FC, Wang JH. Biochemical and biophysical research communications. 1975;65(3):975–982. doi: 10.1016/s0006-291x(75)80481-5. [DOI] [PubMed] [Google Scholar]
- 13.Beavo JA, Rogers NL, Crofford OB, Hardman JG, Sutherland EW, Newman EV. Molecular pharmacology. 1970;6(6):597–603. [PubMed] [Google Scholar]
- 14.Verde I, Vandecasteele G, Lezoualc'h F, Fischmeister R. British journal of pharmacology. 1999;127(1):65–74. doi: 10.1038/sj.bjp.0702506. [DOI] [PMC free article] [PubMed] [Google Scholar]
- 15.Haworth RS, Cuello F, Avkiran M. Basic research in cardiology. 2011;106(1):51–63. doi: 10.1007/s00395-010-0116-1. [DOI] [PMC free article] [PubMed] [Google Scholar]
- 16.Wang H, Yan Z, Yang S, Cai J, Robinson H, Ke H. Biochemistry. 2008;47(48):12760–12768. doi: 10.1021/bi801487x. [DOI] [PMC free article] [PubMed] [Google Scholar]
- 17.Beavo JA, Hansen RS, Harrison SA, Hurwitz RL, Martins TJ, Mumby MC. Mol Cell Endocrinol. 1982;28(3):387–410. doi: 10.1016/0303-7207(82)90135-6. [DOI] [PubMed] [Google Scholar]
- 18.Fisher DA, Smith JF, Pillar JS, St Denis SH, Cheng JB. Biochemical and biophysical research communications. 1998;246(3):570–577. doi: 10.1006/bbrc.1998.8684. [DOI] [PubMed] [Google Scholar]
- 19.Soderling SH, Bayuga SJ, Beavo JA. Proc Natl Acad Sci U S A. 1998;95(15):8991–8996. doi: 10.1073/pnas.95.15.8991. [DOI] [PMC free article] [PubMed] [Google Scholar]
- 20.Gamanuma M, Yuasa K, Sasaki T, Sakurai N, Kotera J, Omori K. Cell Signal. 2003;15(6):565–574. doi: 10.1016/s0898-6568(02)00146-8. [DOI] [PubMed] [Google Scholar]
- 21.Hayashi M, Matsushima K, Ohashi H, Tsunoda H, Murase S, Kawarada Y, Tanaka T. Biochem Biophys Res Commun. 1998;250(3):751–756. doi: 10.1006/bbrc.1998.9379. [DOI] [PubMed] [Google Scholar]


