Abstract
The signal transduction networks that initiate multicellular development in bacteria remain largely undefined. Here, we report that Myxococcus xanthus regulates entry into its multicellular developmental program using a novel strategy: a cascade of transcriptional activators known as enhancer binding proteins (EBPs). The EBPs in the cascade function in sequential stages of early development, and several lines of evidence indicate that the cascade is propagated when EBPs that function at one stage of development directly regulate transcription of an EBP gene important for the next developmental stage. We also show that the regulatory cascade is designed in a novel way that extensively expands on the typical use of EBPs: Instead of using only one EBP to regulate a particular gene or group of genes, which is the norm in other bacterial systems, the cascade uses multiple EBPs to regulate EBP genes that are positioned at key transition points in early development. Based on the locations of the putative EBP promoter binding sites, several different mechanisms of EBP coregulation are possible, including the formation of coregulating EBP transcriptional complexes. We propose that M. xanthus uses an EBP coregulation strategy to make expression of EBP genes that modulate stage-stage transitions responsive to multiple signal transduction pathways, which provide information that is important for a coordinated decision to advance the developmental process.
Keywords: σ54 promoters, biofilms, two-component systems
Historically, multicellular development was a trait associated with eukaryotes. In recent years, however, it has become apparent that most bacteria have the capacity for multicellular development when they are living in the appropriate natural environment. There are some well-characterized examples of multicellular development in bacteria that are ecologically important, such as the formation of nitrogen-fixing heterocysts in some species of photosynthetic cyanobacteria (1), and medically important, such as the formation of pathogenic biofilms by Pseudomonas aeruginosa (2). Despite the discovery of many forms of multicellular bacterial development and our progress toward understanding their functions, the genetic networks that regulate the decision to initiate these processes remain, in general, poorly defined. In this paper, we report the discovery of a novel cascade of transcriptional activators that regulates the decision to initiate the multicellular developmental program of the bacterium Myxococcus xanthus.
Like many other species of bacteria, M. xanthus initiates development when its supply of nutrients begins to run out. In nature, M. xanthus cells obtain nutrients by swarming and feeding on colonies formed by Gram-negative and Gram-positive prey bacteria (3). When prey are scarce, there is a critical point at which the swarm stops expanding outward in search of food and starts retreating inward to build multicellular fruiting bodies that contain stress-resistant spores. How does M. xanthus identify the point at which its state of starvation justifies switching on fruiting body and spore development? This is a difficult task because development must be switched on before any nutrient essential for protein synthesis has completely vanished; many new proteins are made during fruiting body development (4, 5). Consequently, M. xanthus must predict that the nutrient supply is trending toward exhaustion so that it can divert all its remaining resources to the construction of spore-filled fruiting bodies. Although development ensures that the entire population of cells does not die from starvation, it comes with a steep price; under laboratory conditions, only 0.1–10% of cells that enter development survive as dormant spores. Hence, a decision to initiate development when the nutrient shortage is only temporary can be quite costly to a population of M. xanthus cells.
To determine whether starvation is prolonged enough and severe enough to initiate development, M. xanthus uses the stringent response and a diffusible extracellular quorum signal called A-signal (6–9). Limiting concentrations of any amino acid, or starvation for carbon, energy, or phosphate, induces a stringent response and accumulation of the intracellular starvation signal (p)ppGpp (10). Accumulation of (p)ppGpp is both necessary and sufficient to initiate the transition from vegetative growth to development (11, 12). It is also required for production of A-signal (12), which is a cell density signal composed of amino acids (7–9). The accumulation of A-signal indicates that a population of starving cells has reached the critical number required to build a fruiting body. Once this condition is met, M. xanthus cells initiate an ordered series of morphological changes that include the formation of aggregation centers, the construction of a domed-shaped fruiting body, and the differentiation of cells inside the fruiting body into stress-resistant spores.
The goal of this study was to understand better the regulatory processes that control the crucial decision to enter the M. xanthus developmental cycle. Here, we describe a vital cascade of six transcriptional activators that responds to starvation and regulates the onset and early steps of development. These activators work with a single type of promoter, the σ54 promoter. They are often referred to as enhancer binding proteins (EBPs) because they bind to specific tandem repeat enhancer sequences that are usually found upstream of the σ54-RNA polymerase binding sites in the −12 and −24 regions of σ54 promoters. Because σ54-RNA polymerase requires EBP-catalyzed ATP hydrolysis to initiate transcription (13–15), EBP-dependent genes can be expressed or completely turned off as needed during development. Typically, EBPs activate gene expression in response to a specific interaction with a signal transduction partner that detects a particular environmental cue (16, 17). Eighteen such EBP signal transduction systems, including those associated with the cascade, have been linked to fruiting body development (18–27). We suggest that the EBPs in the cascade begin to operate in response to signal transduction partners that evaluate important early developmental cues. The operational sequence of these EBPs is known: Nla4 and Nla18 regulate the transition from vegetative growth to development (28, 29); Nla6 and Nla28 begin to activate developmental genes when cells enter the preaggregation stage [our DNA microarray data in the Gene Expression Omnibus (accession no. GSE13523)] (24); and ActB and MXAN4899 are crucial for expression of developmental genes when cells enter and are well into the aggregation stage, respectively (26, 30). Hence, pairs of cascade EBPs operate in serial stages of development. In this work, we show that the cascade is designed such that EBP pairs functioning at one stage of development are directly responsible for expression of an EBP gene important for the next developmental stage. This finding suggests that M. xanthus uses its early developmental EBPs in a manner that parallels the use of a σ-factor cascade by Bacillus subtilis during sporulation (31). We also show that the cascade uses a novel strategy of EBP coregulation to make expression of EBP genes that modulate stage-stage transitions responsive to multiple signal transduction pathways. Presumably, the integration of information from multiple signal transduction circuits is important for M. xanthus cells to make a coordinated decision to advance the developmental process.
Results
Preaggregation and Aggregation EBP Genes Are Expressed in Sequence.
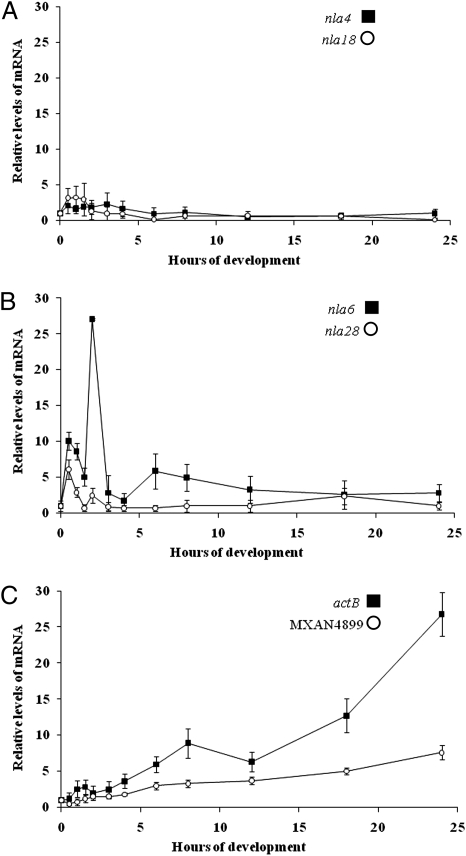
Pairs of the early developmental EBPs of M. xanthus function in serial stages of development: the transition from vegetative growth to development, preaggregation, and aggregation. To test whether the temporal ordering of EBP function is attributable, at least in part, to the sequential expression of the EBP genes themselves, we monitored the pattern of EBP gene expression in WT cells during 24 h of development using quantitative PCR (QPCR) (Fig. 1). Expression of nla4 mRNA remained relatively constant over the developmental time course, and, with the exception of a slight rise in the first hour of development, nla18 mRNA showed a similar steady pattern of expression (Fig. 1A). The data in Fig. 1 B and C revealed that the preaggregation EBP genes (nla6 and nla28) and the aggregation EBP genes (actB and MXAN4899) are temporally regulated. The initial increase in nla6 mRNA and nla28 mRNA was detected at the beginning of preaggregation, whereas an increase in actB mRNA and MXAN4899 mRNA was first detected at the interface of preaggregation and aggregation. These data show that developmental expression of the preaggregation- and aggregation-stage EBP genes occurs in sequence; expression of nla6 and nla28 begins earlier than that of actB and MXAN4899.
Fig. 1.
Expression of EBP genes during the development of fruiting bodies. QPCR was used to examine developmental expression of nla4 and nla18 (A), nla6 and nla28 (B), and actB and MXAN4899 (C) in WT cells. EBP gene mRNA levels were normalized to that of 16S rRNA at 0 h (vegetative growth). The values shown are means derived from three replicates. Error bars are SDs of the means.
Early-Acting EBPs Form a Transcriptional Cascade.
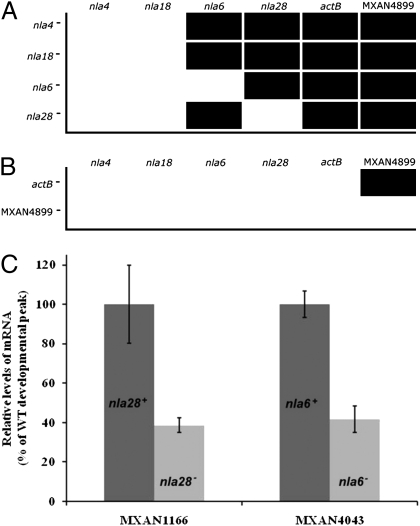
The DNA microarray expression profiles of the nla mutants were inspected to examine whether there is a transcriptional hierarchy among the early-acting EBP genes (Fig. 2A). For this analysis, we compared peak developmental expression of nla, actB, and MXAN4899 EBP genes in nla mutant strains with their expression in WT cells. To be significant, an nla mutation had to reduce peak expression of a particular EBP gene at least 1.5-fold relative to the WT (Methods). As expected, the DNA microarray data revealed that nla4 and nla18 mutations, which affect the vegetative growth-to-development transition, reduced expression of the preaggregation-stage and aggregation-stage EBP genes. The nla4 mutation did not, however, affect expression of nla18, nor did the nla18 mutation affect expression of nla4; neither is downstream of the other. Mutations in the EBP genes nla6 and nla28 affected expression of the downstream-functioning actB and MXAN4899 genes but not expression of the upstream-functioning nla4 and nla18 genes. In addition, nla6 and nla28 appear to cross-regulate each other; the nla6 mutation affects expression of nla28 and vice versa. Because previous data suggested that MXAN4899 functions downstream of ActB (26, 30), we used QPCR to test whether expression of the MXAN4899 gene depends on the presence of a WT copy of actB. Indeed, peak post-starvation expression of MXAN4899 mRNA was 10-fold lower in an actB mutant than in WT cells (Fig. 2B), indicating that full expression of the MXAN4899 gene does depend on ActB. We also tested whether mutations in actB and MXAN4899 reduce expression of upstream-functioning EBP genes using QPCR. As expected, neither mutation caused expression of mRNA from an upstream-functioning EBP gene to fall below WT levels (Fig. 2B). Taken together, the expression data suggest that the developmental EBPs constitute a transcriptional cascade in which each EBP is important for expression of its downstream-functioning EBP genes.
Fig. 2.
Developmental expression of EBP genes and EBP gene operons in EBP gene mutants. Peak developmental expression of EBP genes was determined using DNA microarray analysis (A) or QPCR (B). A bar indicates that peak developmental expression of the EBP gene was reduced 1.5-fold or greater in the nla or actB mutant compared with WT cells. No bar indicates that peak developmental expression of the EBP gene was not reduced 1.5-fold in the nla mutant, actB mutant or MXAN4899 mutant compared with WT cells. EBP gene autoregulation was not tested in A or B. (C) Expression of MXAN1166, which is in the nla28 operon, and MXAN4043, which is in the nla6 operon, is shown in WT cells and in cells carrying an nla28 and nla6 mutation, respectively. Expression was monitored using DNA microarrays and confirmed using QPCR. The mean peak expression levels of MXAN4043 and MXAN1166 in nla mutant cells are shown as a percentage of those found in WT cells. The means were derived from at least three replicates. Error bars are SDs of the means.
EBPs Bind to the Promoters of EBP Genes That Function Downstream.
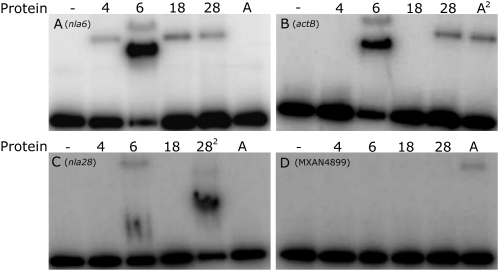
To examine the possibility that the cascade EBPs directly regulate EBP genes that function downstream, we searched the promoter regions of the nla, actB, and MXAN4899 operons for potential σ54-RNAP recognition sites using the PromScan bioinformatics tool (32). All the EBP operons except nla18 have putative σ54 promoters, suggesting that M. xanthus might, apart from nla18, use direct transcriptional regulation to link EBPs and downstream-functioning EBP genes. To examine direct regulation within the EBP cascade further, we performed EMSAs with end-labeled fragments of the putative promoter regions of the nla4, nla6, nla28, actB, and MXAN4899 operons; a control for binding specificity; and different concentrations of the purified DNA binding domain (DBD) of the Nla and ActB EBPs (Fig. 3). The control fragment contains the M. xanthus dev promoter, which is not a σ54 promoter (33). The Nla- and ActB-DBDs failed to bind to the end-labeled dev promoter fragment at any of the concentrations that were tested (Fig. S1A). They also failed to bind to the end-labeled fragment of the nla4 promoter region (Fig. S1B). However, we found that each EBP-DBD was capable of binding to at least one end-labeled fragment of the remaining EBP gene operon promoters when we used a concentration of 1–5 μM. As shown in Fig. 3A, Nla4-DBD and Nla18-DBD bound to the promoter region of the downstream-acting nla6 operon. In the case of Nla6-DBD and Nla28-DBD, we detected binding to the promoter region of the downstream-acting actB operon (Fig. 3B), indicating that nla6 and nla28 feed into the actB-mediated sporulation pathway independently. This result is consistent with the genetic data in Table 1: An nla6 nla28 double mutation has a synergistic effect on sporulation, and the double mutant's sporulation defect resembles that of the actB mutant more closely than either of the nla single mutants. We also found that Nla6-DBD is capable of binding to a fragment of the nla28 operon promoter region (Fig. 3C) and that Nla28-DBD is capable of binding to a fragment of the nla6 operon promoter region (Fig. 3A). Perhaps the cross-regulation between nla6 and nla28 ensures that expression of these EBP genes is coordinated, which is likely to be critical, given that both Nla6 and Nla28 are important for production of mature spores (Table 1). As shown in Fig. 3D, we detected ActB-DBD binding to the promoter region of the downstream-acting MXAN4899 operon. We did not, however, detect MXAN4899-DBD binding to any of the EBP gene operon promoter fragments that were tested here. These results suggest that M. xanthus EBPs form a regulatory cascade in which EBPs that function at one stage of fruiting body development activate transcription of an EBP gene needed for the next developmental stage by directly binding to the promoter of that EBP gene.
Fig. 3.
EMSAs with EBP-DBDs and DNA fragments containing putative EBP operon promoters. The assays were performed with fragments of the nla6 (A), actB (B), nla28 (C), and MXAN4899 (D) promoter regions and the following EBP-DBDs: none (lane 1), Nla4-DBD (lane 2), Nla6-DBD (lane 3), Nla18-DBD (lane 4), Nla28-DBD (lane 5), and ActB-DBD (lane 6). In lanes denoted with a superscripted 2 (B, lane 6 and C, lane 5), the P2 fragment of the indicated promoter is shown (Figs. 6 and 7).
Table 1.
Developmental phenotypes of EBP mutants*
| Strain | Aggregation† | Spore no.‡ | Viable spore no.§ |
| WT | + | 100.0 ± 8.5 | 100.0 ± 19 |
| actB | ± | 1.2 ± 0.8 | <0.001 |
| nla6 | ± | 8.5 ± 2.0 | 0.2 ± 0.2 |
| nla28 | ± | 108.1 ± 2.1 | 2.1 ± 1.5 |
| nla6 nla28 | ± | 0.5 ± 0.2 | 0.02 ± 0.2 |
*Cells were placed on TPM [10 mM Tris-HCl, (pH 8.0), 1.0 mM KH2PO4, and 8 mM MgSO4] agar and allowed to develop for 5 d. Mean values (±SDs) for the spore assays are shown as percentages of DK1622 (WT).
†+, produced normal-looking fruiting bodies; ±, produced normal-looking fruiting bodies, but aggregation was delayed.
‡These values were determined by counting the number of spherical-shaped spores using a Petroff–Hausser chamber and phase-contrast microscopy. Means (±SDs) derived from three independent experiments are shown.
§These values were determined by transferring sonication- and heat-resistant spores to CTTYE agar plates, incubating the plates for 5 d, and counting the number of colonies that arose from the spores. Means (±SDs) derived from three independent experiments are shown.
Because the paradigm for EBP-mediated transcription in bacteria is that each σ54 promoter is activated by only one EBP, it is intriguing that multiple EBP-DBDs bound to the promoter region of nla6 and nla28, which begin functioning at the onset of preaggregation, and actB, which begins functioning at the onset of aggregation. The results presented in Fig. 3 A–C suggest that transcription of the nla6, nla28, and actB operons is also subjected to autoregulation; Nla6-DBD, Nla28-DBD, and ActB-DBD were capable of binding to fragments containing the promoter regions of the nla6, nla28, and actB operons, respectively. These findings are consistent with previous work showing that expression of genes in the actB operon is reduced in an actB mutant (34). They are also consistent with the data in Fig. 2C showing that expression of MXAN4043, which was placed in the nla6 operon (35), is reduced in the nla6 mutant and expression of MXAN1166, which was placed in the nla28 operon (35), is reduced in the nla28 mutant. The implication of these results and those presented in Fig. 3 is that M. xanthus uses a novel system of EBP coregulation to modulate transcription of EBP genes that are positioned at stage-stage transition points.
EBP Genes Positioned at Stage-Stage Transition Points Use σ54 Promoter Elements.
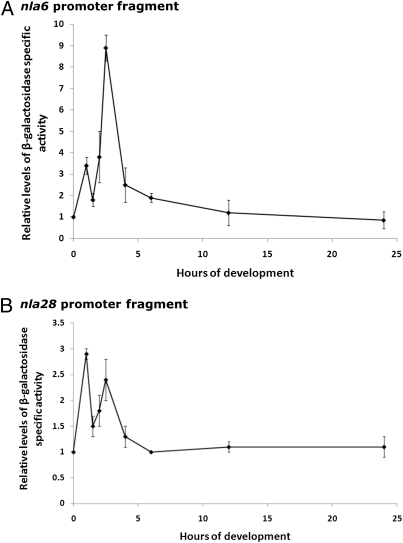
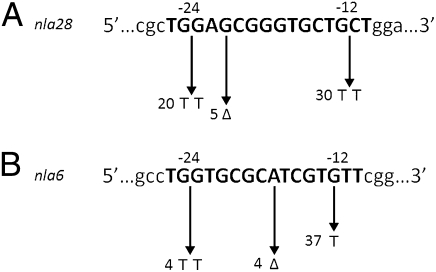
The apparent coregulation of actB, nla6, and nla28 by two or more EBPs suggests that EBP genes functioning at stage-stage transitions are under transcriptional control of σ54 promoter elements. The hallmarks of the σ54 family of promoters are the GC dinucleotide in the −12 region, GG dinucleotide in the −24 region, and strict 10-bp spacing between the conserved dinucleotides in the −12 and −24 regions (36). In contrast, the σ70 promoter family, which is the other family of bacterial promoters, has conserved sequences centered around their −10 and −35 regions. The optimal spacing between the −10 and −35 regions is 17 ± 1 bp, but a spacer region between 15 and 20 bp is tolerated in some σ70 promoters (36). The mutational analysis of Gronewold and Kaiser (34) provided strong evidence that developmental expression of the actB operon is controlled by a σ54 promoter. To confirm that the nla6 and nla28 operons use σ54 promoters, a 418-bp DNA fragment of the nla28 promoter region and a 207-bp fragment of the nla6 promoter region were used to perform a mutational analysis. Neither fragment contains sequences with a good match to the σ70 promoter consensus. However, the nla28 promoter fragment contains a putative σ54 promoter and two putative enhancer elements (see Fig. 6A), and the nla6 promoter fragment contains a putative σ54 promoter and four putative enhancer elements (see Fig. 8). WT and mutant promoters were cloned into a plasmid to create lacZ transcriptional fusions, and strains with the promoter fusion plasmids integrated at the Mx8 phage attachment site in the chromosome were generated. The WT nla6 and nla28 promoter fragments produced developmental lacZ expression patterns that were similar to those previously observed for the nla6 and nla28 genes (compare Fig. 1B with Fig. 4), respectively. These results indicate that the 418-bp fragment contains the developmental promoter of the nla28 operon and the 207-bp fragment contains the developmental promoter of the nla6 operon. When a TT is substituted for the GC dinucleotide in the −12 region or for the GG dinucleotide in the −24 region of the nla28 promoter, lacZ expression is reduced about three- to fivefold relative to that of the WT nla28 promoter (Fig. 5A). A GG-to-TT substitution in the −24 region of the nla6 promoter reduced lacZ expression 25-fold relative to that of the WT nla6 promoter (Fig. 5B). Like the Escherichia coli pspA promoter, which is a confirmed σ54 promoter (37, 38), the −12 region of the nla6 promoter has a GT dinucleotide instead of a GC dinucleotide. When this G is replaced by a T, lacZ expression from the nla6 promoter is reduced about threefold compared with that of the WT nla6 promoter (Fig. 5B). In addition, a 1-bp deletion that changes the crucial spacing between the −12 and −24 regions of the nla6 or nla28 promoter reduced lacZ expression about 20-fold relative to that of the corresponding WT promoter (Fig. 5). All the nla6 and nla28 promoter mutations significantly reduced or abolished the spikes in lacZ expression that occur in early development. Together, these findings indicate that the EBP coregulated nla6 and nla28 promoters are indeed σ54 promoter elements.
Fig. 6.
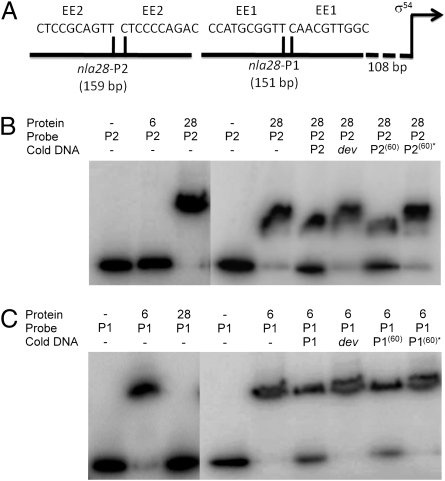
EMSAs with Nla6-DBD and Nla28-DBD as well as the promoter region of the nla28 operon. (A) nla28 promoter region. The location of the σ54 promoter is indicated by the arrow. The lengths of the P1 and P2 fragments are shown in parentheses. The sequences and locations of the putative EE1 and EE2 enhancer element half sites are shown above their corresponding promoter fragment. EMSAs were performed using Nla28-DBD or Nla6-DBD and end-labeled P2 promoter fragment (B) or Nla6-DBD or Nla28-DBD and end-labeled P1 promoter fragment (C). A 100-fold excess of the following unlabeled promoter fragments (cold DNA) was added for competition assays: P2 (lane 6), dev (lane 7), P2(60) (lane 8), and P2(60)* (lane 9) (all in B) and P1 (lane 6), dev (lane 7), P1(60) (lane 8), and P1(60)* (lane 9) (all in C).
Fig. 8.
Putative enhancer elements in the promoter region of the nla6 operon. The putative σ54-RNA polymerase binding site is underlined. The putative EE1, EE2, EE3, and EE4 enhancer element half sites are shown in boxes. ‡Two half sites for EE3 form an inverted repeat.
Fig. 4.
Developmental lacZ expression patterns of the WT nla6 and nla28 promoter fragments. Fragments of the nla6 (A) and nla28 (B) promoter regions were cloned into a promoterless lacZ expression vector and integrated into the Mx8 phage attachment site in the M. xanthus chromosome. Mean β-galactosidase–specific activities were determined at various times in development from six to nine replicates. The mean β-galactosidase–specific activities shown are relative to that found at 0 h (vegetative growth). The error bars indicate SDs of the mean.
Fig. 5.
Effect of mutations on the nla28 and nla6 promoter elements. The DNA sequences of the putative σ54 promoters from the nla28 (A) and nla6 (B) operons are shown. Nucleotides within the promoters that were deleted (Δ) or replaced with the indicated bases are shown after the arrowheads. WT and mutant promoters were cloned into a plasmid to create lacZ transcriptional fusions, and strains with the promoter fusion plasmids integrated at the Mx8 phage attachment site in the chromosome were generated. The β-galactosidase–specific activities in cells carrying WT or mutant promoters fused to lacZ were determined at various times in development. The numbers shown after the arrowheads are the relative activities of mutant promoters at the time of peak WT promoter activity.
Promoters of EBP Genes Positioned at Stage-Stage Transition Points Contain Putative Enhancers for Each of Their Coregulating EBPs.
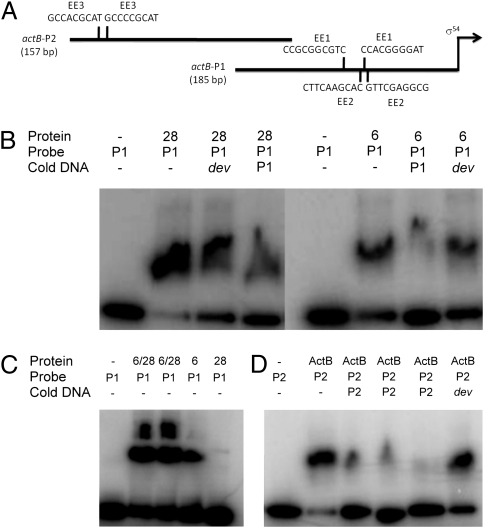
In an additional set of experiments, we explored the idea that each coregulating EBP has its own enhancer element for recognition of the actB and nla promoters, which is our prediction based on work in model bacterial systems (39–41). We decided to focus on the nla28 promoter region because the putative enhancer elements are separated by over 100 bp and, as a consequence, they could be independently tested for EBP binding. In the nla28 promoter region, we identified a putative enhancer element (nla28EE1) that might serve as the Nla6 binding site and a putative enhancer element (nla28EE2) that might serve as the Nla28 binding site (Fig. 6A). These putative enhancers were identified by looking for similar tandem repeats in the promoter fragments that were positive for Nla6-DBD binding or for Nla28-DBD binding (Table S1). The EMSAs in Fig. 6 B and C, which are consistent with those presented in Fig. 3C, show that Nla28-DBD binds to the end-labeled nla28-P2 probe, which is a fragment of the nla28 promoter region that contains nla28EE2, but not to the end-labeled nla28-P1 probe, which is a fragment of the nla28 promoter region that contains nla28EE1. To test the specificity of Nla28-DBD binding to nla28-P2, we performed competition assays with a 100-fold excess of unlabeled nla28-P2. As shown in Fig. 6B, we found that the ratio of Nla28-DBD–bound/unbound nla28-P2 probe decreased, indicating that unlabeled nla28-P2 is an effective competitor for Nla28-DBD binding. In competition assays with a 100-fold excess of unlabeled dev, which is the negative control promoter fragment, there was no observable effect on this ratio (Fig. 6B), indicating that Nla28-DBD binding to nla28-P2 is specific. In contrast to Nla28-DBD, Nla6-DBD binds to the end-labeled nla28-P1 probe, but it shows no observable binding to the end-labeled nla28-P2 probe (Figs. 3C and 6 B and C). In competition assays with a 100-fold excess of unlabeled nla28-P1 or unlabeled dev, only nla28-P1 served as an effective competitor (Fig. 6C), indicating that Nla6-DBD binding to nla28-P1 is specific. To test whether Nla28-DBD is capable of specific binding to nla28EE2 and Nla6-DBD is capable of specific binding to nla28-EE1, we performed an additional series of competition assays (Fig. 6 B and C). In one assay, we added a 100-fold excess of unlabeled nla28-P2(60), which is a 60-bp fragment of nla28-P2 that contains the two nla28EE2 half sites and the DNA sequences that lie between them, to a binding reaction containing Nla28-DBD and labeled nla28-P2 probe. Subsequently, we observed a decrease in the ratio of Nla28-DBD–bound/unbound nla28-P2 probe, indicating that nla28-P2(60) is an effective competitor. In the second assay, we showed that a 100-fold excess of unlabeled nla28-P2(60)*, which is a derivative of nla28-P2(60) that has mutated nla28EE2 half sites, fails to compete effectively for Nla28-DBD binding. In another set of assays, we added a 100-fold excess of unlabeled nla28-P1(60), which is a 60-bp fragment of nla28-P1 that contains the two nla28EE1 half sites and the DNA sequences that lie between them, or unlabeled nla28-P1(60)*, which is a derivative of nla28-P1(60) that has mutated nla28EE1 half sites, to a binding reaction containing Nla6-DBD and labeled nla28-P1 probe. As expected, we found that nla28-P1(60) competed for Nla6-DBD binding, whereas nla28-P1(60)* failed to compete for Nla6-DBD binding. These findings indicate that Nla28-DBD is capable of specific binding to DNA containing nla28EE2 and Nla6-DBD is capable of specific binding to DNA containing nla28EE1, and they suggest that Nla6 and Nla28 have their own enhancer elements in the nla28 promoter for in vivo binding.
Nla6-DBD, Nla28-DBD, and ActB-DBD all bind to the promoter region of the actB gene (Fig. 3B). Nla6-DBD and Nla28-DBD bind to the P1 fragment of the actB promoter region (Figs. 3B and 7B). The P1 fragment contains the putative enhancers actBEE1 and actBEE2 (Fig. 7A), which are the proposed Nla6 and Nla28 binding sites, respectively, based on the sequence alignments shown in Table S1. One of the actBEE1 half-sites is located in the spacer region between the two actBEE2 half sites and vice versa. This arrangement prevented us from doing binding studies similar to those described above. However, EMSAs did reveal that a reaction mixture containing Nla6-DBD, Nla28-DBD, and labeled actB-P1 yields a higher molecular weight complex than a reaction mixture containing either Nla6-DBD or Nla28-DBD and labeled actB-P1 (Fig. 7C), suggesting that Nla6-DBD and Nla28-DBD are capable binding to actB-P1 at the same time. This result is consistent with the idea that Nla6-DBD and Nla28-DBD bind to different sites on the actB-P1 fragment. Furthermore, the alternating arrangement of the actBEE1 and actBEE2 half sites suggests that Nla6 and Nla28 monomers interact when they bind to the actB promoter in vivo or that Nla6 and Nla28 homodimers bind to the actB promoter at different times in development. The third EBP-DBD that binds to the actB promoter region, which is ActB-DBD, does so at a different location than either Nla6-DBD or Nla28-DBD: It binds to the actB-P2 fragment (Figs. 3B and 7D). The actB-P2 fragment contains a third putative enhancer called actBEE3 (Fig. 7A). When we performed competition assays with ActB-DBD, labeled actB-P2, and a 100-fold excess of unlabeled actB-P2 or dev (Fig. 7D), we found that unlabeled actB-P2 competed for ActB-DBD binding more effectively than the dev promoter fragment, indicating that ActB-DBD is capable of specific binding to actB-P2. However, the fact that unlabeled dev competed to some degree for ActB-DBD binding indicates that some ActB-DBD bound nonspecifically to actB-P2. In competition assays with Nla6-DBD or Nla28-DBD, labeled actB-P1, and a 100-fold excess of unlabeled actB-P1 or dev as the competitor DNA, we observed similar results (Fig. 7B). These findings, along with those presented above, indicate that Nla6-DBD and Nla28-DBD are capable of specific binding to the segment of the actB promoter that contains actBEE1 and actBEE2 and that ActB-DBD is capable of specific binding to segment of the actB promoter that contains actBEE3.
Fig. 7.
EMSAs using Nla6-DBD, Nla28-DBD, and ActB-DBD as well as the promoter region of the actB operon. (A) actB promoter region. The location of the σ54 promoter is indicated by the arrow. The lengths of the P1 and P2 fragments are shown in parentheses. The sequences and locations of the putative EE1, EE2, and EE3 enhancer element half sites are shown above their corresponding promoter fragment. EMSAs were performed using Nla28-DBD or Nla6-DBD proteins and end-labeled P1 promoter fragment (B); Nla28-DBD, Nla6-DBD, or both Nla28-DBD and Nla6-DBD and end-labeled P1 promoter fragment (C); or ActB-DBD and end-labeled P2 promoter fragment (D). A 100-fold excess of the following unlabeled promoter fragments (cold DNA) was added for the competition assays shown in B: P1 (lanes 4 and 7) or dev (lanes 3 and 8). In the competition assays shown in D, a 50-fold excess of unlabeled P2 (lane 3), a 100-fold excess of unlabeled P2 (lane 4), a 200-fold excess of unlabeled P2 (lane 5), or a 200-fold excess of unlabeled dev (lane 6) was added.
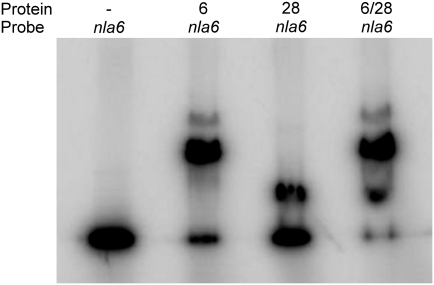
Four EBP-DBDs (Nla6-DBD, Nla28-DBD, Nla4-DBD, and Nla18-DBD) bind to the promoter region of nla6 (Fig. 3A), and, as shown in Fig. 8, we found a matching number of putative enhancer elements (nla6EE1–EE4). The sequence alignments shown in Table S1 suggest that nla6EE1 and nla6EE2 might be the enhancers for Nla6 and Nla28, respectively. We suggest that nla6EE3 and nla6EE4 might be the binding sites for Nla4 and Nla18; however, at this time, we do not know which EBP binds to which of these putative enhancer elements. A feature that is unique to the nla6 promoter region is the overlap in the putative enhancer element half sites. In particular, nla6EE1 has a half site that overlaps with a half site of each of the remaining putative enhancers. This finding suggests that Nla6 might compete with its coregulating EBPs for access to nla6 promoter binding sites. Indeed, we detected a decrease in the amount of Nla28-DBD that binds to the nla6 promoter region when Nla6-DBD is added to the binding reaction (Fig. 9). Taken together, the results presented here support the idea that EBP genes positioned at stage-stage transition points in development have promoters with enhancer elements for each coregulating EBP to bind. They also suggest that the mechanism of EBP coregulation is different from promoter to promoter.
Fig. 9.
EMSAs using Nla6-DBD and Nla28-DBD as well as the promoter region of the nla6 operon. The assays were performed using an end-labeled nla6 promoter fragment and the following EBP-DBDs: none (lane 1), Nla6-DBD (lane 2), Nla28-DBD (lane 3), and both Nla6-DBD and Nla28-DBD (lane 4).
Discussion
Here, we present experimental evidence that M. xanthus initiates and propagates its early developmental program using a novel regulatory strategy: a cascade of signal-responsive EBPs. Pairs of cascade EBPs function in sequential stages of fruiting body development. Specifically, Nla4 and Nla18 direct gene expression that is important for the transition from vegetative growth to fruiting body development (28, 29), Nla6 and Nla28 become important for gene expression during the preaggregation stage [our data in the Gene Expression Omnibus (accession no. GSE13523)], and ActB and MXAN4899 become important for gene expression during aggregation (26, 30). The temporal availability of the latter four EBPs is probably controlled, at least in part, through transcriptional regulation; nla6 and nla28 expression is first activated during preaggregation (Fig. 1B), and actB and MXAN4899 expression is first activated during aggregation (Fig. 1C).
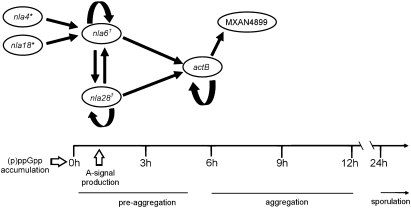
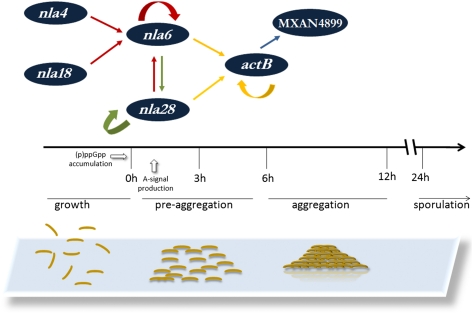
Our investigation of the cascade revealed EBP gene promoters with potential σ54-RNA polymerase binding sites and EBP binding sites nearby. The EMSAs shown in Fig. 3 indicate that the cascade EBPs bind to the promoter regions of EBP genes that function immediately downstream (Fig. 10). In particular, Nla4-DBD and Nla18-DBD bind to the promoter region of the nla6 operon, Nla6-DBD and Nla28-DBD bind to the promoter region of the actB operon, and ActB-DBD binds to the promoter region of the MXAN4899 operon. These findings suggest that the cascade is designed with direct regulatory linkages that make its EBPs available to activate their target developmental genes in the appropriate temporal order, which, in turn, promotes seamless transitions between developmental stages. The cascade is also designed so that multiple EBPs directly regulate developmental expression of the EBP genes nla6, nla28, and actB (Figs. 3 and 6–8). As a consequence of this design, transcription of the nla6, nla28, and actB genes, which are positioned at stage-stage transition points in early development, is responsive to input from multiple EBP signal transduction networks. This system of direct coregulation by multiple EBP signal transduction networks is novel; in other bacterial systems, only one EBP signal transduction network is used to regulate a gene or group of genes directly. However, it should be noted that the M. xanthus cascade is not the only example of a tiered bacterial regulatory circuit that uses an EBP to regulate a downstream-functioning EBP gene. Namely, the flagellar gene regulatory circuits of Vibrio cholerae and Pseudomonas aeruginosa use one EBP, which is at the top of the regulatory hierarchy, to modulate transcription of an EBP gene that sits at the next level of the hierarchy (42, 43). We suggest that M. xanthus has expanded on the typical scheme of EBP-mediated transcription to build a regulatory cascade that can integrate and respond to a variety of signals when cells must coordinately make the crucial decision to advance from one developmental stage to the next. We also suggest that the cascade promotes these transitions by overseeing a large reorganization of gene expression patterns, as indicated by the fact that hundreds of developmental genes with putative σ54 promoters are activated at the onset of preaggregation and aggregation (Table S2). Of course, the cascade is but a part of a larger regulatory network that we are beginning to map out, and our observations do not exclude the possibility of posttranscriptional controls that would render each stage-stage transition more robust.
Fig. 10.
Model for the EBP transcriptional cascade that controls the development of M. xanthus fruiting bodies. The lines above preaggregation and aggregation indicate the approximate extent of these stages (1–5 h and 6–12 h, respectively), and the arrow above sporulation indicates that this stage begins at about 24 h and continues for several days (24–120 h). The white arrows indicate that (p)ppGpp accumulation is required to make the transition from growth to development and that A-signal is required in the early part of preaggregation. *Nla4 and Nla18 are important for (p)ppGpp accumulation. †Nla6 and Nla28 are important for A-signal production. The products of the EBP genes shown here have a specific operational sequence as indicated by their placement above the developmental time line. The straight black arrows represent direct transcriptional regulation, and the curved black arrows represent autoregulation.
The discovery of an EBP cascade that functions early in fruiting body development might be a prelude to answering a long-standing question: How does M. xanthus make the decision to begin the morphological changes that yield a fruiting body? Previous studies have connected the Nla-EBPs to this decision-making process (6). As mentioned previously, starvation must trigger the intracellular accumulation of (p)ppGpp and the (p)ppGpp-dependent accumulation of extracellular A-signal, which is a cell density indicator, before cells will begin the process of building a fruiting body. It was observed that Nla4 and Nla18, located at the head of the cascade (Fig. 10), are important for (p)ppGpp accumulation (28, 29). Nla4 is important for expression of the relA gene, and the relA promoter region has a putative σ54 RNA polymerase binding site (29), both of which suggest that the Nla4-EBP might be directly involved in (p)ppGpp accumulation. In light of these findings, it seems reasonable to speculate that the Nla4 signal transduction system might respond to a limited supply of carbon, amino acids, or phosphate, all of which are known to trigger (p)ppGpp accumulation (44), by activating relA transcription. The next EBPs in the cascade, Nla6 and Nla28, are important for A-signal production (24), as indicated in Fig. 10. We suggest that the Nla6 and Nla28 signal transduction pathways might link different pieces of information about the cellular nutritional status, such as the availability of protein synthesis precursors to production of A-signal. Alternatively, the Nla6 and Nla28 signal transduction pathways might each detect a subset of the A-signal amino acids and link this information to production of more A-signal. In this scenario, Nla6 and Nla28 would help to create a positive feedback loop, which is a signature property of bacterial quorum sensing systems (45). At this point, it can be stated that a cascade of EBPs that regulates stage-stage transitions in response to important local cues, such as nutrient availability and cell density, would provide the process of fruiting body development with intrinsic flexibility. Namely, it would allow cells to make a coordinated decision to move development along or revert to growth at many points along the pathway to mature fruiting bodies. This regulatory strategy, which lacks a firm commitment step, is quite different from the one used by the spore-forming bacterium B. subtilis. In B. subtilis, a series of protein kinases are used to assess starvation and a cascade of different σ-factors is used to control transcription of sporulation genes. Once the early cell type-specific σ-factors are activated, B. subtilis cells are committed to sporulation (46). We suggest that activation any of the EBPs in the cascade fails to lock cells into the pathway to sporulation. This property would, for example, allow M. xanthus cells to revert to feeding mode if prey bacteria become available only part of the way through the developmental program. The challenge for the future will be to determine which signals activate the EBPs in the cascade and whether they are integrated at the transcriptional level, how the signals affect the transcriptional output of the EBPs, and how the transcriptional output influences whether fruiting body development will continue or be disengaged.
Methods
Growth and Development.
M. xanthus strains used in this study are shown in Table S3. Media and growth conditions for M. xanthus and E. coli strains as well as developmental assays have all been previously published (24, 28).
DNA Microarray Generation and Hybridization.
PCR-generated DNA microarrays containing probes to 7,235 ORFs found in the genome of WT M. xanthus strain DK1622 (35) were constructed as described previously (28, 47). WT and nla mutant cells were isolated at certain developmental time points (0, 1, 2, 4, 6, and 12 h poststarvation), quick-frozen, and stored at −80 °C as developmental test samples. Total RNA was isolated from quick-frozen cells using the hot phenol-chloroform method (48) and purified using the Agilent Technologies Total RNA Purification Kit. To generate a common reference for WT and nla mutant test samples, equal amounts of RNA from each WT time point were pooled. Total RNA was used in RT-mediated cDNA synthesis reactions; the cDNA was purified, eluted, dried, and labeled with Cy3 (test sample) or Cy5 (reference samples) as described by Jakobsen et al. (47). Labeled cDNA was prepared for hybridization, hybridized to the PCR-generated microarrays, and then processed as described previously (47).
DNA Microarray Data Analysis.
Posthybridized DNA microarrays were scanned using a GenePix 4100A microarray scanner and read using GenePix Pro 6.0 (Axon, Inc.). Each array was normalized for signal intensities across the whole array and locally using LOWESS normalization in the software package Acuity 4.0 (Axon Instruments). For each test sample, data from at least three independent experiments were analyzed using Significant Analysis of Microarrays (SAM http://www-stat.stanford.edu/∼tibs/SAM) (49). The advantage of this microarray data analysis method is that the threshold for significant changes in gene expression can be adjusted to achieve a relatively low false discovery rate. Specifically, a SAM test for multiple groups with the false discovery rate of 0.05 was used. Based on this false discovery rate, a 1.5-fold threshold for significant changes in gene expression was chosen. In general, the results obtained using the 1.5-fold threshold agree with those obtained in previous expression studies and those obtained in our QPCR analysis of genes (including the EBP genes analyzed in this study) selected from the DNA microarray data. All DNA microarray results have been submitted to the Gene Expression Omnibus (GEO) at the National Center for Biotechnology Information (accession no. GSE13523).
QPCR.
M. xanthus strains were grown and development was induced in submerged culture as described previously (29). The procedures for RNA preparation (50), cDNA generation, and QPCR reactions have been described previously (29).
Preparation of EBP-DBDs.
Gene fragments coding for the EBP-DBDs were cloned into the pMBP-parallel 1 vector (51) or the pET102/d-TOPO vector, and the resulting plasmids (pKMG14–pKMG17 and pNBC103–pNBC104; Table S3) were transformed into E. coli strain BL21 (DE3). EBP-DBDs were purified using columns packed with Amylose resin (New England Biolabs) (for pMBP-parallel 1 constructs) or using Ni-NTA superflow resin (QIAGEN) as described in the manufacturer's instructions. Protein concentrations were estimated using Quick Start Bradford Dye Reagent (Bio-Rad).
EMSAs.
PCR-generated promoter fragments contained ∼100–200 bp of DNA immediately upstream of the σ54-RNA polymerase recognition sites that we identified using PromScan (32), a bioinformatics tool that was specifically developed to identify σ54-RNA polymerase binding sites in the sequences of bacterial DNA. The DNA fragments were end-labeled using [γ-32P]ATP (MP Biomedicals) and T4 polynucleotide kinase (New England Biolabs) and purified using the QIAquick Nucleotide Removal Kit (QIAGEN). Binding reactions were carried out as described previously, using a 1- to 5-μM concentration of EBP-DBD and 1 ng of labeled promoter fragment (52). The reaction mixtures were electrophoresed through Native Page Novex (Invitrogen) gels, visualized using a storage phosphor screen (Amersham Biosciences), scanned using a Typhoon-9410 imager (GE Healthcare), and analyzed using Image Quant software (Molecular Dynamics).
Site-Directed Mutagenesis of Putative σ54 Promoters and β-Galactosidase Assays.
Fragments carrying putative σ54 promoters and enhancer elements were generated using PCR and purified using the Promega Wizard SV Gel and PCR Clean-Up System as described by the manufacturer. Purified promoter fragments were cloned into the promoterless lacZ vector pREG1727 (53), which is used to create lacZ transcriptional fusions, and transformed into M. xanthus WT strain DK1622. The in vivo activity of the promoter fragments in developing cells was determined by measuring β-galactosidase–specific activities at various times after starvation was induced as previously described (54).
Mutations in the promoters were made as follows. The purified promoter fragments were cloned into the pCR 2.1 TOPO vector (Invitrogen), and mutations were generated using PCR primers with the appropriate nucleotide changes (Table S4), pfu turbo DNA polymerase (Agilent), and the TOPO plasmids containing the promoter sequences. Subsequent digestion with DpnI (New England Biolabs) was performed to remove parental plasmid DNA. The promoter fragments on the resulting plasmids were sequenced to confirm that they carried the appropriate mutations. Subsequently, the mutant promoter fragments were cloned into pREG1727, the plasmids were introduced into WT strain DK1622, and strains carrying plasmids integrated at the Mx8 phage attachment site in the chromosome were identified. The activities of the promoter fragments during fruiting body development were determined as described above.
Supplementary Material
Acknowledgments
We thank SUNY Upstate Medical University for use of the Typhoon-9410 imager (GE Healthcare). This work was supported by National Science Foundation Grant 0950976 (to A.G.G.).
Footnotes
The authors declare no conflict of interest.
This article is a PNAS Direct Submission.
See Author Summary on page 12981.
Data deposition: The data reported in this paper have been deposited in the Gene Expression Omnibus (GEO) database, www.ncbi.nlm.nih.gov/geo (accession no. GSE13523).
This article contains supporting information online at www.pnas.org/lookup/suppl/doi:10.1073/pnas.1105876108/-/DCSupplemental.
References
- 1.Fay P. Oxygen relations of nitrogen fixation in cyanobacteria. Microbiol Rev. 1992;56:340–373. doi: 10.1128/mr.56.2.340-373.1992. [DOI] [PMC free article] [PubMed] [Google Scholar]
- 2.Parsek MR, Tolker-Nielsen T. Pattern formation in Pseudomonas aeruginosa biofilms. Curr Opin Microbiol. 2008;11:560–566. doi: 10.1016/j.mib.2008.09.015. [DOI] [PubMed] [Google Scholar]
- 3.Mathew S, Dudani A. Lysis of human pathogenic bacteria by myxobacteria. Nature. 1955;175:125. doi: 10.1038/175125a0. [DOI] [PubMed] [Google Scholar]
- 4.Inouye M, Inouye S, Zusman DR. Gene expression during development of Myxococcus xanthus: Pattern of protein synthesis. Dev Biol. 1979;68:579–591. doi: 10.1016/0012-1606(79)90228-8. [DOI] [PubMed] [Google Scholar]
- 5.Dahl JL, et al. Identification of major sporulation proteins of Myxococcus xanthus using a proteomic approach. J Bacteriol. 2007;189:3187–3197. doi: 10.1128/JB.01846-06. [DOI] [PMC free article] [PubMed] [Google Scholar]
- 6.Diodati ME, Gill RE, Plamann L, Singer M. In: Myxobacteria: Multicellularity and Differentiation. Whitworth DE, editor. Washington, DC: ASM Press; 2008. pp. 43–76. [Google Scholar]
- 7.Kuspa A, Plamann L, Kaiser D. Identification of heat-stable A-factor from Myxococcus xanthus. J Bacteriol. 1992;174:3319–3326. doi: 10.1128/jb.174.10.3319-3326.1992. [DOI] [PMC free article] [PubMed] [Google Scholar]
- 8.Kuspa A, Plamann L, Kaiser D. A-signalling and the cell density requirement for Myxococcus xanthus development. J Bacteriol. 1992;174:7360–7369. doi: 10.1128/jb.174.22.7360-7369.1992. [DOI] [PMC free article] [PubMed] [Google Scholar]
- 9.Plamann L, Kuspa A, Kaiser D. Proteins that rescue A-signal-defective mutants of Myxococcus xanthus. J Bacteriol. 1992;174:3311–3318. doi: 10.1128/jb.174.10.3311-3318.1992. [DOI] [PMC free article] [PubMed] [Google Scholar]
- 10.Manoil C, Kaiser D. Guanosine pentaphosphate and guanosine tetraphosphate accumulation and induction of Myxococcus xanthus fruiting body development. J Bacteriol. 1980;141:305–315. doi: 10.1128/jb.141.1.305-315.1980. [DOI] [PMC free article] [PubMed] [Google Scholar]
- 11.Singer M, Kaiser D. Ectopic production of guanosine penta- and tetraphosphate can initiate early developmental gene expression in Myxococcus xanthus. Genes Dev. 1995;9:1633–1644. doi: 10.1101/gad.9.13.1633. [DOI] [PubMed] [Google Scholar]
- 12.Harris BZ, Kaiser D, Singer M. The guanosine nucleotide (p)ppGpp initiates development and A-factor production in Myxococcus xanthus. Genes Dev. 1998;12:1022–1035. doi: 10.1101/gad.12.7.1022. [DOI] [PMC free article] [PubMed] [Google Scholar]
- 13.Popham DL, Szeto D, Keener J, Kustu S. Function of a bacterial activator protein that binds to transcriptional enhancers. Science. 1989;243:629–635. doi: 10.1126/science.2563595. [DOI] [PubMed] [Google Scholar]
- 14.Sasse-Dwight S, Gralla JD. Role of eukaryotic-type functional domains found in the prokaryotic enhancer receptor factor σ54. Cell. 1990;62:945–954. doi: 10.1016/0092-8674(90)90269-k. [DOI] [PubMed] [Google Scholar]
- 15.Wedel A, Kustu S. The bacterial enhancer-binding protein NTRC is a molecular machine: ATP hydrolysis is coupled to transcriptional activation. Genes Dev. 1995;9:2042–2052. doi: 10.1101/gad.9.16.2042. [DOI] [PubMed] [Google Scholar]
- 16.Morett E, Segovia L. The σ54 bacterial enhancer-binding protein family: Mechanism of action and phylogenetic relationship of their functional domains. J Bacteriol. 1993;175:6067–6074. doi: 10.1128/jb.175.19.6067-6074.1993. [DOI] [PMC free article] [PubMed] [Google Scholar]
- 17.Studholme DJ, Dixon R. Domain architectures of σ54-dependent transcriptional activators. J Bacteriol. 2003;185:1757–1767. doi: 10.1128/JB.185.6.1757-1767.2003. [DOI] [PMC free article] [PubMed] [Google Scholar]
- 18.Kaufman RI, Nixon BT. Use of PCR to isolate genes encoding σ54-dependent activators from diverse bacteria. J Bacteriol. 1996;178:3967–3970. doi: 10.1128/jb.178.13.3967-3970.1996. [DOI] [PMC free article] [PubMed] [Google Scholar]
- 19.Wu SS, Kaiser D. Regulation of expression of the pilA gene in Myxococcus xanthus. J Bacteriol. 1997;179:7748–7758. doi: 10.1128/jb.179.24.7748-7758.1997. [DOI] [PMC free article] [PubMed] [Google Scholar]
- 20.Gorski L, Kaiser D. Targeted mutagenesis of σ54 activator proteins in Myxococcus xanthus. J Bacteriol. 1998;180:5896–5905. doi: 10.1128/jb.180.22.5896-5905.1998. [DOI] [PMC free article] [PubMed] [Google Scholar]
- 21.Guo D, Wu Y, Kaplan HB. Identification and characterization of genes required for early Myxococcus xanthus developmental gene expression. J Bacteriol. 2000;182:4564–4571. doi: 10.1128/jb.182.16.4564-4571.2000. [DOI] [PMC free article] [PubMed] [Google Scholar]
- 22.Hager E, Tse H, Gill RE. Identification and characterization of spdR mutations that bypass the BsgA protease-dependent regulation of developmental gene expression in Myxococcus xanthus. Mol Microbiol. 2001;39:765–780. doi: 10.1046/j.1365-2958.2001.02266.x. [DOI] [PubMed] [Google Scholar]
- 23.Sun H, Shi W. Genetic studies of mrp, a locus essential for cellular aggregation and sporulation of Myxococcus xanthus. J Bacteriol. 2001;183:4786–4795. doi: 10.1128/JB.183.16.4786-4795.2001. [DOI] [PMC free article] [PubMed] [Google Scholar]
- 24.Caberoy NB, Welch RD, Jakobsen JS, Slater SC, Garza AG. Global mutational analysis of NtrC-like activators in Myxococcus xanthus: Identifying activator mutants defective for motility and fruiting body development. J Bacteriol. 2003;185:6083–6094. doi: 10.1128/JB.185.20.6083-6094.2003. [DOI] [PMC free article] [PubMed] [Google Scholar]
- 25.Kirby JR, Zusman DR. Chemosensory regulation of developmental gene expression in Myxococcus xanthus. Proc Natl Acad Sci USA. 2003;100:2008–2013. doi: 10.1073/pnas.0330944100. [DOI] [PMC free article] [PubMed] [Google Scholar]
- 26.Jelsbak L, Givskov M, Kaiser D. Enhancer-binding proteins with a forkhead-associated domain and the σ54 regulon in Myxococcus xanthus fruiting body development. Proc Natl Acad Sci USA. 2005;102:3010–3015. doi: 10.1073/pnas.0409371102. [DOI] [PMC free article] [PubMed] [Google Scholar]
- 27.Giglio KM, Eisenstatt J, Garza AG. Identification of enhancer binding proteins important for Myxococcus xanthus development. J Bacteriol. 2010;192:360–364. doi: 10.1128/JB.01019-09. [DOI] [PMC free article] [PubMed] [Google Scholar]
- 28.Diodati M, et al. Nla18, a key regulatory protein required for normal growth and development of Myxococcus xanthus. J Bacteriol. 2006;188:1733–1743. doi: 10.1128/JB.188.5.1733-1743.2006. [DOI] [PMC free article] [PubMed] [Google Scholar]
- 29.Ossa F, et al. The Myxococcus xanthus Nla4 protein is important for expression of stringent response-associated genes, ppGpp accumulation, and fruiting body development. J Bacteriol. 2007;189:8474–8483. doi: 10.1128/JB.00894-07. [DOI] [PMC free article] [PubMed] [Google Scholar]
- 30.Gronewold TM, Kaiser D. act operon control of developmental gene expression in Myxococcus xanthus. J Bacteriol. 2002;184:1172–1179. doi: 10.1128/jb.184.4.1172-1179.2002. [DOI] [PMC free article] [PubMed] [Google Scholar]
- 31.Kroos L, Piggot PJ, Moran CP., Jr. In: Myxobacteria: Multicellularity and Differentiation. Whitworth DE, editor. Washington, DC: ASM Press; 2008. pp. 363–383. [Google Scholar]
- 32.Studholme DJ, Buck M, Nixon T. Identification of potential σ(N)-dependent promoters in bacterial genomes. Microbiology. 2000;146:3021–3023. doi: 10.1099/00221287-146-12-3021. [DOI] [PubMed] [Google Scholar]
- 33.Viswanathan P, Murphy KA, Julien B, Garza AG, Kroos L. Regulation of dev, an operon that includes genes essential for Myxococcus xanthus development and CRISPR-associated genes and repeats. J Bacteriol. 2007;189:3738–3750. doi: 10.1128/JB.00187-07. [DOI] [PMC free article] [PubMed] [Google Scholar]
- 34.Gronewold TMA, Kaiser D. Mutations of the act promoter in Myxococcus xanthus. J Bacteriol. 2007;189:1836–1844. doi: 10.1128/JB.01618-06. [DOI] [PMC free article] [PubMed] [Google Scholar]
- 35.Goldman BS, et al. Evolution of sensory complexity recorded in a myxobacterial genome. Proc Natl Acad Sci USA. 2006;103:15200–15205. doi: 10.1073/pnas.0607335103. [DOI] [PMC free article] [PubMed] [Google Scholar]
- 36.Barrios H, Valderrama B, Morett E. Compilation and analysis of σ(54)-dependent promoter sequences. Nucleic Acids Res. 1999;27:4305–4313. doi: 10.1093/nar/27.22.4305. [DOI] [PMC free article] [PubMed] [Google Scholar]
- 37.Weiner L, Brissette JL, Model P. Stress-induced expression of the Escherichia coli phage shock protein operon is dependent on sigma 54 and modulated by positive and negative feedback mechanisms. Genes Dev. 1991;5:1912–1923. doi: 10.1101/gad.5.10.1912. [DOI] [PubMed] [Google Scholar]
- 38.Jovanovic G, Model P. PspF and IHF bind co-operatively in the psp promoter-regulatory region of Escherichia coli. Mol Microbiol. 1997;25:473–481. doi: 10.1046/j.1365-2958.1997.4791844.x. [DOI] [PubMed] [Google Scholar]
- 39.Reitzer LJ, Magasanik B. Transcription of glnA in E. coli is stimulated by activator bound to sites far from the promoter. Cell. 1986;45:785–792. doi: 10.1016/0092-8674(86)90553-2. [DOI] [PubMed] [Google Scholar]
- 40.Minchin SD, Austin S, Dixon RA. The role of activator binding sites in transcriptional control of the divergently transcribed nifF and nifLA promoters from Klebsiella pneumoniae. Mol Microbiol. 1988;2:433–442. doi: 10.1111/j.1365-2958.1988.tb00049.x. [DOI] [PubMed] [Google Scholar]
- 41.Morett E, Cannon W, Buck M. The DNA-binding domain of the transcriptional activator protein NifA resides in its carboxy terminus, recognises the upstream activator sequences of nif promoters and can be separated from the positive control function of NifA. Nucleic Acids Res. 1988;16:11469–11488. doi: 10.1093/nar/16.24.11469. [DOI] [PMC free article] [PubMed] [Google Scholar]
- 42.Prouty MG, Correa NE, Klose KE. The novel σ54- and σ28-dependent flagellar gene transcription hierarchy of Vibrio cholerae. Mol Microbiol. 2001;39:1595–1609. doi: 10.1046/j.1365-2958.2001.02348.x. [DOI] [PubMed] [Google Scholar]
- 43.Dasgupta N, et al. A four-tiered transcriptional regulatory circuit controls flagellar biogenesis in Pseudomonas aeruginosa. Mol Microbiol. 2003;50:809–824. doi: 10.1046/j.1365-2958.2003.03740.x. [DOI] [PubMed] [Google Scholar]
- 44.Manoil C, Kaiser D. Accumulation of guanosine tetraphosphate and guanosine pentaphosphate in Myxococcus xanthus during starvation and myxospore formation. J Bacteriol. 1980;141:297–304. doi: 10.1128/jb.141.1.297-304.1980. [DOI] [PMC free article] [PubMed] [Google Scholar]
- 45.Waters CM, Bassler BL. Quorum sensing: Cell-to-cell communication in bacteria. Annu Rev Cell Dev Biol. 2005;21:319–346. doi: 10.1146/annurev.cellbio.21.012704.131001. [DOI] [PubMed] [Google Scholar]
- 46.Parker GF, Daniel RA, Errington J. Timing and genetic regulation of commitment to sporulation in Bacillus subtilis. Microbiology. 1996;142:3445–3452. doi: 10.1099/13500872-142-12-3445. [DOI] [PubMed] [Google Scholar]
- 47.Jakobsen JS, et al. σ54 enhancer binding proteins and Myxococcus xanthus fruiting body development. J Bacteriol. 2004;186:4361–4368. doi: 10.1128/JB.186.13.4361-4368.2004. [DOI] [PMC free article] [PubMed] [Google Scholar]
- 48.Sambrook J, Fritsch E, Maniatis T. Molecular Cloning: A Laboratory Manual. 2nd Ed. Cold Spring Harbor, NY: Cold Spring Harbor Laboratory Press; 1989. [Google Scholar]
- 49.Tusher VG, Tibshirani R, Chu G. Significance analysis of microarrays applied to the ionizing radiation response. Proc Natl Acad Sci USA. 2001;98:5116–5121. doi: 10.1073/pnas.091062498. [DOI] [PMC free article] [PubMed] [Google Scholar]
- 50.Lancero HL, et al. Characterization of a Myxococcus xanthus mutant that is defective for adventurous and social motilities. Microbiology. 2004;150:6083–6094. doi: 10.1099/mic.0.27381-0. [DOI] [PubMed] [Google Scholar]
- 51.Sheffield P, Garrard S, Derewenda Z. Overcoming expression and purification problems of RhoGDI using a family of “parallel” expression vectors. Protein Expr Purif. 1999;15:34–39. doi: 10.1006/prep.1998.1003. [DOI] [PubMed] [Google Scholar]
- 52.Ueki T, Inouye S. Identification of an activator protein required for the induction of fruA, a gene essential for fruiting body development in Myxococcus xanthus. Proc Natl Acad Sci USA. 2003;100:8782–8787. doi: 10.1073/pnas.1533026100. [DOI] [PMC free article] [PubMed] [Google Scholar]
- 53.Fisseha M, Gloudemans M, Gill RE, Kroos L. Characterization of the regulatory region of a cell interaction-dependent gene in Myxococcus xanthus. J Bacteriol. 1996;178:2539–2550. doi: 10.1128/jb.178.9.2539-2550.1996. [DOI] [PMC free article] [PubMed] [Google Scholar]
- 54.Kroos L, Kuspa A, Kaiser D. A global analysis of developmentally regulated genes in Myxococcus xanthus. Dev Biol. 1986;117:252–266. doi: 10.1016/0012-1606(86)90368-4. [DOI] [PubMed] [Google Scholar]


