

Abstract
Characterizing the role of effective population size in dictating the rate of adaptive evolution remains a major challenge in evolutionary biology. Depending on the underlying distribution of fitness effects of new mutations, populations of different sizes may differ vastly in their rate of adaptation. Here, we collect polymorphism data at over 100 loci for two closely related Drosophila species with different current effective population sizes (Ne), Drosophila miranda and D. pseudoobscura, to evaluate the prevalence of adaptive evolution versus genetic drift in molecular evolution. Utilizing these large and consistently sampled data sets, we obtain greatly improved estimates of the demographic histories of both species. Specifically, although current Ne differs between these species, their ancestral sizes were much more similar. We find that statistical approaches capturing recent adaptive evolution (using patterns of polymorphisms) detect higher rates of adaptive evolution in the larger D. pseudoobscura population. In contrast, methods aimed at detecting selection over longer time periods (i.e., those relying on divergence data) estimate more similar rates of adaptation between the two species. Thus, our results suggest an important role of effective population size in dictating rates of adaptation and highlight how complicated population histories—as is probably the case for most species—can effect rates of adaptation. Additionally, we also show how different methodologies to detect positive selection can reveal information about different timescales of adaptive evolution.
Keywords: selective sweeps, demography, natural selection
Introduction
Understanding the relative role of effective population size on the rate of adaptation has been of long standing interest to evolutionary biologists. Depending on the distribution of fitness effects (DFE) of new mutations, Gillespie defined three specific model-based domains of molecular evolution (Gillespie 1999, 2001). In the Ohta domain (Ohta 1973), patterns of molecular evolution are driven mainly by slightly deleterious mutations (Gillespie 1999). Under this model, the rate of substitution decreases with increasing effective population size, due to an increase in the efficiency of purifying selection against deleterious mutations. In the Kimura domain (Kimura 1968), molecular evolution is dominated by mutations with no effect on fitness, and the rate of substitution is independent of the effective population size but simply given by the neutral mutation rate (Gillespie 1999). Finally, in the Darwin domain, molecular evolution is driven by beneficial mutations, and the rate of substitution is predicted to increase with effective population size (Gillespie 1999). If beneficial mutations are independent, rates of adaptation increase linearly with increasing population size. However, if beneficial mutations are common and linked, the rate of substitution will be substantially reduced and eventually become independent of the effective population size of a species (Gillespie 2000). The relationship between population size and rates of molecular evolution is additionally complicated by the fact that positive selection may actually increase the rate of fixation of deleterious substitutions at linked sites (Bachtrog and Gordo 2004). Thus, depending on the underlying DFE and other population parameters, different patterns in rates of molecular evolution are expected with changing population size.
With the advent of large-scale genomics, a tremendous amount of both data and methodology has recently been published to address the underlying DFE of new mutations. In particular, a number of recent studies in Drosophila have found that positive selection may be prevalent (Darwin domain) but have resulted in vastly different estimates of the underlying distribution of selection coefficients (see recent review of Sella et al. 2009; Sattath et al. 2011). Assuming that the observed correlation between recombination rate and nucleotide diversity in Drosophila is driven by beneficial mutations, Eyre-Walker (2006) estimates the joint parameter, 350 < Nes < 3,500. Macpherson et al. (2007) fit levels of neutral polymorphism to divergence and concluded that selection is stronger, with Nes ∼ 105. Using likelihood based and approximate Bayesian based methodologies, respectively, Li and Stephan (2006) and Jensen, Thornton, and Andolfatto (2008) estimate Nes ∼ 1,000. Hence, based upon these estimates, most Drosophila populations are expected to fall well within the Darwin domain, where the rate of substitution is positively correlated with effective population size. However, a consensus is far from being reached. A number of recent studies, all using McDonald–Kreitman (MK)-like statistical procedures to infer selection (i.e., comparing synonymous and nonsynonymous polymorphisms with divergence; McDonald and Kreitman 1991), estimated Nes < 100 in Drosophila (Sawyer et al. 2003; Andolfatto 2007; Eyre-Walker and Keightley 2009).
Broadscale biological comparisons corroborate at least some correlation between the rate of adaptation and effective population size—hominids appear to be undergoing relatively little adaptive evolution, Drosophila and rodent species with their generally larger population sizes are estimated to show intermediate levels of adaptation, whereas bacteria with their very large populations display high rates of adaptive evolution (e.g., Kimura 1983; Nielsen and Yang 2003; Bustamante et al. 2005; Nielsen et al. 2005; Charlesworth and Eyre-Walker 2006; Halligan et al. 2009). However, other species such as yeast and Arabidopsis, which have population sizes similar to Drosophila (or larger), show little evidence of adaptive amino acid evolution, though differences in mating systems may be confounding these comparisons (Bustamante et al. 2002).
In order to avoid confounding effects of vastly different biological systems with very different life histories, it is desirable to compare species at a much closer phylogenetic scale. Bachtrog (2008) examined two Drosophila species—Drosophila miranda and D. melanogaster—that show a roughly 5-fold difference in their levels of neutral diversity, to evaluate the influence of effective population size on rates of adaptive evolution. Analyzing nearly 100 nonhomologous X-linked loci in both species, Bachtrog estimated a similar fraction of amino acid mutations being driven to fixation by selection between the two species. Thus, more consistent with estimates of strong selection, this analysis suggests that effective population size may not be a major determinant in rates of protein adaptation.
However, there are a number of possible complications with this conclusion. Although levels of neutral diversity are lower in D. miranda relative to D. melanogaster, this measure only accounts for recent effective population sizes, and it is plausible that the historical population size of both species may indeed have been more similar. This is consistent with evidence of a recent population size reduction in D. miranda (Yi et al. 2003; Bachtrog and Andolfatto 2006; Bachtrog 2008). Additionally, estimation was performed using a divergence-based procedure with D. pseudoobscura as an outgroup. Thus, much of the adaptive evolution inferred in D. miranda may actually reflect selection in the much larger population of D. pseudoobscura because divergence also includes fixations along the D. pseudoobscura lineage. Further, although both D. melanogaster and D. miranda belong to the genus Drosophila, they are fairly diverged at the DNA sequence level, live in different environments, and may have very different life history strategies. Finally, the loci compared in the two species represented a nonoverlapping data set consisting of nonhomologous loci.
In order to revisit the debate on the influence of effective population size on rates of molecular evolution, we gathered polymorphism data for over 100 X-linked loci in two closely related species with different effective population sizes, D. miranda and D. pseudoobscura (e.g., as recently demonstrated by Loewe et al. 2006, in the context of characterizing the relative strength of purifying selection between the two species). This comparison circumvents the problems discussed above and presents several advantages: 1) D. miranda and D. pseudoobscura appear to have a greater difference in their effective population sizes—with estimates suggesting a difference of almost an order of magnitude (Loewe et al. 2006), which should increase our chance to detect the influence of Ne; 2) D. miranda and D. pseudoobscura are two closely related sister species that are morphologically indistinguishable and diverged only about 2 Mya, suggesting that they may share more similar life histories; 3) we employ a consistently collected data set consisting of over 100 homologous genes sampled in both species which ensures that we compare genes that evolve under similar constraints in both species; 4) we explicitly model the demographic history of both species using a recently proposed likelihood-based demographic estimator and—rather than relying on standard equilibrium–based models—use this inferred demographic history to inform our inference of selection operating in both species; 5) in addition to divergence-based approaches to quantify positive selection, we also employ a recently proposed polymorphism-based method to independently estimate the rate and strength of adaptive evolution, which also allows us to estimate parameters of adaptive evolution as distributions rather than fixed values. Utilizing our improved experimental design and methods, we find a significant difference in rates of adaptive evolution between these two species, with D. pseudoobscura evolving at a greater rate, at least in its recent history. These results are discussed with regard to changes in population size, emphasizing the difference in the short- and long-term effective population size, and its influence on different methodologies commonly employed for detecting selection.
Methods
Survey of Coding Regions and Data Processing
Here, we present polymorphism data for 112 gene fragments in D. miranda and 123 gene fragments in D. pseudoobscura. Almost all genes are orthologous between the two species and are located on the X chromosome and were selected randomly with regards to function. Average sample size was 14 individuals in both species, and the average length surveyed for each locus was roughly 1 kb. The screen in D. pseudoobscura was conducted in order to match that published in D. miranda by Bachtrog et al. (2009). Details of polymerase chain reaction (PCR) primers are available from the authors upon request. Information about the individual loci surveyed and the geographic origin of the D. miranda strains investigated can be found in Bachtrog et al. (2009). The D. pseudoobscura population investigated was from Mesa Verde, Colorado, and was kindly provided by A. Larracuente.
Standard PCR procedures were used to amplify each region from genomic DNA from single male flies. PCR products were cleaned using Exonuclease I and Shrimp Alkaline Phosphatase and sequenced on both strands with the original PCR primers and internal sequencing primers if necessary, using Big-Dye (Version 3, Applied Biosystems). Sequence reactions were cleaned with sephadex plates (Edge Biosystems) and run on an ABI 3730 capillary sequencer. Chromatograms were edited and assembled using Sequencher (Gene Codes) software, and multiple sequence alignments were generated using MUSCLE (http://www.drive5.com/muscle/) with protein-alignment–assisted adjustments to preserve reading frames. Exon–intron boundaries were determined from the D. pseudoobscura genome sequence annotation (release 2.0). The sequences can be found under Genbank accession numbers (FN252903-FN256223).
A library of Perl scripts were used to calculate the estimated number of synonymous sites, average pairwise diversity (π) and average pairwise divergence (K) to the outgroup species (either D. pseudoobscura or D. miranda). A Jukes–Cantor correction was used to correct π and K for multiple hits. To infer lineage-specific divergence, we reconstructed a D. miranda–D. pseudoobscura ancestor (ANC) sequence using the maximum-likelihood approach implemented in the ‘‘codeml’’ program of PAML (Yang 1997). We either used D. affinis sequence (see Bachtrog 2008) or D. athabasca sequence (provided by K. Wong) as a more distant outgroup sequence. We were able to reconstruct the ANC for 107 D. miranda polymorphism loci and 119 D. pseudoobscura loci. Insertion–deletion polymorphisms and polymorphic sites overlapping alignment gaps were excluded from the analysis. Note that we make no distinction between ancestral and derived polymorphisms (i.e., mutations segregating in the ancestral population of D. miranda and D. pseudoobscura vs. newly arising ones after their split). Although ancestral polymorphism may be important when comparing such closely related species—extending perhaps 10 Ne generations since the split time (Clark 1997; Charlesworth et al. 2005)—recent analysis, however, suggests that ancestral polymorphisms represent only a small fraction of observed variation in D. pseudoobscura and D. miranda (Charlesworth et al. 2005). Also, ancestral polymorphism would make this species pair look more similar to each other with regards to polymorphism-based inferences and thus be conservative with regards to our conclusions (see below). Scripts used for data processing are available for download at: http://ib.berkeley.edu/labs/bachtrog/data/polyMORPHOrama/polyMORPHOrama.html.
Estimating Demographic Models
Using a recently proposed likelihood-based estimator (Gutenkunst et al. 2009) and taking advantage of our large consistently sampled polymorphism data sets in two closely related species of Drosophila, we estimate demographic models for D. miranda and D. pseudoobscura. These models are used as a baseline to calculate relevant critical values when inferring selection in these two species. By letting θ correspond to the parameters of a demographic model that one wishes to estimate from the observed frequency spectrum (denoted as S[di, dj,…]) and assuming no linkage between polymorphisms, each entry is an independent Poisson variable, with mean M[di, dj,…]. A likelihood function is then constructed as:
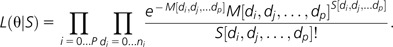 |
Thus, using a diffusion approach, the expected allele frequency spectrum M is calculated under a particular demographic model. The similarity between M and the observed spectrum, S, is maximized over the values of θ.
Full code and documentation to implement dadi are available at: http://code.google.com/p/dadi/.
To consider the impact of fluctuating population size on the rate of adaptation and to infer how different approaches to detect selection are sensitive to such fluctuations (and thus show a different dependency on the long-term vs. current population size), we utilize a forward simulation approach, and condition on the demographic parameters estimated with dadi (see Results). Additionally, these simulations can be used to quantify how the smaller coalescent effective population size of D. miranda decreases our power to detect selection. Demographic simulations, incorporating distributions of selection coefficients, were performed using the simulation program SFScode (Hernandez 2008). Briefly, the program is a generalized Wright–Fisher forward simulation approach for models with selection, recombination, and demography. The demographic history for each species is modeled as estimated with dadi (table 2), and the rate and strength of selection are taken from the recurrent hitchhiking estimates obtained from the Jensen, Thornton, and Andolfatto (2008) approach (table 4). The program and documentation are available for download at: http://sfscode.sourceforge.net/SFS_CODE/SFS_CODE_home/SFS_CODE_home.html.
Table 1.
Summary Statistics of Synonymous (and nonsynonymous) Patterns of Variation in Drosophila miranda and D. pseudoobscura
| D. miranda | D. pseudoobscura | |
| average n | 14 | 14 |
| πsyn (πNS) | 0.006 (0.0003) | 0.014 (0.0011) |
| θsyn (θNS) | 0.007 (0.0004) | 0.019 (0.0013) |
| Taj Dsyn (DNS) | −0.38 (−1.1) | −0.37 (−0.26) |
| F&W Hsyn (HNS) | 0.10 (0.09) | 1.81 (1.57) |
Table 4.
Estimated Selection Parameters across Both Species for the Multilocus Polymorphism-and Divergence-Based Recurrent Selection Statistics Used Here
| Drosophila miranda | D. pseudoobscura | |
| sa | 2 × 10⁻³ | 9 × 10⁻⁴ |
| 2Nλb | 1 × 10⁻⁴ | 5 × 10⁻³ |
| αc | 0.78 | 0.83 |
| 2Nsd,e | −1.32(−1.95) | −2.67(−3.36) |
Mean selection coefficient; estimation procedure of Jensen, Thornton, and Andolfatto (2008).
Mean rate of adaptation; estimation procedure of Jensen, Thornton, and Andolfatto (2008).
Fraction of positively selected loci; estimation procedure of Eyre-Walker and Keightley (2009).
Strength of purifying selection acting on nonsynonymous sites; estimation procedure of Williamson et al. (2005).
Strength of purifying selection acting on nonsynonymous sites; estimation procedure of Loewe et al. (2006).
Patterns of diversity suggest differences in current Ne between D. miranda and D. pseudoobscura; however, the dadi estimator suggests a recent severe bottleneck for D. miranda (see Results) but a more similar long-term Ne for most of their history. An approach to estimate differences in the long-term effective population size between species is to utilize patterns of codon usage, as proposed by Bulmer (1991). For two alleles, B1 and B2, Bulmer supposes that an individual carrying B2 has a relative fitness 1 − s, such that s is the selective advantage of B2 compared with B1. Utilizing a classic result from population genetics (Wright 1931; Crow and Kimura 1970):
 |
where S = 2Nes, V = 2Nev, and U = 2Neu (where u = the mutation rate from B1 to B2 and v = the mutation rate from B2 to B1), Bulmer notes that for U + V large, the distribution will be clustered at the deterministic equilibrium. If small, the population is likely at or near one of the boundaries. Thus, the expected gene frequency is the probability of being near 1 rather than 0:
 |
Thus, in a large population, a polymorphism is expected at every codon position, with a fraction of (P) B1 codons and (1 − P) B2 codons. In a small population, a fraction P of the relevant positions are monomorphic for B1 and (1 − P) for B2. Using the above equation, we can thus relate codon usage with population size. Assuming that u = v and S = lnP(1 − P), Ne may be estimated. For this analysis, all sampled synonymous sites were considered.
We compare our results with those of Bachtrog and Andolfatto (2006), who recently fit demographic models to D. miranda polymorphism data (growth and bottlenecks). Under the growth model, N/N0 = erT, where N is the current population size, N0 is the ancestral population size, r is the growth rate, and T is the time at which growth began. They estimate a 5-fold growth with growth rate = 10 starting 0.161Ne generations in the past. Under a bottleneck model, the ancestral population, N0, is reduced to size Nb at time T for d generations, at which point it recovers to size N0, where Nb = fN0. They estimate f = 0.001, T = 0.08Ne generations ago, and d = 0.004Ne generations.
Fitting Single Hitchhiking Models
Several statistical tests to identify recent adaptive evolution were applied to genes from both species. The composite likelihood ratio test (CLRT) (Kim and Stephan 2002) uses the spatial distribution of mutation frequencies in a genomic region and levels of variability among a population sample of DNA sequences to test for evidence of a selective sweep. This method compares the ratio of the composite likelihood of the data under the standard neutral model of constant population size, neutral evolution, and random mating, LN (Data), to the composite likelihood of the data under the model of a selective sweep,  , where α is the maximum likelihood estimate (MLE) of 2Ns (where N is the effective population size and s the selection coefficient) and X is the MLE of the location of the beneficial mutation. The CLRT statistic employed is
  . The null distribution of ΛKS is obtained for each region by applying the CLRT to data sets obtained from simulations under the standard neutral model (using the program ms, Hudson 2002) with the observed region length (L) and θ. The recombination rate ρ per site is set at 8.8 × 10⁻⁸ per site per generation (Bachtrog 2008). For each locus, 1,000 neutral replicates were simulated using locus-specific parameters in order to assess significance. A complete users manual, as well as all necessary code, can be found at: http://www.yuseobkim.net/YuseobPrograms.html. The neutral model is rejected at level γ (5% used here) when the observed ΛKS is greater than the 100(1 − γ) percentile of the null distribution.
The CLRT is sensitive to deviations from the assumptions of the standard neutral model, with population substructure and recent bottlenecks leading to a high false-positive rate (Jensen et al. 2005). As one approach to examining the potential effects of demography, we considered the demographic models estimated here from dadi in order to calculate more realistic cutoff values for evaluating statistical significance. As a second approach to assess the fit of individual loci to a selective sweep model, we also employed a goodness-of-fit (GOF) test that contrasts the null hypothesis H0 that the data are drawn from a selection model as simulated by the CLRT, to the alternative hypothesis HA that the data are not drawn from such a model (Jensen et al. 2005). A composite-likelihood scheme is used to approximate the probability of the data given the null, P(Data | H0), to the probability of the data given the alternative, P(Data | HA), on the basis of the site-frequency spectrum of mutations. Simulations (using the program ssw, Kim and Stephan 2002) under the null hypothesis are used to find the critical value of the CLRT GOF statistic for each region, with locus-specific (maximum likelihood) estimates of α and X. Note that in this instance, the null model is a selective sweep as this test is employed conditional on rejecting the CLRT (Jensen et al. 2005). The program is available for download at: http://www.yuseobkim.net/YuseobPrograms.html.
In addition to skewing the frequency spectrum, positive selection may also result in strong linkage disequilibrium (LD) flanking the target of selection and reduced LD across the target (Kim and Nielsen 2004; Stephan et al. 2006; Jensen et al. 2007). We thus employ patterns of LD to test for selection at individual loci using the ωmax test (Kim and Nielsen 2004). The ω-statistic, which is defined as
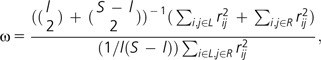 |
divides the S polymorphic sites in the data set into two groups, one from the first to the lth polymorphic site from the left and the other from the (l + 1)th to the last site (l = 2, …., S – 2), where L and R represent the left and right set of polymorphic sites, and rij2 is the squared correlation coefficient between the ith and jth sites. Thus, ω increases with increasing LD within each of the two groups and decreasing LD between the two groups (i.e., the larger the value of the statistic the more “sweep-like”’ the underlying pattern). For a locus, the value of l that maximizes ω (ωmax) is found. Singletons were excluded prior to calculation. The null distribution of ω for each genomic region is obtained from simulation under the standard neutral model (using the program ms (Hudson 2002) with fixed θ and L). As above, we set ρ = 8.8 × 10⁻⁸ per site per generation. As with the CLRT statistic, it is also possible to construct the null considering the estimated demographic models of D. miranda and D. pseudoobscura. The program is available for download at: http://www.molpopgen.org/software/libsequence.html.
Fitting Models of Recurrent Hitchhiking
To estimate selection parameters under a recurrent hitchhiking model, we use the approximate Bayesian approach of Jensen, Thornton, and Andolfatto (2008) (and see Thornton 2009). The level of reduction in variation due to recurrent selection depends on the joint parameter 2Nsλ (Wiehe and Stephan 1993). Both the rate, 2Nλ, and the fitness effect, s, of recurrent selection are estimated based upon their relationship with the means and standard deviations of common polymorphism summary statistics (the mean average pairwise diversity (π), the number of segregating sites (S), θH, and ZnS (Jensen, Thornton, and Andolfatto 2008)). Calculating these summary statistics from the observed data and from simulated data with parameters drawn from uniform priors, we implement the regression approach of Beaumont et al. (2002), which fits a local linear regression of simulated parameter values to simulated summary statistics, and substitutes the observed statistics into a regression equation. The prior distributions used were s ∼ Uniform (1.0 × 10⁻⁶, 1.0) and 4Neλ ∼ Uniform (1.0 × 10⁻⁷, 1.0 × 10⁻¹), and the tolerance, ϵ = 0.001. Estimation is based on 106 draws from the prior using the recurrent selective sweep coalescent simulation machinery described in Jensen, Thornton, and Aquadro (2008). Briefly, sweeps are occurring in the genome at a rate determined by 2Nλ, where λ is the rate of sweeps per generation. In the simulations, sweeps are allowed both within the sampled region (of size M) as well as at linked sites. The rate of sweeps within a region is thus 2NλM, and each sweep may affect up to 4Ns/ρbp. We set ρ = 8.8 × 10⁻⁸ per site per generation. For inferences on selection parameters, we assume exponential distributions of 2Nλ and s, such that each draw from the prior represents the mean of the distribution. A complete users manual, as well as all necessary code, can be found at: http://www.molpopgen.org/software/JensenThorntonAndolfatto2008/.
Polymorphism- and Divergence-Based Methods to Infer Selection
To compare polymorphism and divergence, we implemented the MK test (McDonald and Kreitman 1991). Briefly, this approach considers a 2 × 2 contingency table of polymorphic synonymous and nonsynonymous variation, with synonymous and nonsynonymous divergence. With the sequence polymorphism data for both D. miranda and D. pseudoobscura, it is possible to consider true fixed differences, avoiding issues of estimating divergence based on a single sample. Additionally, the reconstructed ANC sequence allows us to estimate lineage-specific selection. P values are calculated using a Fisher’s exact test.
We also apply a multilocus maximum likelihood version of the HKA test (Hudson et al. 1987) to our data (Wright and Charlesworth 2004), to test for the action of natural selection among candidate loci. We generated 1,000,000 cycles of the Markov chain (i.e., the chain length) assuming both neutral and selection models, to construct likelihood ratio tests to identify loci showing statistical support of selection —where twice the difference in log likelihood between the models is approximately chi-squared distributed. Again, divergence was estimated between species as well as to the inferred ANC sequence. The code and documentation are available for download at: http://www.yorku.ca/stephenw/Stephen_I._Wright/Programs.html.
As a separate approach aimed at identifying the fraction of positively selected amino acid fixations, we implemented the method of Eyre-Walker and Keightley (2009). Using information from both the SFS and divergence, this approach estimates both this proportion as well as a simple demographic model (by assuming that the population begins at equilibrium and experiences a step change in size t generation ago). The fraction of advantageous amino acid divergence (α) is estimated as:
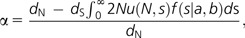 |
where f(s|a,b)—the distribution of effects of deleterious mutations—is a gamma distribution with scale parameter a and shape parameter b. N is the effective population size, u the mutation rate per site, and thus, 2Nu(N,s) gives the rate of fixation from recurrent mutation. We use synonymous sites to define a neutral class (i.e., s = 0), and dN and ds are the numbers of selected (i.e., nonsynonymous) and neutral (i.e., synonymous) substitutions per site, respectively. The difference between the observed and expected (as determined from the neutral class) rate of selected substitution corresponds to the estimate of the proportion of adaptive substitutions. All necessary code for performing this analysis is available at: http://www.lifesci.susx.ac.uk/home/Adam_Eyre-Walker/Website/Software.html.
Evaluating Models of Purifying Selection
To estimate the extent of purifying selection, we implement the approach of Loewe et al. (2006). This method was developed to characterize the fitness effects of deleterious nonsynonymous mutations, using polymorphism data from two species with different effective population sizes. Briefly, the underlying premise is that variants subject to sufficiently strong purifying selection will not increase significantly as effective population size increases, whereas neutral diversity is expected to increase proportionally with population size. Thus, the extent to which nonsynonymous diversity differs between species with different levels of synonymous site diversity should provide information regarding the strength of purifying selection. Thus, for species i, they define  .
.
Here, HPi is the mean equilibrium diversity at sites subject to purifying selection, KPi is the mean substitution rate at these sites, cN is the fraction of neutral nonsynonymous mutations, u is the expected mutation rate per site, and ca measures the substitution as a fraction of all mutations.
Assuming a model of strong purifying selection (Nes > 1), the equilibrium diversity contributed by sites subject to purifying selection is well approximated by the deterministic expression 2u/s (McVean and Charlesworth 1999). Thus, one can simplify as  where θi = 4Neiu, and sh is the harmonic mean of selection coefficients (assumed to be the same in both species), and KPi becomes negligibly small. Thus,
  . Substituting, we estimate selection as:
  .
.
In order to account for the confounding effects of population history on the inference of purifying selection, Williamson et al. (2005) proposed a likelihood model–based approach in which data from a putatively neutral class (here synonymous sites) is estimated and fixed in order to perform the estimation of selection on the putatively selected class (nonsynonymous sites). As such, this approach also provides a demographic estimate (a stepwise size change at some time in the past), which may be compared with the above described approaches. Briefly, given that the expected number of polymorphic sites with i derived alleles segregating in a sample of n is E[xi] = θ1F1(i, n; τ, υ), the probability that a particular single nucleotide polymorphism is at frequency i out of n is:
 |
where υ = ancestral population size/current population size and τ = the time of the size change. With selection, we have the function:
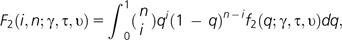 |
where there is the additional parameter γ = 2Ns, and the expected number of polymorphic sites segregating at a frequency i in a sample of size n becomes E[xi] = θ2F2(i, n, γ, τ, υ). Thus, the probability that a particular polymorphic site is at frequency i out of n is:
 |
Thus, to estimate the demographic parameters τ and υ, the likelihood function is maximized using class 1 data (synonymous sites). Then, for class 2 data (nonsynonymous sites), these parameters (τ and υ) are fixed in order to maximize the expression and estimate the selection parameter, γ. Thus, inherently, this approach does not account for the effects of linkage on synonymous sites.
Finally, the Eyre-Walker and Keightley (2009) approach described above also allows for estimation of parameters of deleterious mutations while additionally accounting for demography and the presence of beneficial mutations.
Results and Discussion
Patterns of Diversity and Estimating Species-Specific Demographic Models
In D. miranda, mean πsyn = 0.006, θsyn = 0.007, mean Tajima’s (1989) Dsyn = −0.38, and mean Fay and Wu’s (2000) Hsyn = 0.10, all suggesting a slight excess of rare variants. In D. pseudoobscura, mean πsyn = 0.014, θsyn = 0.019, mean Tajima’s Dsyn = −0.37, and mean Fay and Wu’s Hsyn = 1.81, suggesting both a similar excess of rares as well as a larger current effective population size (table 1). At nonsynonymous sites, for D. miranda, mean πNS = 0.0004, θNS = 0.0003, mean Tajima’s (1989) DNS = −1.06, and mean Fay and Wu’s (2000) HNS = 0.089. In D. pseudoobscura, mean πNS = 0.0014, θNS = 0.0011, mean Tajima’s DNS = −0.26, and mean Fay and Wu’s HNS = 1.57 (table 1).
Utilizing a recently proposed likelihood-based demographic estimator, dadi (Gutenkunst et al. 2009), we estimate demographic models for both D. miranda and D. pseudoobscura, using our large and consistently sampled data set. dadi infers demographic parameters by using a diffusion approach to fit the site-frequency spectrum of the observed data to a demographic model. Consistent with the conclusions of Bachtrog and Andolfatto (2006), we estimate a severe bottleneck for D. miranda. The estimated model begins with a much larger ancestral population size, followed by a reduction to 0.0005 of the ancestral size at 0.12 4N generations in the past, with the reduction lasting 0.02 4N generations. At this time, the population size recovers to 0.48 of the ancestral size. The relatively severe and long-lasting size reduction, followed by only moderate growth, results in a considerable reduction in diversity in D. miranda, relative to the ancestral population (fig. 1). In D. pseudoobscura, a very different demographic model is estimated. Although the best-fitting demographic model includes a relatively minor size reduction, the demographic history of D. pseudoobscura is mainly characterized by a large and relatively stable population size, which has recently experienced moderate growth (fig. 1). Specifically, the population size is estimated to have experienced a reduction to 0.81 of the ancestral size at 0.18 4N generations ago, lasting 0.09 4N generations. At this time, the population recovers to 1.35 of the ancestral size (i.e., growth). Taken together, these estimated models yield two important conclusions with regards to comparing effective population sizes between the two species: 1) in general, D. pseudoobscura and D. miranda may have had similar ancestral population sizes, and D. pseudoobscura has had a considerably more stable population history than D. miranda since the species split; and 2) D. miranda appears to have undergone a recent and severe size reduction, thus exaggerating the difference in their current effective population size.
FIG. 1.—

A cartoon schematic of the demographic models estimated for D. miranda and D. pseudoobscura. The demographic history of D. miranda is characterized by a severe bottleneck, while D. pseudoobscura is inferred to have had a relatively long-term stable population size, followed be recent growth. Thus, while the recent demographic history has served to exaggerate differences in size, the ancestral population size after the split of the two species may have been similar. T1 and T2 are the estimated times of the population size changes in 4N generations, and F1 and F2 are the changes in population size associated with the event (where F is the population size fraction relative to the ancestral size). The vertical black dotted line indicates the present time of sampling (i.e., t = 0).
Levels of synonymous polymorphism contain information about current effective population sizes (i.e., on average 4Ne generations ago) and suggest a roughly 3-fold difference in current Ne between species (bootstrap 95% CI = 2.3–4.1). Back-calculating from the dadi inference suggests an ancestral Ne of less than 2-fold difference (by assuming that the current population size of D. pseudoobscura is in fact 3-fold greater than D. miranda).
An alternative approach for estimating effective population size between species utilizes patterns of codon usage/bias (Bulmer 1991). By assuming that back and forward mutation rates are equal, it is possible to calculate selection coefficients from the proportion of optimal codon usage and transform this into an estimate of relative long-term effective population size (see calculations in Methods). The estimated ratio of population size of D. miranda versus D. pseudoobscura is 0.89 (bootstrap 95% CI = 0.79–0.93). Given that patterns of codon usage are expected to reach equilibrium very slowly, the more similar estimate in Ne for these two species appears consistent with the estimated demographic model using dadi, where the major size change between species has occurred only recently in evolutionary time. Thus, although current Ne may differ substantially between species, these calculations suggest that ancestral Ne may be much more similar (table 2). This implies that if population size is influencing rates of adaptive evolution, we might expect that these two species have experienced similar rates of adaptation in the past whereas current rates of adaptation might be more different.
Table 2.
Summary of Demographic Models Estimated Using Different Procedures
| Drosophila miranda | D. pseudoobscura | ||
| dadia(Nanc = 1) | Bottleneck: tbn = 0.12Nbn = 0.0005 Recovery: t = 0.10Ncurrent = 0.48 | Bottleneck: tbn = 0.18Nbn = 0.81 Recovery: t = 0.09Ncurrent = 1.35 | — |
| Codon usageb | — | — | 0.89 |
| DFE-αc(Nanc = 1) | Growth: tg = 0.37Ncurrent = 6.0 | Growth: tg = 0.08Ncurrent = 6.6 | — |
| Williamson et al.d(Nanc = 1) | Bottleneck: tbn = 0.10Ncurrent = 0.001 | Bottleneck: tbn = 0.12Ncurrent = 0.71 | — |
| Jensen et al.e | — | 0.26 |
Estimation procedure of Gutenkunst et al. (2009). Values indicate the reduction in variation at the time of the size change (e.g., population is reduced to 0.0005 of the ancestral size), the period of reduction in 4N generations (e.g., reduction at 0.12 4N generations, lasting 0.02 4N generations), and the size to which the population recovers after the reduction (e.g., population recovers to 0.48 of the ancestral size).
Estimation procedure of Bulmer (1991), in which a relative size is estimated based on patterns of codon usage.
Estimation procedure of Eyre-Walker and Keightley (2009) coestimated with the fraction of selected sites. A stepwise growth in population size is estimated (e.g., 6-fold growth relative to the ancestral size) at a given time (e.g., 0.37 4N generations in the past).
Estimation procedure of Williamson et al. (2005), coestimated with the fraction of selected sites. A stepwise reduction in population size is estimated (e.g., reduction to 0.001 of the ancestral size) at a given time (e.g., 0.1 4N generations in the past).
Estimation of neutral θ from the estimation procedure of Jensen, Thornton, and Andolfatto (2008)—the relative size is presented as estimated from patterns of polymorphism.
To estimate rates of current and historical selection, we apply a series of statistical tests to our data. However, because nonequilibrium demographic histories (such as those estimated above) can severely bias tests of selection (see for example, Thornton et al. 2007), a number of approaches are taken in the following sections to minimize this effect: 1) P values for tests of selection are explicitly corrected based on the inferred demographic histories; 2) some of the tests employed to estimate selection (i.e., the GOF and ωmax statistics) have been specifically proposed to be robust to demographic histories such as those estimated here; 3) methods are employed that allow for the estimation of the fraction of selected sites while coestimating a demographic model utilizing a class of neutral sites (Williamson et al. 2005; Eyre-Walker and Keightley 2009); 4) the method of Jensen, Thornton, and Andolfatto (2008) for estimating distributions of the strength and rate of recurrent hitchhiking was demonstrated to be largely robust to nonequilibrium perturbations; and 5) we perform forward simulations to explicitly model adaptive evolution using the demographic history inferred for both D. miranda and D. pseudoobscura, to directly address the question of how rates of adaptation (and statistical power to detect selection) are expected to differ for these two species.
Purifying Selection and Demography in D. miranda and D. pseudoobscura
Williamson et al. (2005) proposed an elaborate approach for quantifying the action of purifying selection that attempts to account for nonequilibrium demography. Specifically, by utilizing a putatively neutral class of sites (i.e., synonymous sites), a demographic model is first fit to the data and then selection on nonsynonymous sites is estimated under the inferred demographic model. By rescaling their estimated demographic parameters, it is possible to directly compare their inferred demographic model with the approaches described above. Although the Williamson et al. approach only estimates a simple population size change (ν) at some point in the past (τ), the results are roughly compatible with those obtained under the more complicated estimation procedure employed by dadi. Drosophila miranda is inferred to have experienced a reduction to 0.001 of the ancestral size at 0.10 4N generations ago, and D. pseudoobscura is inferred to have experienced a reduction to 0.71 of the ancestral size at 0.12 4N generations in the past (table 3). Fixing these parameters and maximizing the likelihood function (see Methods), we estimate purifying selection on amino acid mutations 2Ns = −1.32 in D. miranda and −2.67 in D. pseudoobscura. This is consistent with the hypothesis of more efficient purifying selection acting on slightly deleterious amino acid variation in the larger species (table 4).
Table 3.
Estimated Demographic Models and the Fit to the Observed Synonymous Frequency Spectrum
| Program | Command Line | Fit to Dataa |
| dadib, mir | ms 20 100000 -t 10 -eN 0 0.48 -eN 0.1 0.0005 -eN 0.12 1 | 0.79 |
| dadi, pse | ms 20 100000 -t 10 -eN 0 1.35 -eN 0.09 0.81 -eN 0.18 1 | 0.86 |
| DFEc, mir | ms 20 100000 -t 10 -eG 0.37 6 | 0.09 |
| DFE, pse | ms 20 100000 -t 10 -eG 0.08 6.6 | 0.11 |
| Williamsond, mir | ms 20 100000 -t 10 -eN 0 0.001 -eN 0.1 1 | 0.54 |
| Williamson, pse | ms 20 100000 -t 10 -eN 0 0.71 -eN 0.12 1 | 0.38 |
Fraction of replicates within σ = 0.01 of empirically observed values of both mean Tajima's Dsyn and πsyn.
In addition, we implement the approach of Loewe et al. (2006) that also utilizes divergence data for estimating a model of purifying selection. The basic idea of this method is that whereas neutral diversity will increase proportionally with increasing population size, variation subject to strong purifying selection is expected to increase less rapidly with increasing population size. Thus, a comparison between these two classes of sites can provide information regarding the relative strength of purifying selection. Consistent with the Williamson et al. approach, we estimate roughly 2-fold stronger purifying selection acting on nonsynonymous mutations in D. pseudoobscura, with 2Nes = −1.95 and 2Nes = −3.36 in D. miranda and D. pseudoobscura, respectively (table 4). The 95% confidence intervals are wide and in fact contain the Williamson et al. estimates (D. miranda: −0.9, −6.7; D. pseudoobscura: −2.4, −10.1).
We can also estimate parameters of purifying selection under nonequilibrium demography simultaneously with adaptive evolution (see below) using an approach recently described by Eyre-Walker and Keightley (2009). Because Eyre-Walker and Keightley, as well as Williamson et al., defines s as the selection coefficient against homozygotes for the deleterious allele, these values are one-half of that estimated by Loewe et al. because the methods assume semidominance. Under this approach, the DFE of amino acid mutations is estimated by maximum likelihood based on their site-frequency spectrum and that of sites assumed to be evolving neutrally (synonymous sites). Demographic changes are modeled by a single step change in size from N1 to N2 t generations in the past. Applying this approach to our data, we estimate that both species underwent recent population growth, with D. miranda having grown 6-fold at 0.37 4N generations in the past and D. pseudoobscura having grown 6.6-fold at 0.08 4N generations ago (table 2). The demographic model estimated using the Eyre-Walker and Keightley method differs considerably from the other models estimated (table 2). On one hand, this approach only models a single stepwise change in population size and thus may not be fitting the data as precisely as the multiparameter dadi approach. On the other hand, the Eyre-Walker and Keightley approach is simultaneously fitting a demographic and selection model to the data, whereas dadi estimates the demographic history ignoring natural selection. Notably, recent studies have questioned the accuracy of frequency spectrum–based approaches such as those used by Gutenkunest et al. and Williamson et al. (Myers et al. 2008).
To estimate the fit of the demographic model obtained from different methodologies, we performed coalescence simulations using the program ms (Hudson 2002). Specifically, we simulated 100,000 neutral genealogies with the demographic parameters identified under each model and estimated which fraction of simulations are compatible with the observed values for both mean Tajima’s Dsyn and πsyn. Our simulation results suggest superior data fitting of the demographic model identified by dadi relative to the approach of Eyre-Walker and Keightley, which performs rather poorly (table 3). Note, however, that the simulations are performed ignoring positive and negative selection, and the accuracy of existing methods to infer demographic parameters relative to one another in the presence of both positive and negative selection, and the impact of differing assumptions made in different approaches, remains a topic in need of more thorough investigation.
Using the Eyre-Walker and Keightley method, we can infer the DFE of newly arising amino acid mutations for both D. miranda and D. pseudoobscura (fig. 2). Consistent with a smaller Ne in D. miranda, a larger fraction of newly arising synonymous mutations are under weaker purifying selection in this species (i.e., 1 < Nes < 100; see fig. 2). Thus, although the inferred demographic model and parameters of purifying selection differ somewhat between approaches, we generally find that the strength of purifying selection is reduced in D. miranda, as expected based on its smaller effective population size.
FIG. 2.—

Distribution of fitness effects of newly arising amino-acid mutations estimated in the D. miranda and D. pseudoobscura lineages. Consistent with a smaller Ne in D. miranda, a larger fraction of newly arising nonsynonymous mutations are estimated to be under weak purifying selection (i.e., 1 < Nes <100).
Polymorphism-Based Inference of Positive Selection in D. miranda and D. pseudoobscura
We used several test statistics that identify adaptive evolution at individual loci utilizing different aspects of patterns of polymorphism (the CLRT, GOF, and ωmax tests). As stated above, these test statistics should have power to detect relatively recent adaptive evolution in the genome. In general, there is little evidence for positive selection in the frequency spectrum of D. miranda, with only marginal levels of rejection across statistics (table 5). In D. pseudoobscura, however, there are roughly 5- to 10-fold more loci that show significant evidence of selection than in D. miranda across statistics after a multiple test correction (table 5). This result is consistent with the expectation of a greater rate of adaptation in D. pseudoobscura due to its larger population size. However, given the severe size reduction estimated in D. miranda, frequency spectrum patterns associated with recent adaptation may have been eliminated by diversity-reducing bottleneck effects, resulting in less power to identify individual loci undergoing adaptive hitchhiking events (see power simulations below).
Table 5.
The Number of Significant Test Rejections across Both Species, after a Multiple Test Correction, for the Single-Locus Polymorphism and Divergence-Based Statistics Used Here
| Drosophila miranda | D. pseudoobscura | |
| CLRT | 3 | 27 |
| GOF | 1 | 11 |
| ωmax | 1 | 4 |
| MK | 2 | 18 |
| HKA | 6 | 12 |
In addition, we also employ a multilocus method to infer parameters of adaptation in the two species. The method of Jensen, Thornton, and Andolfatto (2008) can estimate distributions of s and 2Nλ under a recurrent hitchhiking model and has been shown to result in accurate estimation for data sets of this size. Applying this method to our data, we infer maximum a posteriori (MAP) estimates of the mean s = 2 × 10⁻³ and mean 2Nλ = 1 × 10⁻⁴ for D. miranda and a mean s = 9 × 10⁻⁴ and mean 2Nλ = 5 × 10⁻³ for D. pseudoobscura (fig. 3). Thus, although the distribution of the strength of selection is similar between species, there is a significant shift in the distribution of the rate of selection. Specifically, the rate of recurrent hitchhiking is estimated to be roughly an order of magnitude greater in D. pseudoobscura compared with D. miranda. Thus, consistent with the expectation of differences in current Ne between species, this polymorphism-based approach that captures recent selective events indicates a considerable difference in rates of adaptive evolution between species (table 4). Consistent with other polymorphism-based estimators, a large difference in population size is estimated between the two species, with an estimated Ne = 1.156 for D. miranda and Ne = 4.506 for D. pseudoobscura, or a relative ratio of 0.26 (table 2).
FIG. 3.

Approximate Bayesian estimation of both the strength and rate of recurrent positive selection, for randomly selected homologous genes from D. miranda and D. pseudoobscura. Estimation is based on 106 draws from the prior. Given are the marginal distributions, with D. pseudoobscura in black and D. miranda in gray. Consistent with an important role of effective population size driving adaptive evolution, roughly an order of magnitude greater rate of fixation is estimated for the currently larger D. pseudoobscura population using this polymorphism-based statistic.
Importantly, as we are estimating the joint parameter of effective population size and the rate of selection, we can determine whether the estimated difference in population size alone is sufficient to account for the estimated rate difference. If we use the coalescent effective population size estimated from dadi, λ = 5.0 × 10⁻¹⁰ and 1.3 × 10⁻⁹ in D. miranda and D. pseudoobscura, respectively; whereas for the estimated current population size from polymorphism data, λ = 4.1 × 10⁻¹¹ and 9.7 × 10⁻¹⁰, respectively. Thus, although population size explains a good deal of the estimated difference in 2Nλ, there does appear to be a consistently larger λ in D. pseudoobscura. This indicates a greater rate of fixation of beneficial mutations in the larger D. pseudoobscura population, possibly because a larger fraction of slightly beneficial mutations—although effectively neutral in D. miranda—are subject to positive selection. This is consistent with the slightly smaller estimate of s in D. pseudoobscura (fig. 3).
In order to evaluate concerns regarding both reduced power to detect selection in the severely bottlenecked D. miranda population as well as to evaluate hypotheses regarding the expected differences in rates of adaptation in these two nonequilibrium populations, we performed a series of forward simulations (see Methods). In particular, we simulated demographic models as estimated by dadi with selection parameters estimated from the recurrent hitchhiking model (s = 9 × 10⁻⁴ and mean λ = 5.0 × 10⁻¹⁰). Using these parameter assumptions, the simulated population adaptive fixation rate in D. pseudoobscura is much faster than in D. miranda (2Nλ = 1 × 10⁻⁴ for D. miranda and 5 × 10⁻³ for D. pseudoobscura). We applied the approximate Bayesian framework of Jensen, Thornton, and Andolfatto (2008) to estimate parameters of recurrent hitchhiking (RHH) from these simulated data sets. Consistent with the results of Jensen, Thornton, and Andolfatto (2008), this method is generally robust to demography (MAP estimates of 2Nλ = 8 × 10⁻⁴ and 1 × 10⁻³ [table 6], in D. miranda and D. pseudoobscura, respectively). The increased variance created by the severe bottleneck in D. miranda is elevating the estimated rate of adaptive evolution somewhat, whereas the variance reducing effect of population growth in D. pseudoobscura is resulting in a slight underestimate. Thus, the simulation results suggest that if a bias is being created by the underlying demographic histories of these species, the likely result is a homogenizing effect on estimated rates of adaptation between species (i.e., contrary to empirical observation). These simulations also serve as an effective bootstrap for determining statistical significance between the estimated distributions. For the strength of selection, the MAP estimate for D. miranda is contained within the 95% credible interval (CI) of D. pseudoobscura, and vice versa, whereas for the rate of selection, the MAP estimates are not contained within the CIs of the opposing species.
Table 6.
Summary of Forward Simulation Results
| Drosophila miranda | D. pseudoobscura | |
| Severitybnecka | 0.0005 | 0.81 |
| Timebneckb | 0.12 | 0.18 |
| Durationbneckc | 0.02 | 0.09 |
| Recoverybneckd | 0.48 | 1.35 |
| se | 9 × 10⁻⁴ | 9 × 10⁻⁴ |
| 2Nλf | 1 × 10⁻⁴ | 5 × 10⁻³ |
| MAP 2Nλg | 8 × 10⁻⁴ | 1 × 10⁻³ |
| Power (CLRT/GOF)h | 0.38 | 0.81 |
Severity of the simulated reduction in population size relative to the ancestral size.
Time of the simulated reduction in population size in 4N generations.
Duration of the simulated reduction in population size in 4N generations.
Simulated size to which the population recover postbottleneck, relative to ancestral size.
Simulated selection coefficeint.
Simulated rate of fixation.
Estimated rate of fixation for the above parameters.
Power of the CLRT/GOF combination for the above parameters.
In order to further evaluate the hitchhiking model, we use forward simulations. Given that the expected waiting time (in 4N generations) between beneficial fixations is 1/M × 2Nλ, where M is the size of the sampled region—the waiting time is relatively shorter in D. pseudoobscura owing to its larger N (for M = 100 kb, the expected time between fixations = 0.05 in D. miranda and 0.0025 in D. pseudoobscura). Consistent with previous results, the power to detect selection using single-hitchhiking model–based statistics (where the assumption is that the beneficial mutation has reach fixation immediately prior to sampling), under recurrent hitchhiking is poor (Przeworski 2002; Jensen, Thornton, and Aquadro 2008; Jensen 2009). For the CLRT/GOF combination, the power to detect hitchhiking events in D. miranda was found to be 0.38, and 0.81 in D. pseudoobscura (table 6)—where power is assessed as the fraction of replicates rejecting the neutral model in the CLRT and being consistent with a hitchhiking model in the GOF test. As opposed to RHH estimation where a bias induced by demography may be bringing estimates of the rate of adaptation nearer to one another, single hitchhiking (SHH) approaches to detect selection have reduced power in the species with the smaller effective population size. Thus, although some of the difference in rejections of SHH models can be explained by differences in power (i.e., roughly 2-fold between species), this may not be sufficient to account for the empirical observation of 10-fold more rejections between D. pseudoobscura and D. miranda (CLRT = 27 vs. 3 rejections, GOF = 11 vs. 1). Thus, consistent with the inferred difference in current Ne between species, we consistently infer higher rates of adaptive evolution in the larger D. pseudoobscura population.
Divergence-Based Inference of Selection in D. miranda and D. pseudoobscura
Divergence-based approaches to estimate rates of adaptation yield information about the action of selection over a longer time period (i.e., since the split of the two species). Thus, much of the adaptation detected using divergence data might have in fact occurred in an ANC whose population history differs substantially from that of the current population. In contrast, polymorphism-based approaches can only detect selection on a much more recent timescale (i.e., within the population coalescent time, most estimators only have reasonable power to detect selection as recent as 0.1 4Ne generations ago; Przeworski 2002). Thus, given the complicated demographic history of both D. miranda and D. pseudoobscura, we might expect polymorphism- and divergence-based approaches of selection to yield different conclusion about relative rates of adaptation in the two species. Specifically, given the longer timescale over which divergence-based estimators can detect selection, together with the much more similar ancestral population sizes estimated for the two species—we may expect that divergence-based estimates of adaptation are more similar between species. Conversely, given the much larger difference in estimated current population sizes, combined with the severe bottleneck estimated in D. miranda, polymorphism-based estimates of selection may differ more dramatically between species.
A variety of population genetics approaches exist to quantify adaptive evolution utilizing sequence divergence between species. Two of the most widely used approaches for simultaneously considering polymorphism and divergence data are the MK and HKA tests (see Methods). Applying these test statistics to our data, we generally find a greater proportion of positively selected loci in D. pseudoobscura. However, the disparity in rates of adaptive evolution between species is not as great as with polymorphism-based statistics. Consistent with our expectations based upon the estimated demographic model, only a 2- to 4-fold greater proportion of loci show significant evidence of selection in the larger D. pseudoobscura population (as opposed to 5- to 10-fold; table 5). This significant result holds both in the presence and absence of a reconstructed ANC. The recent and severe size reduction estimated for D. miranda, combined with more similar divergence-based estimates of adaptive evolution, appears consistent with a larger ancestral population size for D. miranda and thus a more similar rate of adaptation to D. pseudoobscura over a significant portion of the species history. Conversely, the recent bottleneck in D. miranda increases their difference in effective population size, thus creating a greater disparity in polymorphism-based statistics to detect adaptation.
To estimate the fraction of amino acid mutations driven to fixation by positive selection and simultaneously coestimate a demographic model, we implemented the approach of Eyre-Walker and Keightley (2009). In D. miranda, the estimated fraction of advantageous amino acid mutations is 0.78, and 0.83 in D. pseudoobscura (table 4). Again, this divergence-based estimate suggests similar rates of adaptive amino acid evolution for this species pair. Additionally, we also calculate lineage-specific estimates of α, the fraction of adaptive amino acid evolution, in D. miranda and D. pseudoobscura, using different approaches based on the MK-framework (Fay et al. 2001; Smith and Eyre-Walker 2002; Bierne and Eyre-Walker 2004). If all polymorphic sites are used for estimation, we find α to be consistently lower in the D. miranda lineage (though not significantly, table 7). However, it is well known that segregating deleterious amino acid mutations lead to biased estimates of α in this type of analysis, and more slightly deleterious amino acid mutations appear to be segregating in D. miranda (see fig. 2). A commonly used procedure to remedy this effect is to exclude low-frequency mutations. Indeed, if we only consider polymorphisms at a frequency above 10%, estimates of α are almost identical between the two species, indicating very similar lineage-specific rates of adaptive amino acid evolution.
Table 7.
ineage-Specific Estimates of α, the Fraction of Adaptive Amino Acid Substitutions (and 95% confidence intervals), Using Drosophila affinis or D. athabasca as a Second Outgroup
| Method | D. pseudoobscura | D. miranda |
| All sites | ||
| αa | 0.66 (0.55–0.74) | 0.57 (0.38–0.70) |
| αb | 0.57 (0.43–0.67) | 0.45 (0.23–0.61) |
| αc | 0.56 (0.43–0.66) | 0.49 (0.29–0.64) |
| f > 0.1d | ||
| αa | 0.72 (0.63–0.80) | 0.70 (0.55–0.80) |
| αb | 0.68 (0.58–0.76) | 0.69 (0.54–0.79) |
| αc | 0.65 (0.52–0.75) | 0.69 (0.53–0.80) |
Fraction of adaptive amino acid mutations; estimation procedure of Fay et al. (2001).
Fraction of adaptive amino acid mutations; estimation procedure of Smith and Eyre-Walker (2002).
Fraction of adaptive amino acid mutations; estimation procedure of Bierne and Eyre-Walker (2004).
Fraction of adaptive amino acid mutations ignoring polymorphism at a frequency < 0.1.
Although the demographic model estimated under the Eyre-Walker and Keightley scheme is simplified compared with the dadi procedure (inasmuch as it is restricted to a step change in population size from N1 to N2, t generations ago similar to the procedure of Williamson et al. 2005), demography is effectively coestimated with a selection model. For both species, a growth model is coestimated (see above), whereas dadi infers a bottleneck in both species, followed by growth. If selection is indeed widespread across the genome, as suggested by our results, this discrepancy between methods may be expected. In particular, dadi is estimating a purely neutral model, and it may be forced to account for the diversity-reducing and frequency spectrum-skewing effects of recurrent hitchhiking under neutrality. Preliminary analysis from forward simulation indeed suggests that dadi is biased in the direction of estimating bottlenecks of increased severity and duration, as the fraction of positively selected loci increases. Thus, although analyses consistently point to a more similar ancestral size between the two species and a large difference in current population sizes—incorporating selection into the demographic estimation procedure suggests that the nonequilibrium history may not be as severe as the neutral demographic model may suggest.
Current and Historical Selection in D. miranda and D. pseudoobscura
Consistent with previous observations in Drosophila (e.g., Andolfatto 2007), a significantly negative correlation is observed between Ka and πs in both species (i.e., levels of synonymous site diversity are reduced in genes with rapid amino acid evolution; fig. 4). Interpreting this pattern in isolation has proven difficult because models of both positive and negative selection can, in principle, produce this correlation. Specifically, recurrent fixations of advantageous amino acid mutations can each contribute to local reduction in neutral variation due to hitchhiking effects (Maynard Smith and Haigh 1974; Kaplan et al. 1989). Conversely, models of background selection (i.e., the removal of weakly deleterious mutations) can result in local reductions of Ne (Charlesworth et al. 1993). This, in turn, results in reduced levels of neutral diversity and also decreases the efficiency of purifying selection, thereby potentially causing an accumulation of weakly deleterious amino acid mutations (i.e., reducing πs and elevating Ka; Charlesworth 1994).
FIG. 4.—

Plot of ps versus Ka for D. miranda (the pooled loci of both this study, as well as the randomly selected genes of Bachtrog et al. 2009), D. pseudoobscura (the pooled loci of homologous genes across the X-chromosome) and D. melanogaster (Bachtrog 2008). The solid line indicates the significant correlation between these measures of synonymous polymorphism and non-synonymous divergence — a prediction consistent with both genetic hitchhiking and background selection - among these species of differing effective population sizes (with D. melanogaster thought to be of intermediate size between D. miranda and D. pseudoobscura).
Interestingly, for both D. miranda and D. pseudoobscura, we observe a significantly negative association between CLRT P values and Ka (fig. 5). Thus, genes that show higher rates of amino acid divergence show more statistical evidence of recent positive selection at the polymorphism level. Given that the CLRT test is robust to frequency spectrum perturbations caused by background selection (Kim and Stephan 2002), the correlation between Ka and the CLRT P values suggests that neutral polymorphism at rapidly evolving genes in Drosophila is, at least partially, influenced by recurrent positive selection. This correlation further suggests that, even between these species with different current population sizes, selection is frequent enough to create a significant relationship between polymorphism- and divergence-based comparisons of selection in both species. This also indicates that many genes that have been evolving adaptively in the more distant past (and thus have elevated Ka) are still undergoing adaptive evolution in both D. miranda and D. pseudoobscura.
FIG. 5.—

Plot of CLRT P values with Ka. (A) Drosophila miranda: The pooled loci of both this study, as well as the randomly selected genes of Bachtrog et al. (2009), are shown. (B) Drosophila pseudoobscura: The pooled loci of homologous genes across the X chromosome. The dotted line indicates the 5% significance cutoff for the CLRT. The solid line indicates the significant correlation between the observed divergence measure Ka and the calculated P value of this polymorphism-based test statistic. Results indicate a significant correlation between this polymorphism-based test of selection and this divergence-based measure, in both species—despite roughly an order of magnitude difference in effective population size. This result suggests that at least a portion of the correlation observed in figure 4 owes to hitchhiking effects.
Conclusions
Here, we present a randomly subsampled screen of over 100 genes in D. pseudoobscura, mirroring a data set previously produced for D. miranda (Bachtrog et al. 2009). Utilizing this large and consistently sampled data set, demographic models for both species are estimated. Drosophila miranda is characterized by a recent severe size reduction, whereas the D. pseudoobscura population appears relatively stable since the species split, with recent moderate growth. This implies that although current population sizes differ substantially between these two species, their ancestral sizes are more similar. Consistent with an important role of effective population size driving patterns of adaptation, we consistently infer higher rates of positive selection in the larger D. pseudoobscura population. Although more beneficial mutations occur each generation in a larger population, this also suggests that a substantial fraction of newly arising beneficial mutations are effectively neutral in the smaller D. miranda population, but under selection in D. pseudoobscura.
Our study also highlights important differences between polymorphism- and divergence-based estimators of recurrent selection models, and their interaction with the species’ underlying demographic history. Consistent with the estimated model of a historically more similar ancestral population size, divergence-based approaches to detect selection suggest rather similar rates of adaptation for both species. Conversely, polymorphism-based approaches suggest a much more prevalent role for selection shaping patterns of genomic variation in D. pseudoobscura, consistent with the inferred recent size reduction in D. miranda and recent growth in D. pseudoobscura. This discrepancy can be understood in relation to the relative timescales for which these different classes of test statistics are sensitive to detect selection.
Finally, consistent with the recent results of Haddrill et al. (2010), evidence suggests pervasive roles for both positive and purifying selection—creating significant correlations between polymorphism- and divergence-based methodologies, and being generally consistent with the Darwin domain of molecular evolution. Our study demonstrates that the comparison between both polymorphism- and divergence-based approaches, coupled with demographic estimates, may provide a much more comprehensive view of adaptation.
Acknowledgments
We thank Nick Toda for contributing to data generation. J.D.J. is supported by National Science Foundation grant DEB-1002785 and a Worcester Foundation award. D.B. is supported by National Institutes of Health grant GM076007, a Sloan Research Fellowship, and a David and Lucille Packard Fellowship.
References
- Andolfatto P. Hitchhiking effects of recurrent beneficial amino acid substitutions in the Drosophila melanogaster genome. Genome Res. 2007;17:1755–1762. doi: 10.1101/gr.6691007. [DOI] [PMC free article] [PubMed] [Google Scholar]
- Bachtrog D. Similar rates of protein adaptation in Drosophila miranda and D. melanogaster, two species with different current effective population sizes. BMC Evol Biol. 2008;8:334. doi: 10.1186/1471-2148-8-334. [DOI] [PMC free article] [PubMed] [Google Scholar]
- Bachtrog D, Andolfatto P. Selection, recombination and demographic history in Drosophila miranda. Genetics. 2006;174:2045–2059. doi: 10.1534/genetics.106.062760. [DOI] [PMC free article] [PubMed] [Google Scholar]
- Bachtrog D, Gordo I. Adaptive evolution of asexual populations under Muller’s ratchet. Evolution. 2004;58:1403–1413. doi: 10.1111/j.0014-3820.2004.tb01722.x. [DOI] [PubMed] [Google Scholar]
- Bachtrog D, Jensen JD, Zhang Z. Accelerated adaptive evolution on a newly formed X chromosome. PLoS Biol. 2009;7:e82. doi: 10.1371/journal.pbio.1000082. [DOI] [PMC free article] [PubMed] [Google Scholar]
- Beaumont MA, Zhang W, Balding DJ. Approximate Bayesian computation in population genetics. Genetics. 2002;162:2025–2035. doi: 10.1093/genetics/162.4.2025. [DOI] [PMC free article] [PubMed] [Google Scholar]
- Bierne N, Eyre-Walker A. The genomic rate of adaptive amino acid substitution in Drosophila. Mol Biol Evol. 2004;27:1350–1360. doi: 10.1093/molbev/msh134. [DOI] [PubMed] [Google Scholar]
- Bulmer M. The selection-mutation-drift theory of synonymous codon usage. Genetics. 1991;129:897–907. doi: 10.1093/genetics/129.3.897. [DOI] [PMC free article] [PubMed] [Google Scholar]
- Bustamante CD, et al. Natural selection on protein-coding genes in the human genome. Nature. 2005;437:1153–1157. doi: 10.1038/nature04240. [DOI] [PubMed] [Google Scholar]
- Bustamante CD, et al. The cost of inbreeding in Arabidopsis. Nature. 2002;16:531–534. doi: 10.1038/416531a. [DOI] [PubMed] [Google Scholar]
- Charlesworth B. The effect of background selection against deleterious mutations on weakly selected, linked variants. Genet Res. 1994;63:213–227. doi: 10.1017/s0016672300032365. [DOI] [PubMed] [Google Scholar]
- Charlesworth B, Bartolome C, Noel V. The detection of shared and ancestral polymorphisms. Genet Res. 2005;86:149–157. doi: 10.1017/S0016672305007743. [DOI] [PubMed] [Google Scholar]
- Charlesworth B, Morgan MT, Charlesworth D. The effect of deleterious mutations on neutral molecular variation. Genetics. 1993;134:1289–1303. doi: 10.1093/genetics/134.4.1289. [DOI] [PMC free article] [PubMed] [Google Scholar]
- Charlesworth D, Eyre-Walker A. The rate of adaptive evolution in enteric bacteria. Mol Biol Evol. 2006;23:1348–1356. doi: 10.1093/molbev/msk025. [DOI] [PubMed] [Google Scholar]
- Clark AG. Neutral behavior of shared polymorphism. Proc Natl Acad Sci U S A. 1997;94:7730–7734. doi: 10.1073/pnas.94.15.7730. [DOI] [PMC free article] [PubMed] [Google Scholar]
- Crow JF, Kimura M. An introduction to population genetic theory. Edina, MN: Alpha editions; 1970. [Google Scholar]
- Eyre-Walker A. The genomic rate of adaptive evolution. Trends Ecol Evol. 2006;21:569–575. doi: 10.1016/j.tree.2006.06.015. [DOI] [PubMed] [Google Scholar]
- Eyre-Walker A, Keightley PD. Estimating the rate of adaptive molecular evolution in the presence of slightly deleterious mutations and population size change. Mol Biol Evol. 2009;26:2097–2108. doi: 10.1093/molbev/msp119. [DOI] [PubMed] [Google Scholar]
- Fay JC, Wu CI. Hitchhiking under positive Darwinian selection. Genetics. 2000;155:1405–1413. doi: 10.1093/genetics/155.3.1405. [DOI] [PMC free article] [PubMed] [Google Scholar]
- Fay JC, Wyckoff GJ, Wu CI. Positive and negative selection on the human genome. Genetics. 2001;158:1227–1234. doi: 10.1093/genetics/158.3.1227. [DOI] [PMC free article] [PubMed] [Google Scholar]
- Gillespie JH. The role of population size in molecular evolution. Theor Popul Biol. 1999;55:145–156. doi: 10.1006/tpbi.1998.1391. [DOI] [PubMed] [Google Scholar]
- Gillespie JH. Genetic drift in an infinite population. The pseudohitchiking model. Genetics. 2000;155:909–919. doi: 10.1093/genetics/155.2.909. [DOI] [PMC free article] [PubMed] [Google Scholar]
- Gillespie JH. Is the population size of a species relevant to its evolution? Evolution. 2001;55:2161–2169. doi: 10.1111/j.0014-3820.2001.tb00732.x. [DOI] [PubMed] [Google Scholar]
- Gutenkunst RN, Hernandez RD, Williamson SH, Bustamante CD. Inferring the joint demographic history of multiple populations from multidimensional SNP frequency data. PLoS Genet. 2009;5:e1000695. doi: 10.1371/journal.pgen.1000695. [DOI] [PMC free article] [PubMed] [Google Scholar]
- Haddrill PR, Loewe L, Charlesworth B. Estimating the parameters of selection on nonsynonymous mutations in Drosophila pseudoobscura and D. miranda. Genetics. 2010;185:1381–1396. doi: 10.1534/genetics.110.117614. [DOI] [PMC free article] [PubMed] [Google Scholar]
- Halligan DL, Oliver F, Eyre-Walker A, Harr B, Keightley PD. Evidence for pervasive adaptive protein evolution in wild mice. PLoS Genet. 2009;6(1):e1000825. doi: 10.1371/journal.pgen.1000825. [DOI] [PMC free article] [PubMed] [Google Scholar]
- Hernandez R. A flexible forward simulator for populations subject to selection and demography. Bioinformatics. 2008;24:2786–2787. doi: 10.1093/bioinformatics/btn522. [DOI] [PMC free article] [PubMed] [Google Scholar]
- Hudson R. Generating samples under a Wright-Fisher neutral model of genetic variation. Bioinformatics. 2002;18:337–338. doi: 10.1093/bioinformatics/18.2.337. [DOI] [PubMed] [Google Scholar]
- Hudson RR, Kreitman M, Aguade M. A test of neutral molecular evolution based on nucleotide data. Genetics. 1987;116:153–159. doi: 10.1093/genetics/116.1.153. [DOI] [PMC free article] [PubMed] [Google Scholar]
- Jensen JD. On reconciling single and recurrent hitchhiking models. Genome Biol Evol. 2009;1:320–324. doi: 10.1093/gbe/evp031. [DOI] [PMC free article] [PubMed] [Google Scholar]
- Jensen JD, Kim Y, Bauer DuMont V, Aquadro CF, Bustamante CD. Distinguishing between selective sweeps and demography using DNA polymorphism data. Genetics. 2005;170:1401–1410. doi: 10.1534/genetics.104.038224. [DOI] [PMC free article] [PubMed] [Google Scholar]
- Jensen JD, Thornton KR, Andolfatto P. An approximate Bayesian estimator suggests strong recurrent selective sweeps in Drosophila. PLoS Genet. 2008;4(9):e1000198. doi: 10.1371/journal.pgen.1000198. [DOI] [PMC free article] [PubMed] [Google Scholar]
- Jensen JD, Thornton KR, Aquadro CF. Inferring selection in partially sequenced regions. Mol Biol Evol. 2008;25:438–446. doi: 10.1093/molbev/msm273. [DOI] [PubMed] [Google Scholar]
- Jensen JD, Thornton KR, Bustamante CD, Aquadro CF. On the utility of linkage disequilibrium as a statistic for identifying targets of positive selection in non-equilibrium populations. Genetics. 2007;176:2371–2379. doi: 10.1534/genetics.106.069450. [DOI] [PMC free article] [PubMed] [Google Scholar]
- Kaplan NL, Hudson RR, Langley CH. The ‘hitchhiking effect’ revisited. Genetics. 1989;123:887–899. doi: 10.1093/genetics/123.4.887. [DOI] [PMC free article] [PubMed] [Google Scholar]
- Kim Y, Nielsen R. Linkage disequilibrium as a signature of selective sweeps. Genetics. 2004;167:1513–1524. doi: 10.1534/genetics.103.025387. [DOI] [PMC free article] [PubMed] [Google Scholar]
- Kim Y, Stephan W. Detecting a local signature of genetic hitchhiking along a recombining chromosome. Genetics. 2002;160:765–777. doi: 10.1093/genetics/160.2.765. [DOI] [PMC free article] [PubMed] [Google Scholar]
- Kimura M. Evolutionary rate at the molecular level. Nature. 1968;217:624. doi: 10.1038/217624a0. [DOI] [PubMed] [Google Scholar]
- Kimura M. Rare variant alleles in the light of the neutral theory. Mol Biol Evol. 1983;1:84–93. doi: 10.1093/oxfordjournals.molbev.a040305. [DOI] [PubMed] [Google Scholar]
- Li H, Stephan W. Inferring the demographic history and rate of adaptive substitution in Drosophila. PLoS Genet. 2006;2:e166. doi: 10.1371/journal.pgen.0020166. [DOI] [PMC free article] [PubMed] [Google Scholar]
- Loewe L, Charlesworth B, Bartolome B, Noel V. Estimating selection on nonsynonymous mutations. Genetics. 2006;172:1079–1092. doi: 10.1534/genetics.105.047217. [DOI] [PMC free article] [PubMed] [Google Scholar]
- Macpherson JM, Sella G, Davis JC, Petrov DA. Genomewide spatial correspondence between nonsynonymous divergence and neutral polymorphism reveals extensive adaptation in Drosophila. Genetics. 2007;177:2083–2099. doi: 10.1534/genetics.107.080226. [DOI] [PMC free article] [PubMed] [Google Scholar]
- Maynard Smith J, Haigh J. The hitch-hiking effect of a favourable gene. Genet Res. 1974;23:23–25. [PubMed] [Google Scholar]
- McDonald JH, Kreitman M. Adaptive protein evolution at the Adh locus in Drosophila. Nature. 1991;351:652–654. doi: 10.1038/351652a0. [DOI] [PubMed] [Google Scholar]
- McVean GA, Charlesworth B. The effects of Hill-Robertson interference between weakly selected mutations on patterns of molecular evolution and variation. Genetics. 1999;155:929–944. doi: 10.1093/genetics/155.2.929. [DOI] [PMC free article] [PubMed] [Google Scholar]
- Myers S, Fefferman C, Patterson N. Can one learn history from the allelic spectrum. Theor Popul Biol. 2008;73:342–348. doi: 10.1016/j.tpb.2008.01.001. [DOI] [PubMed] [Google Scholar]
- Nielsen R, et al. Genomic scans for selective sweeps using SNP data. Genome Res. 2005;15:1566–1575. doi: 10.1101/gr.4252305. [DOI] [PMC free article] [PubMed] [Google Scholar]
- Nielsen R, Yang Z. Estimating the distribution of selection coefficients from phylogenetic data with applications to mitochondrial and viral DNA. Mol Biol Evol. 2003;20:1231–1239. doi: 10.1093/molbev/msg147. [DOI] [PubMed] [Google Scholar]
- Ohta T. Slightly deleterious mutant substitutions in evolution. Nature. 1973;246:96. doi: 10.1038/246096a0. [DOI] [PubMed] [Google Scholar]
- Przeworski M. The signature of positive selection at randomly chosen loci. Genetics. 2002;160:1179–1189. doi: 10.1093/genetics/160.3.1179. [DOI] [PMC free article] [PubMed] [Google Scholar]
- Sattath S, Elyashiv E, Kolodny O, Rinott Y, Sella G. Pervasive adaptive protein evolution apparent in diversity patterns around amino acid substitutions in Drosophila simulans. PLoS Genet. 2011;7(2):e1001302. doi: 10.1371/journal.pgen.1001302. [DOI] [PMC free article] [PubMed] [Google Scholar]
- Sawyer SA, Kulathinal RJ, Bustamante CD, Hartl DL. Bayesian analysis suggests that most amino acid replacements in Drosophila are driven by positive selection. J Mol Evol. 2003;57:S154–S164. doi: 10.1007/s00239-003-0022-3. [DOI] [PubMed] [Google Scholar]
- Sella G, Petrov DA, Przeworski M, Andolfatto P. Pervasive natural selection in the Drosophila genome? PLoS Genet. 2009;5:e1000495. doi: 10.1371/journal.pgen.1000495. [DOI] [PMC free article] [PubMed] [Google Scholar]
- Smith NG, Eyre-Walker A. Adaptive protein evolution in Drosophila. Nature. 2002;415:1022–1024. doi: 10.1038/4151022a. [DOI] [PubMed] [Google Scholar]
- Stephan W, Song Y, Langley CH. The hitchhiking effect on linkage disequilibrium between linked neutral loci. Genetics. 2006;172:2647–2663. doi: 10.1534/genetics.105.050179. [DOI] [PMC free article] [PubMed] [Google Scholar]
- Tajima F. Statistical method for testing the neutral mutation hypothesis by DNA polymorphism. Genetics. 1989;123:585–595. doi: 10.1093/genetics/123.3.585. [DOI] [PMC free article] [PubMed] [Google Scholar]
- Thornton KR. Automating approximate Bayesian computation by local linear regression. BMC Genet. 2009;10:35. doi: 10.1186/1471-2156-10-35. [DOI] [PMC free article] [PubMed] [Google Scholar]
- Thornton KR, Jensen JD, Becquet C, Andolfatto P. Progress and prospects in mapping recent selection in the genome. Heredity. 2007;98:340–348. doi: 10.1038/sj.hdy.6800967. [DOI] [PubMed] [Google Scholar]
- Wiehe TH, Stephan W. Analysis of a genetic hitchhiking model, and its application to DNA polymorphism data from Drosophila melanogaster. Mol Biol Evol. 1993;10:842–854. doi: 10.1093/oxfordjournals.molbev.a040046. [DOI] [PubMed] [Google Scholar]
- Williamson SH, et al. Simultaneous inference of selection and population growth from patterns of variation in the human genome. Proc Natl Acad Sci U S A. 2005;102:7882–7887. doi: 10.1073/pnas.0502300102. [DOI] [PMC free article] [PubMed] [Google Scholar]
- Wright S. Evolution in Mendelian populations. Genetics. 1931;16:97–159. doi: 10.1093/genetics/16.2.97. [DOI] [PMC free article] [PubMed] [Google Scholar]
- Wright SI, Charlesworth B. The HKA test revisited: a maximum-likelihood-ratio test of the standard neutral model. Genetics. 2004;168:1071–1076. doi: 10.1534/genetics.104.026500. [DOI] [PMC free article] [PubMed] [Google Scholar]
- Yang Z. PAML: a program package for phylogenetic analysis by maximum likelihood. Comput Appl Biosci. 1997;13:555–556. doi: 10.1093/bioinformatics/13.5.555. [DOI] [PubMed] [Google Scholar]
- Yi S, Bachtrog D, Charlesworth B. A survey of chromosomal and nucleotide sequence variation in Drosophila miranda. Genetics. 2003;164:1369–1381. doi: 10.1093/genetics/164.4.1369. [DOI] [PMC free article] [PubMed] [Google Scholar]