

Abstract
Direct binding by a transcription factor (TF) to the proximal promoter of a gene is a strong evidence that the TF regulates the gene. Assaying the genome-wide binding of every TF in every cell type and condition is currently impractical. Histone modifications correlate with tissue/cell/condition-specific (‘tissue specific’) TF binding, so histone ChIP-seq data can be combined with traditional position weight matrix (PWM) methods to make tissue-specific predictions of TF–promoter interactions.
Results: We use supervised learning to train a naïve Bayes predictor of TF–promoter binding. The predictor's features are the histone modification levels and a PWM-based score for the promoter. Training and testing uses sets of promoters labeled using TF ChIP-seq data, and we use cross-validation on 23 such datasets to measure the accuracy. A PWM+histone naïve Bayes predictor using a single histone modification (H3K4me3) is substantially more accurate than a PWM score or a conservation-based score (phylogenetic motif model). The naïve Bayes predictor is more accurate (on average) at all sensitivity levels, and makes only half as many false positive predictions at sensitivity levels from 10% to 80%. On average, it correctly predicts 80% of bound promoters at a false positive rate of 20%. Accuracy does not diminish when we test the predictor in a different cell type (and species) from training. Accuracy is barely diminished even when we train the predictor without using TF ChIP-seq data.
Availability: Our tissue-specific predictor of promoters bound by a TF is called Dr Gene and is available at http://bioinformatics.org.au/drgene.
Contact: t.bailey@imb.uq.edu.au
Supplementary information: Supplementary data are available at Bioinformatics online.
1 INTRODUCTION
Chromatin immunoprecipitation combined with deep sequencing (ChIP-seq) has been applied to the prediction of transcription factor binding sites (TFBSs), allowing the creation of genome-wide maps of in vivo binding sites. These maps, however, are both tissue- and condition specific, requiring ChIP-seq to be performed in each different tissue and condition of interest. The large number of tissues and conditions and the associated cost suggest that there is a strong continued role for in silico TFBS scanning. Fortunately, with the advent of ChIP-seq and other technologies such as protein-binding microarray (PBM), there has been a rapid expansion in the number of high-quality transcription factor (TF) binding site motifs available as position weight matrices (PWMs), widening the applicability of motif-based in silico prediction methods.
Most in silico methods that aim to predict TF binding (and hence gene regulation), however, are not tissue- or condition specific (which we will abbreviate as ‘tissue specific’). They base their TFBS predictions solely on the genomic DNA of the organism, in some cases also considering conservation in the DNA of related species. This approach fails to account for tissue-specific epigenetic changes to genomic DNA, which contribute to the well-known tendency of these methods to overpredict binding sites. More to the point, TFBS predictions that do not take dynamic epigenetic changes into account cannot be tissue specific.
A major type of tissue-specific epigenetic change affecting TF binding involves proteins (called histones) around which genomic DNA is wrapped to form chromatin in the eukaryotic nucleus. Approximately, one-third of histone protein sequence comprises a ‘tail’ that is subject to many different covalent post-translational modifications. Approximately, 40 different histone modifications have been mapped genome wide, allowing the link between the different histone modifications and gene transcription to be extensively studied. Generally, acetylation and phosphorylation are indicative of active transcription; sumoylation is usually found in transcriptionally silent regions; and methylation and ubiquitination are implicated in both activation and repression of transcription (Kouzarides, 2007). Together, a combination of only three of these modifications was found to be highly predictive of gene expression (Karlić et al., 2010).
Our goal is to predict the gene promoters bound by a given TF in a given tissue. Several studies have shown that the use of tissue-specific histone modification data can improve the prediction of TFBSs. These studies, however, have either used a relatively crude threshold filtering-based approach (Whitington et al., 2009), or have made genome-wide, low-resolution predictions of binding in 2–4000 bp regions (Won et al., 2010). Here, we expand on previous research by developing a chromatin modification-based tissue-specific predictor of TF binding in promoter regions. We restrict our attention to binding in the region −300 bp to +100 bp around the transcriptional start site (TSS). This allows us to more confidently associate predicted TF binding events to a particular TSS, and increases our confidence that the TF regulates a particular gene. Focusing separately on TF binding in promoters (rather than genome-wide) also eliminates the effects of differences in chromatin modifications between active promoters and enhancers.
2 METHODS
Our novel method uses a naïve Bayes score that integrates PWM scores and histone modification data to predict tissue-specific TF binding. We train and test our predictor using ChIP-seq data on histone modifications and TF binding. We test versions of our predictor that utilize a range of histone modifications in their input, but concentrate on the tri-methylation of lysine 4 on histone H3 (H3K4me3), which has been well-characterized as a marker of transcriptionally active promoters (Barski et al., 2007; Guenther et al., 2007), and has been shown to be useful for predicting TFBSs (Whitington et al., 2009). We also use our predictor to test whether, in a given tissue, all TFs recognize a broadly common H3K4Me3 signature, or if the signature varies for different TFs. We then explore whether the H3K4Me3 signature learned by our predictor varies across different tissues and species. We compare our predictor to a range of other TF binding prediction methods, including PWM scanning and two conservation-based methods (phylogenetic motif models and Bayesian branch length scores).
2.1 Scoring methods
We study the ability of five different scores to predict if a promoter is bound by a TF. We compare PWM (motif) scores, histone scores, our novel PWM+histone naïve Bayes scores and two scores based on conserved motifs.
2.1.1 PWM scores
Our tissue-independent estimate of the binding of TF f to promoter p is the maximum PWM score of the promoter,
| (1) |
where PWM(f, p, j) is the log-likelihood ratio score of a binding site for f starting at position j within promoter p (Stormo, 1998). We generate the PWM for f from a position-specific frequency motif (see Section 2.2 for motif sources) using a pseudocount of 0.01 and a 0-order background model. We calculate the 0-order background model from all promoter sequences in the the appropriate genome using fasta-get-markov (Bailey et al., 2009). We use a slightly larger definition of promoters for computing the background: −1000 bp to +200 bp relative to the TSS.
2.1.2 Histone scores
Our tissue-dependent histone score for promoter p in tissue t is the the sum of ChIP-seq tags for a histone mark hi assigned to each base pair in the promoter,
| (2) |
where TCi(t, p, n) is the number of mapped sequence tags for histone mark hi in tissue t at position j in promoter p. See Section 2.2 for tissue types and data sources and Table 2 for the set of histone modifications, h1,…, hn, that we use.
Table 2.
Overall accuracy of TF–promoter binding predictions
| Scoring method | Tissue type |
Mean AUC | ||
|---|---|---|---|---|
| GM12878 (5 TFs) | K562 (10 TFs) | mES (8 TFs) | For all tissues | |
| Naïve Bayes PWM+H3k4me2 | 0.85 (0.03) | 0.90 (0.01) | 0.85 (0.01) | 0.87 (0.02) |
| Naïve Bayes PWM+H3k4me2, H3k4me3 | 0.86 (0.03) | 0.89 (0.01) | 0.87 (0.01) | 0.87 (0.01) |
| Naïve Bayes PWM+H3k4me3 | 0.86 (0.03) | 0.90 (0.01) | 0.88 (0.01) | 0.88 (0.01) |
| Naïve Bayes PWM+H3k9ac | 0.85 (0.03) | 0.89 (0.01) | – | 0.87 (0.02) |
| Naïve Bayes PWM+H3k27ac | 0.84 (0.04) | 0.88 (0.01) | – | 0.86 (0.02) |
| Naïve Bayes PWM+H3k9ac, H3k27ac | 0.86 (0.03) | 0.88 (0.01) | – | 0.87 (0.01) |
| Naïve Bayes PWM+H3k4me2, H3k4me3, H3k9ac, H3k27ac | 0.86 (0.02) | 0.88 (0.01) | – | 0.87 (0.01) |
| Naïve Bayes Monkey++H3k4me3 | – | – | 0.87 (0.01) | 0.87 |
| PWM | 0.74 (0.06) | 0.77 (0.04) | 0.82 (0.02) | 0.77 (0.02) |
| H3K4me3 | 0.76 (0.02) | 0.81 (0.02) | 0.84 (0.02) | 0.80 (0.02) |
| Monkey+ | – | – | 0.79 (0.02) | 0.79 |
| BBLS | – | – | 0.79 (0.02) | 0.79 |
The table shows the mean AUC of different methods for scoring promoters. Results are shown for predictions in three different tissues. The number of TF ChIP-seq binding datasets used in each tissue is indicated. Results for naïve Bayes scores are the average AUC in a ‘hold-one-TF-out’ experiment. Results for the other scoring methods are the mean of the AUC values for each of the TFs used in the given tissue. All results are rounded to two decimal places. Standard errors are given in parentheses. Highest accuracies for a given tissue and overall are in bold font. Missing data for mES is due to lack of availability of histone acetylation data. Monkey+ and BBLS were only tested in mES cells. For a complementary table showing sensitivity at a false positive rate of 1%, see Supplementary Table S1.
2.1.3 PWM+histone Naïve Bayes scores
Our tissue- and factor-dependent score for binding of TF f to promoter p in tissue t is an estimate of the posterior probability of binding conditioned on the PWM and histone scores. We define this score as a function of a feature vector, X, containing the PWM and histone scores for a promoter,
and the Boolean random variable, Bpft, which is 1 if and only if the TF is bound to the promoter in the given tissue. We can the write the naïve Bayes score for promoter p for TF f and tissue t as
| (3) |
To estimate the posterior probability on the right-hand side of Equation (3), we make the standard naïve Bayes assumption that each of the features (the PWM and histone scores) is conditionally independent of every other feature, given the class (Bpft). Under these assumptions, the posterior probability is equal to
where
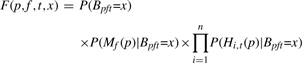 |
(4) |
We would like to estimate the conditional score distributions in the second line of the definition of F(p,f,t,x) using Gaussian distributions. The PWM scores fit reasonably well to a Gaussian distribution if we log transform them (Supplementary Fig. S2), as we do for the histone scores. We would also like the estimated distributions of PWM scores for different TFs and histone scores in different tissues to be comparable. To achieve this, we normalize all scores by converting them to z-scores:
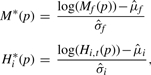 |
where the sample means and SDs of the PWM scores and the log-transformed histone scores are taken over all promoters for a single TF, f, or histone modification, hi.
We also make the assumption that the prior probability of binding is the same for all promoters, TFs and tissues and replace Bpft with the single random variable B. We now define F*(p, x) in terms of the transformed scores and B as
| (5) |
and our naïve Bayes score becomes
We train our naïve Bayes score using a training set of labeled examples of the form (X,B). We describe training in more detail in the Supplementary Material. Our estimate of P(B=1) is just the proportion of the examples where B=1, and our estimate of P(B=0) is 1-P(B=1). To estimate the conditional densities of the transformed scores, we compute the sample mean and sample variance of the score over the appropriate subset of examples, and use them as the parameters (μ, σ) of a Gaussian density.
2.1.4 Conservation-based motif scores
We study two different conservation-based scores. The first conservation-based score is based on the phylogenetic motif model concept (Hawkins et al., 2009), which uses a PWM and a multiple alignment of homologous genomic regions to predict conserved TF binding sites. We developed a score function based on the Monkey algorithm (Moses et al., 2004), which we call ‘Monkey+’. We selected Monkey as it was found to be most accurate in a recent comparison of phylogenetic motif model scanners (Hawkins et al., 2009). Monkey does not score every base in the genome nor every promoter due to alignment gaps, however, so Monkey+ assigns each promoter the maximum of the Monkey score or the PWM score (see Supplementary Material for further detail). We use a tree and alignment of mouse (mm8) and human (hg18) promoters from the multiz17way alignment (Kent et al., 2002). We find that Monkey performs better with this limited subset of species than with additional species included in the multiz17way alignment (data not shown).
Our second conservation-based score is the Bayesian Branch Length Score (BBLS) as introduced by Xie et al. (2009). We use the multiz17way alignment and tree from the UCSC Genome Browser (Kent et al., 2002). We eliminate from our mouse (mm8) promoters those that do not align to a minimum of one of the five species Mus musculus, Rattus norvegius, Homo sapiens, Canis domesticus and Bos taurus, leaving 25 014 out of 28 355 promoters. We use the maximum BBLS score for each promoter.
2.2 Constructing reference sets of bound promoters
We use TF ChIP-seq data from a number of tissues to evaluate our scoring methods. For a given TF–tissue pair, we define the set of ‘bound’ core promoters as those containing the mid-point of a ChIP-seq peak, and all other core promoters as ‘unbound’. We construct 23 sets of labeled promoters, where each set specifies the bound promoters for a given TF–tissue pair. Table 1 lists the TF–tissue pairs for which we construct labeled promoter sets. The three tissues we study come from mouse [E14.5 embryonic stem cells (mES)] and human (K562 and GM12878 cell lines). Our definition of the core promoter of a gene is the genomic region from 300 bp upstream to 100 bp downstream of the TSS. For each organism, we use all of the TSSs defined in the ‘knownGenes’ track of the UCSC Genome Browser (Hu et al., 2008). For mouse (mm8) we have 28 355 core promoters and for human (hg18) we have 42 840.
Table 1.
Overview of bound promoter reference sets
| TF | mES cells |
K562 cells |
GM12878 cells |
|||||||||
|---|---|---|---|---|---|---|---|---|---|---|---|---|
| Peaks | PP (%) | Prom+ | Prom− | Peaks | PP (%) | Prom+ | Prom− | Peaks | PP (%) | Prom+ | Prom− | |
| CTCF | 39609 | 1.9 | 958 | 27397 | 65337 | 4.4 | 3184 | 39656 | 69505 | 5.2 | 3845 | 38995 |
| Esrrb | 21647 | 2.7 | 754 | 27601 | – | – | – | – | – | – | – | – |
| Gata1 | – | – | – | – | 9463 | 4.4 | 511 | 42329 | – | – | – | – |
| Gata2 | – | – | – | – | 12488 | 4.6 | 670 | 42170 | – | – | – | – |
| c-Myc | 3422 | 19.8 | 969 | 27386 | 66453 | 11.4 | 9291 | 33549 | – | – | – | – |
| n-Myc | 7182 | 20.5 | 2100 | 26255 | – | – | – | – | – | – | – | – |
| Egr1 | – | – | – | – | 2846 | 44.6 | 1481 | 41359 | 407 | 73.2 | 400 | 42440 |
| Srf | – | – | – | – | 554 | 30.3 | 208 | 42632 | 480 | 44.8 | 269 | 42571 |
| Usf1 | – | – | – | – | 8839 | 20.0 | 2134 | 40706 | 2847 | 44.3 | 1542 | 41298 |
| Klf4 | 10875 | 12.3 | 1887 | 26468 | – | – | – | – | – | – | – | – |
| Nfyb | – | – | – | – | 15611 | 20.8 | 4040 | 38800 | – | – | – | – |
| STAT3 | 2546 | 5.1 | 170 | 28185 | – | – | – | – | – | – | – | – |
| Tcfcp2l1 | 26910 | 3.7 | 1357 | 26998 | – | – | – | – | – | – | – | – |
| Zfx | 10338 | 12.2 | 1742 | 26613 | – | – | – | – | – | – | – | – |
| Jund | – | – | – | – | 2325 | 20.0 | 601 | 42239 | 8034 | 1.2 | 106 | 42734 |
| Yy1 | – | – | – | – | 6464 | 38.9 | 3201 | 39639 | – | – | – | – |
The table shows the numbers of core promoters labeled as bound (Prom+) or unbound (Prom−), the number of declared ChIP-seq peaks, and the percentage of these that occur in our promoter regions (PP), for each TF–tissue pair. The total number of promoters (bound and unbound) is 28 355 in mES cells (mm8) and 42 840 in K562 and GM12878 cells (hg18). Missing entries correspond to TF–tissue pairs for which no ChIP-seq data is available.
To label promoters in the mES cell reference sets, we use published ChIP-seq peak data for CTCF, Esrrb, Klf4, Stat3, Tcfcp2l1, Zfx, c-Myc and n-Myc from Chen et al. (2008). We exclude a number of TFs for which Chen et al. (2008) were unable to find a motif, or found a composite motif. To label promoters in the K562 and GM12878 cell line reference sets, we use the ENCODE project (Thomas et al., 2007) transcription factor ChIP-seq ‘narrowPeak’ data. We select 10 TFs with known binding site motifs for which TF ChIP-seq data is available in K562 cells (CTCF, c-Myc, Egr1, Usf1, Srf, Jund, Nfyb, Gata1, Gata2 and Yy1), and 5 TFs in GM12878 cells (CTCF, Egr1, Jund, Srf and Usf1). We give a summary description of each of our labeled reference sets in Table 1.
2.3 PWM, sequence and histone data
For calculating PWM scores, we require a PWM for each TF of interest as well as genomic sequence for each of our core promoters. We obtain genomic sequence for each of the core promoters defined above for mouse (mm8, February 2006) and human (hg18, March 2006) using the UCSC Genome Browser (Kent et al., 2002). For the TFs CTCF, Esrrb, Klf4, Stat3, Tcfcp2l1, Zfx, c-Myc and n-Myc, we use the position-specific frequency motifs from Chen et al. (2008). For the remaining TFs, we use position-specific frequency motifs from JASPAR (Portales-Casamar et al., 2010). We give further details of the TFs and their PWMs in Supplementary Table S4.
For calculating histone scores, we use histone modification ChIP-seq data from each of the three tissues of interest. For the GM12878 and K562 cell lines from the ENCODE project, we use the ENCODE project's histone modification ChIP-seq data for each of these tissues (Thomas et al., 2007). For the E14.5 mES cells, we use histone modification data for V6.5 mouse ES cells (Meissner et al., 2008; Mikkelsen et al., 2007). Although at a slightly different developmental stage, these data have been shown to be informative for predicting TF binding in ES14.5 mES cells (Whitington et al., 2009; Won et al., 2010). We use the published ‘wig’' files, which contain smoothed counts of mapped sequence tags for bases at a 25 bp increments, and we assign this value to the tag count variable [TCi in Equation (2)] for each base pair encompassed.
2.4 Implementation
We implement each of our scoring methods (except Monkey+ and BBLS) as a downloadable tool, which we call Dr Gene. Dr Gene is written in Perl and makes use of the e1071 R package (Dimitriadou et al., 2005), and AMA from the MEME suite (Bailey et al., 2009). The distribution of Dr Gene includes our 23 annotated reference sets, core promoter sequence data (FASTA format) for human and mouse promoters, histone scores for each of the three tissues and the PWMs we use.
3 RESULTS
3.1 Predicting the promoters bound by a TF using PWM+histone naïve Bayes scores
Our initial experiments to determine the efficacy of PWM+Histone naïve Bayes scoring use ‘hold-one-TF-out’ cross-validation. This approach is intended to estimate how accurately a particular scoring function would predict which promoters are bound by a given TF (for which we have a PWM) in a given tissue. It assumes that we possess ChIP-seq data for one or more histone modifications and TF ChIP-seq for one or more TFs, which we can use to train a naïve Bayes score. In ‘hold-one-TF-out’ cross-validation, we choose a single tissue and one or more histone modifications, and train a naïve Bayes score using the chosen histone data and the ChIP-seq binding data for all but one TF. We then measure the accuracy of the naïve Bayes score by computing the ROC curve (Sing et al., 2005; Swets, 1988) for the held-out TF. To get a single measure of the accuracy of the scoring function, we compute the area under the ROC curve (AUC). We repeat this process, holding out each TF in turn, and average the individual AUC values. This gives us the cross-validated AUC for the given scoring function in the given tissue. In Table 2, we show the results for naïve Bayes scores that use the individual histone modifications H3K4me2, H3K4me3, H3K9ac, H3K27ac and several combinations thereof in mES, GM12878 and K562 cells. For comparison, Table 2 also shows the average AUC of each of the other scoring methods—PWM scores, histone scores and the conservation-based Monkey+ and BBLS scores—for the same TFs in each of the three tissues. (These AUC values are not cross-validated because those scores do not require training.)
In each of the three tissues, predicting which promoters are bound by a TF using a PWM+histone naïve Bayes score is substantially more accurate on average than using just the PWM score or either conservation-based score (Table 2). Over all tissues, the mean accuracy (AUC) increases from 0.77 using PWM scores to 0.88 using the PWM+H3K4me3 naïve Bayes scores. naïve Bayes scores using any of the histone modifications and combinations of modifications tested give similar improvements in prediction accuracy, with mean AUC over all three tissues between 0.86 and 0.88. In all three tissues, naïve Bayes scores using the single histone modification H3K4me3 works on average as well as or better than all other naïve Bayes scores in this experiment, and is available in all three tissues.
The relative performance of the different prediction methods is the same when we use sensitivity at 1% false positive rate (FPR) to measure accuracy (Supplementary Table S1). Under this metric, the PWM+histone naïve Bayes score has sensitivity between 20% and 25%, double that of both the PWM score and the two conservation-based scores (13% for Monkey+, 11% for BBLS).
The PWM+histone naïve Bayes score actually has higher accuracy (AUC) than the PWM score in 22 of the 23 folds of cross-validation (Supplementary Table S2). That is, for all but one of the held-out TFs, the PWM+histone naïve Bayes score trained using the ChIP-seq binding data for the remaining TFs is more accurate at predicting which promoters it binds in a given tissue. This improvement in accuracy is statistically significant (P<0.00001, sign test).
The single TF-tissue combination for which the PWM score is more accurate that the PWM+histone naïve Bayes score is CTCF in mES cells. CTCF is atypical of the TFs in this study, as it is an insulator-binding protein, suggested to be involved in chromatin remodeling (Fu et al., 2008). The CTCF motif also has a very high information content. Not surprisingly, both the PWM score and the H3K4me3 score distributions are quite different for CTCF than for the remaining TFs (Supplementary Table S3). As a result, the naïve Bayes score trained using hold-one-TF-out is based on estimates of the PWM and H3K4me3 score distributions that are quite inaccurate when used to predict binding by CTCF. On the other hand, the PWM score is not trained, so its accuracy as a predictor is not affected by this problem. As can be seen in Supplementary Table S3, the correct mean of the H3K4me3 score for the CTCF-bound promoters is much lower than that of the other TFs (~0.7 versus ~1.0, respectively). Similarly, the correct mean of the PWM score for the CTCF-bound promoters is much higher (~1.8 versus ~1.0). As a result, training with CTCF left out results in a naïve Bayes score whose two component features are both poor predictors of binding by CTCF. Combining these two features into a single naïve Bayes score [Equation (5)] results in a score that is less accurate than the (untrained) PWM score.
It is interesting to note from Table 2 that the H3K4me3 score, which does not use the PWM for a particular TF when scoring promoters, is at least as accurate at predicting bound promoters in a given tissue as the PWM score. In our experiments, the AUC of the H3K4me3 score is higher than that of the PWM score when predicting TF binding in each of the three tissues. The average AUC for the three tissues is 0.80 for the H3K4me3 score, and only 0.77 for the PWM score. This highlights the ability of histone modification data alone to indicate which promoters are available for binding in a given tissue. Although the PWM score and H3K4me3 have similar predictive accuracies, they are essentially orthogonal since PWM scores are the same for all tissues and H3K4me3 scores are the same for all TFs. This makes it possible for the PWM+H3K4me3 to achieve higher predictive accuracy than either of its component scores (0.88).
We find no evidence that conservation-based scores are more effective than PWM scores for predicting tissue-specific TF-bound promoters. The mean accuracy (AUC) of both BBLS and Monkey+ scores in the mES cell experiments is 0.79, no better than that of PWM scores (0.82), as shown in Table 2. What is more, Monkey+ scores are less accurate than PWM scores at predicting bound promoters in all the individual mES experiments. Similarly, BBLS scores are less accurate at predicting bound promoters for 7 of 8 individual mES experiments (Supplementary Table S1). Nonetheless, we wondered if a conservation + histone score might be more effective than a PWM+histone score, so we trained a Monkey++H3K4me3 naïve Bayes score. Somewhat surprisingly, the average accuracy of the Monkey++H3K4me3 naïve Bayes score in the mES experiments (0.87) is no better than that of the PWM+H3K4me3 naïve Bayes score (0.88) (Table 2). We thus found no evidence that scores combining conservation and histone modification are more accurate than PWM+histone scores for predicting promoters bound by a TF in a specific tissue.
3.2 Naïve Bayes score accuracy at different levels of sensitivity
Predictions of promoters bound by a TF made by the our PWM+H3K4me3 naïve Bayes scores are in fact more accurate (on average) at all sensitivity and specificity levels compared with PWM scores, as shown by the ‘average ROC’ curves in Figure 1. Whereas AUC combines the accuracy of a scoring function over all prediction sensitivities into a single number, Figure 1 shows how the average specificity of three different scoring methods—PWM+H3K4me3 naïve Bayes scores, PWM scores and H3K4me3 scores—varies with sensitivity. Each point on one of these curves shows the mean false positive rate achieved by the particular scoring function at a given true positive rate (sensitivity). We create ‘average ROC’ curves for a naïve Bayes score by averaging the ROC curves constructed above during ‘hold-one-TF-out’ cross-validation. For each score function, all ROC curves for all left-out TFs and all tissues are combined in a single averaging process, rather than first averaging over single tissues and then combining, as we do for AUC.
Fig. 1.

Accuracy of TF–promoter binding predictions at all sensitivities. Each curve shows the ‘average ROC’ of a different scoring function. Averages are over the ROC curves for a total of 23 TF–tissue combinations. Error bars show standard error. The values for the PWM+H3K4me3 predictor are cross-validated using the ‘hold-one-TF-out’ approach. Inset expands lower left corner of plot.
The fact that the ‘average ROC’ curve for the PWM+H3K4me3 naïve Bayes scores is above the curves for PWM scores and H3K4me3 scores in Figure 1 indicates that the naïve Bayes scores are more accurate (on average) for predicting binding of a TF to a promoter at all sensitivities and all specificities. Conversely, the fact that the ‘average ROC’ curves for the PWM scores and the H3K4me3 scores cross is due to PWM scores being more accurate at low sensitivity levels, but less accurate at high sensitivity levels, than H3K4me3 scores. Careful examination of Figure 1 reveals that the PWM+H3K4me3 naïve Bayes score makes about half as many false positive predictions at sensitivity levels from 10% to 80%. For example, at high sensitivity (80%), the false positive rates are 20% for naïve Bayes scores, and 40% for PWM scores. Similarly, at a false positive rate of 1%, the PWM+H3K4me3 naïve Bayes score has a mean sensitivity of 21%, compared to 13% for PWM scores (Supplementary Table S1). In terms of the actual numbers of predictions, the PWM+H3K4me3 naïve Bayes and PWM scores make on average 56 and 117 false positive predictions, respectively, when predicting 50 promoters that are actually bound (true positives) by a given TF (data not shown).
3.3 Training naïve Bayes scores: how many TF ChIP-seq datasets are enough?
The results we have described thus far (Table 2 and Fig. 1) show the predicted accuracy of the naïve Bayes score when it is trained using TF ChIP-seq binding data from (on average) about seven TFs. We wondered whether the accuracy of the PWM+histone naïve Bayes score would be greatly reduced if ChIP-seq binding data for fewer TFs were available for training the score. To investigate this, we perform a series of ‘hold-one-TF-out’ cross-validation experiments using binding and histone data from mouse ES cells. We find that the prediction accuracy of the PWM+H3K4me3 naïve Bayes score (mean cross-validated AUC) decreases only slightly (from 0.88 to 0.87) when we reduced the number of TF ChIP-seq datasets used in training from seven to one (Fig. 2). This result suggests that ChIP-seq binding data for only a single TF is sufficient to train our naïve Bayes score to predict promoters bound by other TFs in a given tissue.
Fig. 2.

A single TF ChIP-seq dataset is sufficient for training the PWM+H3K4Me3 naïve Bayes score. The plot shows the average cross-validated ROC and AUC of the PWM+H3K4Me3 naïve Bayes score trained on 1, 2, 4 or 7 TF ChIP-seq datasets from mES cells. Each ROC curve is the average of  individual ROC curves. Each individual ROC curve is estimated by applying a predictor trained using n of the 8 mES TF ChIP-seq datasets to one of the other 8-n held-out TF datasets. Error bars show standard error.
Surprisingly, it is actually possible to train a PWM+histone naïve Bayes score with no TF ChIP-seq data and yet achieve a substantial improvement in prediction accuracy compared with using PWM scores (Table 3). The idea is to use a combination of PWM scores and histone scores (but no TF ChIP-seq data) to create a training set. We label promoters with high PWM and histone scores as ‘bound’ in the training set, and promoters with very low PWM scores as ‘unbound’. We create a separate training set for each TF using its PWM, as there no need to perform cross-validation to estimate the accuracy of the approach. We train the naïve Bayes score as before but using the ‘synthetic’ training set rather than promoters labeled using TF ChIP-seq, and then compute the ROC curve of the score using the TF ChIP-seq derived labels. This training approach is similar to the one used in recent work that trained hidden Markov models for predicting TF binding to large (2 kb) enhancer and promoter regions (Won et al., 2010).
Table 3.
Accuracy of PWM+H3K4me3 naïve Bayes scores trained without using TF ChIP-seq data
| ‘Bound’ criteria |
‘Unbound’ criteria |
Mean AUC (standard error) | |
|---|---|---|---|
| H3K4me3 | PWM | PWM | |
| Top 10% | Top 100 | Random 1000 | 0.83 (0.01) |
| Top 10% | Top 250 | Random 2500 | 0.85 (0.01) |
| Top 10% | Top 500 | Random 5000 | 0.86 (0.01) |
| Top 10% | Top 1000 | Random 10 000 | 0.85 (0.01) |
| Naïve Bayes trained using TF ChIP-seq | 0.88 (0.01) | ||
| PWM scores | 0.77 (0.02) | ||
Training sets are constructed by labeling promoters as ‘bound’ or ‘unbound’ using the criteria shown. ‘Bound’ criteria are applied sequentially, using the scores indicated (columns 1 and 2). ‘Unbound’ criterion applies to the bottom 50% of promoters sorted by PWM score (column 3). The AUC (column 4) is averaged over a total of 23 TF–tissue combinations, and the best result is shown in bold. For comparison, the last two rows show the mean cross-validated AUC of PWM+H3K4me3 naïve Bayes trained using ChIP-seq data, and the average AUC of PWM scores (repeated from Table 2).
We tested four protocols for training PWM+H3K4me3 scores without TF ChIP-seq data and found that the best of them resulted in mean AUC of 0.86, nearly as good as the mean cross-validated AUC (0.88) achieved by PWM+H3K4me3 naïve Bayes trained using TF ChIP-seq data to label the training examples (Table 3). In all four protocols, we constructed a labeled set of ‘bound’ examples by first selecting the top 10% of promoters according to H3K4me3 score in a given tissue, and then choosing the top n of them according to PWM score. The values of n are given in column two of Table 3. All ‘unbound’ sets were constructed by randomly sampling m=10n promoters from among the bottom 50% of promoters, sorted by PWM score. In each protocol, the ratio of ‘bound’ to ‘unbound’ examples is thus 1:10, which is approximately equal to the average ratio in our 23 datasets when TF ChIP-seq data is used to label the promoters. In these experiments, the protocol using the top 500 promoters according to PWM score as the ‘bound’ set achieves the highest accuracy, performing substantially better than using PWM scores alone to predict promoters bound by a given TF in a given tissue (AUC = 0.86 and AUC = 0.77, respectively; sensitivity at 1% FPR is 22% and 13%, respectively). It would therefore appear that zero TF ChIP-seq datasets are (nearly) enough for training PWM+histone naïve Bayes scores.
3.4 Predicting TF-bound promoters in novel tissues
Despite the surprising accuracy of naïve Bayes scores trained without TF ChIP-seq data, we have shown that scores trained using TF ChIP-seq data from the tissue in which we wish to predict TF binding are somewhat more accurate. But what if no TF ChIP-seq data is available in the tissue of interest? We wondered if an accurate PWM+histone naïve Bayes score could be trained using histone and TF ChIP-seq data from tissue ‘A’ and then applied to predicting TF-bound promoters in tissue ‘B’. (Naturally we would use histone ChIP-seq data from tissue ‘B’ during the prediction step.) The answer is that PWM+histone naïve Bayes scores trained in this way are nearly as accurate as those trained with ChIP-seq data from the tissue of interest.
We measure the accuracy of PWM+H3K4me3 naïve Bayes scores trained and tested on different tissues using ‘hold-one-tissue-out’ cross-validation. We choose one of our three tissues as the tissue of interest, and train a naïve Bayes score using all TF and H3K4me3 ChIP-seq data from the other two tissues. Thus, each naïve Bayes score is trained with all the labeled data for about two-thirds of our 23 TF–tissue combinations. We then measure the accuracy (AUC) of the trained naïve Bayes score at predicting the promoters bound by a single TF in the (left-out) tissue of interest. To avoid bias, we omit from the training set any data for the TF used in this accuracy measurement. This only affects the six TFs for which we have ChIP-seq binding data in multiple tissues (Supplementary Table S2). The result of this experiment is that the mean AUC is identical with that achieved when we train and test in the same tissue (AUC = 0.88). What is more, among the 23 TF–tissue combinations tested, the naïve Bayes scores trained using different tissues often have higher AUC than those trained using the same tissue (6 out of 23 cases, see Supplemental Table S2). These results suggest that PWM+histone naïve Bayes scores can be used to predict TF–promoter binding in tissues other than those for which they were trained.
4 DISCUSSION
Our new method for predicting if a promoter is bound by a TF computes a score that combines the promoter's maximum PWM score and the total ChIP-seq tag counts of histone modifications within the promoter in the tissue of interest. A single histone modification—H3K4me3—appears to be as informative about the presence of TF binding as any of the combinations of histone modifications we tested. This means that our approach is immediately practical, since genome-wide ChIP-seq data for H3K4me3 in many tissues is already available. The software we make available (Dr Gene) can be used to make tissue-specific predictions of binding of a TF for which a PWM is available and for which H3K4me3 ChIP-seq data exist in the tissue of interest. As the results in Table 3 show, the accuracy of predictions will be improved if TF ChIP-data are available for at least one TF in the tissue of interest, but this is not necessary. Our predictor can be trained and used in tissues for which no TF ChIP-data yet exists.
The effectiveness of combining PWM scores with H3K4me3 scores for predicting TF binding is consistent with our previous work (Whitington et al., 2009). There, we filtered out regions with low H3K4me3 scores, and then made binding predictions based on PWM scores. A drawback of this earlier approach is that regions with marginal H3K4me3 scores are treated as ‘unbound’ without considering their PWM score at all. Our current method removes this drawback, and also focuses exclusively on predicting bound promoters. The surprising ability of the H3K4me3 score of a promoter to predict whether it is bound by any TF (see green curve in Fig. 1) indicates that this score could function as an extremely good ‘prior’ for predicting TF binding.
Evaluating in silico methods for predicting TF binding is problematic. We have chosen to consider all core promoters as ‘bound’ that contain the midpoint of a TF ChIP-seq peak. However, some ChIP-seq peaks may represent indirect binding by the TF, so the core promoter may not contain a strong match to the TF's PWM. It is tempting, therefore, to remove promoters lacking strong PWM matches from the list of bound core promoters in a given reference set. We feel that doing so would give an unfairly optimistic estimate of the accuracy of PWM-based prediction methods, including our naïve Bayes score. Reference sets constructed using a given PWM method would be biased in favor of that PWM, since any core promoters that are directly bound by the TF but do not match the (possibly inaccurate) PWM would be eliminated. Our method of evaluation therefore considers all promoters as bound for which TF ChIP-seq data indicates binding within the core promoter, even though such binding may be indirect, and thus impossible for the TF's PWM to detect. In addition, we recognize that some directly bound promoters will be labeled as ‘unbound’ in our reference sets due to missing peaks caused by limitations in the raw ChIP-seq data (e.g. sequencing depth), and by the accuracy of the algorithms used to determine ChIP-seq peaks.
Both conservation-based prediction approaches that we test here are on average actually less accurate than using a PWM to predict the core promoters bound by a TF. This does not necessarily mean that conservation-based predictions of TF binding sites are less accurate than PWM-based predictions if one is trying to predict all sites bound in any tissue. However, because we use tissue-specific ChIP-seq data to label core promoters, sites that are not bound in the tissue of interest, but are highly conserved because of function in a different tissue or tissues, will be treated as false positives. This potentially explains the slightly lower accuracy of the conservation-based prediction methods tested here. It is still somewhat unexpected that combining a conservation-based binding score with the H3K4me3 score (Monkey++H3K4me3) is no more accurate than the non-conservation-based PWM+H3K4Me3 score. This may be due to characteristics of our reference sets—such as the problems of indirectly bound promoters and missing peaks discussed above—limiting the accuracy attainable by any PWM-based prediction method.
Funding: Australian Postgraduate Award and the Queensland Government Department of Tourism, Regional Development and Industry to R.C.M; Australian Research Council Centre of Excellence in Bioinformatics, National Institutes of Health Award (RO-1 RR021692) to T.L.B.
Conflict of Interest: none declared.
Supplementary Material
REFERENCES
- Bailey T. L., et al. MEME Suite: tools for motif discovery and searching. Nucleic Acids Res. 2009;37:W202–W208. doi: 10.1093/nar/gkp335. [DOI] [PMC free article] [PubMed] [Google Scholar]
- Barski A., et al. High-resolution profiling of histone methylations in the human genome. Cell. 2007;129:823–837. doi: 10.1016/j.cell.2007.05.009. [DOI] [PubMed] [Google Scholar]
- Chen X., et al. Integration of external signaling pathways with the core transcriptional network in embryonic stem cells. Cell. 2008;133:1106–1117. doi: 10.1016/j.cell.2008.04.043. [DOI] [PubMed] [Google Scholar]
- Dimitriadou E., et al. Misc Functions of the Department of Statistics (e1071) TU Wien; 2005. [Google Scholar]
- Fu Y., et al. The insulator binding protein CTCF positions 20 nucleosomes around its binding sites across the human genome. PLoS Genet. 2008;4:e1000138. doi: 10.1371/journal.pgen.1000138. [DOI] [PMC free article] [PubMed] [Google Scholar]
- Guenther M.G., et al. A chromatin landmark and transcription initiation at most promoters in human cells. Cell. 2007;130:77–88. doi: 10.1016/j.cell.2007.05.042. [DOI] [PMC free article] [PubMed] [Google Scholar]
- Hawkins J., et al. Assessing phylogenetic motif models for predicting transcription factor binding sites. Bioinformatics. 2009;25:i339–i347. doi: 10.1093/bioinformatics/btp201. [DOI] [PMC free article] [PubMed] [Google Scholar]
- Hu J., et al. MOPAT: a graph-based method to predict recurrent cis-regulatory modules from known motifs. Nucleic Acids Res. 2008;36:4488–4497. doi: 10.1093/nar/gkn407. [DOI] [PMC free article] [PubMed] [Google Scholar]
- Karlić R., et al. Histone modification levels are predictive for gene expression. Proc. Natl Acad. Sci. USA. 2010;107:2926–2931. doi: 10.1073/pnas.0909344107. [DOI] [PMC free article] [PubMed] [Google Scholar]
- Kent W.J., et al. The human genome browser at UCSC. Genome Res. 2002;12:996–1006. doi: 10.1101/gr.229102. [DOI] [PMC free article] [PubMed] [Google Scholar]
- Kouzarides T. Chromatin modifications and their function. Cell. 2007;128:693–705. doi: 10.1016/j.cell.2007.02.005. [DOI] [PubMed] [Google Scholar]
- Meissner A., et al. Genome-scale DNA methylation maps of pluripotent and differentiated cells. Nature. 2008;454:766–770. doi: 10.1038/nature07107. [DOI] [PMC free article] [PubMed] [Google Scholar]
- Mikkelsen T.S., et al. Genome-wide maps of chromatin state in pluripotent and lineage-committed cells. Nature. 2007;448:553–560. doi: 10.1038/nature06008. [DOI] [PMC free article] [PubMed] [Google Scholar]
- Moses A.M., et al. MONKEY: identifying conserved transcription-factor binding sites in multiple alignments using a binding site-specific evolutionary model. Genome Biol. 2004;5:R98. doi: 10.1186/gb-2004-5-12-r98. [DOI] [PMC free article] [PubMed] [Google Scholar]
- Portales-Casamar E., et al. JASPAR 2010: the greatly expanded open-access database of transcription factor binding profiles. Nucleic Acids Res. 2010;38:D105–D110. doi: 10.1093/nar/gkp950. [DOI] [PMC free article] [PubMed] [Google Scholar]
- Sing T., et al. ROCR: visualizing classifier performance in R. Bioinformatics. 2005;21:3940–3941. doi: 10.1093/bioinformatics/bti623. [DOI] [PubMed] [Google Scholar]
- Stormo G.D. Information content and free energy in DNA–protein interactions. J. Theor. Biol. 1998;195:135–137. doi: 10.1006/jtbi.1998.0785. [DOI] [PubMed] [Google Scholar]
- Swets J.A. Measuring the accuracy of diagnostic systems. Science. 1988;240:1285–1293. doi: 10.1126/science.3287615. [DOI] [PubMed] [Google Scholar]
- Thomas D.J., et al. The ENCODE Project at UC Santa Cruz. Nucleic Acids Res. 2007;35:D663–D667. doi: 10.1093/nar/gkl1017. [DOI] [PMC free article] [PubMed] [Google Scholar]
- Whitington T., et al. High-throughput chromatin information enables accurate tissue-specific prediction of transcription factor binding sites. Nucleic Acids Res. 2009;37:14–25. doi: 10.1093/nar/gkn866. [DOI] [PMC free article] [PubMed] [Google Scholar]
- Won K.-J., et al. Genome-wide prediction of transcription factor binding sites using an integrated model. Genome Biol. 2010;11:R7. doi: 10.1186/gb-2010-11-1-r7. [DOI] [PMC free article] [PubMed] [Google Scholar]
- Xie X., et al. MotifMap: a human genome-wide map of candidate regulatory motif sites. Bioinformatics. 2009;25:167–174. doi: 10.1093/bioinformatics/btn605. [DOI] [PMC free article] [PubMed] [Google Scholar]
Associated Data
This section collects any data citations, data availability statements, or supplementary materials included in this article.