Abstract
Chondroitin/dermatan sulfate (CS/DS) is a glycosaminoglycan (GAG) found in abundance in extracellular matrices. In connective tissue, CS/DS proteoglycans play structural roles in maintaining viscoelasticity through the large number of immobilized sulfate groups on CS/DS chains. CS/DS chains also bind protein families including growth factors and growth factor receptors. Through such interactions, CS/DS chains play important roles in neurobiochemical processes, connective tissue homeostasis, coagulation, and cell growth regulation. Expression of DS has been observed to increase in cancerous tissue relative to controls. In earlier studies, MS2 was used to compare the types of CS/DS isomers present in biological samples. The results demonstrated that product ion abundances reflect the types of CS/DS repeats present and can be used quantitatively. It was not clear, however, to which of the CS/DS repeats the product ions abundances were sensitive. The present work explores the utility of MS3 for structural characterization of CS/DS oligosaccharides. The data show that MS3 product ion abundances correlate with the presence of DS-like repeats in specific positions on the oligosaccharide chains.
Keywords: Glycosaminoglycan, chondroitin sulfate, dermatan sulfate, tandem MS, multistage MS, electrospray MS
Introduction
Chondroitin sulfate (CS) and dermatan sulfate (DS) proteoglycans are abundant extracellular matrix molecules the glycosaminoglycan (GAG) chains of which mediate both their physicochemical and adhesive properties and thus their biological activities. Protein-CS/DS binding is a hallmark for CS/DS proteoglycans and serves to modulate the activities of growth factors including the fibroblast growth factor family and hepatocyte growth factor [1–3]. CS chains bound to the aggrecan and related proteoglycans are present in high concentrations in cartilage and other connective tissues and function in the maintenance of tissue viscoelasticity [4]. The structure of the CS chains in cartilage changes during development and with the progression of osteoarthritis.
The structure of nascent CS chains is elaborated in the Golgi apparatus through the action of a series of biosynthetic enzymes [5]. Because these reactions do not go to completion, mature CS chains are heterogeneous mixtures of variants on a conserved domain structure [6]. The nascent chains consist of repeating units of (4GlcAβ1–3GalNAcβ1-)n attached to Ser residues via a tetrasaccharide core of structure 4GlcAβ1–3Galβ1–3Galβ1–4Xylβ1-. During biosynthesis, GlcA residues may undergo sulfation at the 4O- and/or 6O-positions of GalNAc and at the 2O-position of GlcA. Depending on the tissue location, CS may be modified by epimerization of the C5 position of GlcA to form IdoA by DS epimerases [7]. The mature chains typically reflect domains of high and low IdoA content, and such residues are often found adjacent to GalNAc-4O-sulfate residues. CS/DS chains are often classified based on their compositions. Those with a high content of GlcA-GalNAc4S are known as CS type A (CSA), those with a high content of IdoA-GalNAc4S as CSB (also known as DS) and those with GlcA-GalNAc6S as CSC.
The patterns of CSB-like repeats (4IdoAα1-3GalNAc4Sβ1-) in CS/DS chains arises from DS epimerases 1 and 2 [7, 8] in conjunction with DS 4-O-sulfotransferase [9]. The epimerase reaction occurs to the nascent chondroitin chain and is reversible. Subsequent 4-O-sulfation of the adjacent GalNAc residue is believed to be required to lock the residue as IdoA. As a result, low levels of DS 4-O-sulfotransferase are correlated with the presence interspersed patterns of repeats containing IdoA and GlcA. Thus the interplay of expression levels of epimerases and sulfotransferases, among other factors, gives rise to CS/DS structures specific to individual cellular phenotypes. DS epimerase 2 is expressed at high levels in brain, and has been linked genetically to bipolar disorder [8].
Expression of CS/DS proteoglycans inhibit neuronal outgrowth and prevents repair of spinal cord injury [10]. This activity has been correlated with expression of specific CS/DS sulfotransferases [11]. The activity of CS/DS in brain has been correlated with spatio-temporal regulation of the expression of key sulfated disaccharide units, resulting from the activities of specific sulfotransferases and epimerases [12, 13]. In order to expand the understanding of the functional roles of expression CS/DS disaccharides in the context of flanking oligosaccharide structures, there is clear potential value for tandem MS. Such an approach has the potential to be used as a means of gas-phase decomposition of CS/DS oligosaccharides, enabling determination of key isomeric structural elements.
Given the presence of significant heterogeneity of CS/DS chains, methods are needed to asses both the chain compositions and the abundances of isomers present. Electrospray ionization mass spectrometry (ESI MS) has been shown to be effective for determination of the masses of CS oligosaccharides [14–17]. Mass determination serves to define the oligosaccharide chain length and number of sulfate groups. On-line liquid chromatography (LC) MS systems have been developed using size exclusion chromatography [14, 18–20], graphitized carbon chromatography [21–23], reversed phase ion pairing [24–27] and hydrophilic interaction chromatography [28–32]. Approaches for analysis of CS/DS oligosaccharides using capillary electrophoresis/MS have also been described [33–35].
When exhaustively depolymerized using polysaccharide lyase enzymes, a mixture of disaccharides is produced. Determination of the abundances of the isomeric 2O-, 4O- and 6O-sulfated disaccharides in such mixtures is an important part of characterization of a CS proteoglycan sample. A tandem mass spectrometric method for disaccharide analysis has been developed that compares product ion abundances of unknown disaccharide mixtures to those of purified standards to calculate mixture percentages [36–39]. For analysis of oligosaccharides, tandem MS is useful for assigning positions of over-sulfated GalNAc residues [40]. It is also important to be able to assign the abundances of 4O- and 6O-sulfation at each GalNAc residue [33, 35] in the chain under conditions in which isomeric mixtures exist. Toward these ends, it has been demonstrated that the abundances of key product ions are diagnostic for the overall content of CSA-like, CSB-like and CSC-like repeats [41, 42]. This approach has been used in an on-line LC/MS format to compare the CS/DS glycoforms present among isolated proteoglycans and among different tissues [29–32]. These results demonstrated the principle that product ion abundances reflect isomeric GalNAc sulfation positions in CS oligosaccharides. They do not produce information on sulfation site occupancy on individual GalNAc residues.
The focus of the present work is to develop methods to produce detailed information on the sulfation of individual residues in CS/DS chains. Towards these ends, a series of oligomers were prepared from CSA, CSB, CSC ranging from dp 10-dp 14 and analyzed MS3. The results demonstrate the increased level of structural detail obtained through such a tandem MS approach for CS/DS analysis.
Experimental
Materials
CS type A (GlcA, GalNAc-4-sulfate), CSB (IdoA, GalNAc-4-sulfate) CSC (GlcA, GalNAc-6-sulfate), and chondroitinase ABC were obtained from Seikagaku America/Associates of Cape Cod (Falmouth, MA). 2-Anthranilic acid (2AA) was purchased from Fluka Chemika (Buchs, Switzerland).
Preparation of CS oligosaccharides
Fresh CSA, CSB, or CSC standards (5 μL, 2 mg/mL) were mixed with water (87 μL), Tris-HCl buffer (5 μL, 1M, pH 7.4), ammonium acetate (0.5 μL, 1M) and chondroitinase ABC (2.5 μL, 4 mU/μL), and digested at 37°C to an absorbance value (232 nm) corresponding to liberation of 10% of the disaccharide units in the intact chains, and boiled for 1 min. Partial depolymerization products were lyophilized for subsequent reductive amination. Oligosaccharides were reductively aminated using 2AA and purified according to published procedures [29, 31]. The reductively aminated oligosaccharides were purified using amide-silica hydrophilic interaction chromatography (HILIC) as follows: 2.1 mm X 5 cm Amide-80 (Tosoh Bioscience, Montgomery, PA, USA), mobile phase A = 10% acetonitrile, 0.05 M formic acid solution, pH 4.4 adjusted using ammonium hydroxide, B = 20% A in acetonitrile, flow rate = 250 μL/min, gradient from 80%–20% B in 60 min.
Tandem MS of CS oligosaccharides
CS oligosaccharides were analyzed using a Thermo-Fisher Scientific LTQ-Orbitrap mass spectrometer. Samples were dissolved at a concentration of 10 μM in a solution of methanol:water:ammonium hydroxide (30:70:0.2%) and analyzed using a pulled silica capillary nano-scale electrospray interface using negative polarity. The following negative polarity source conditions were used: spray voltage 1500, capillary voltage temprature 240 °C, capillary voltage −15, tube lens voltage −34. The masses of all oligosaccharides were determined using high resolution detection in the Orbitrap analyzer. All tandem mass spectra were acquired in the LTQ analyzer using an isolation width of 3 u. For MS2 experiments, collision voltage was set to 20. For MS3 experiments, collision voltage was set to 20 V for both stages of dissociation. Tandem mass spectra were summed from approximately 1 min. of accumulated data. The following product ions observed in MS2 were selected for MS3: Y32−, Y53−, Y74−, Y95− and B52−, B73−, B94−. Data were acquired in triplicate technical replicates. Relative product ion abundances were calculated from the peak intensities determined using the Xcalibur data system.
Results
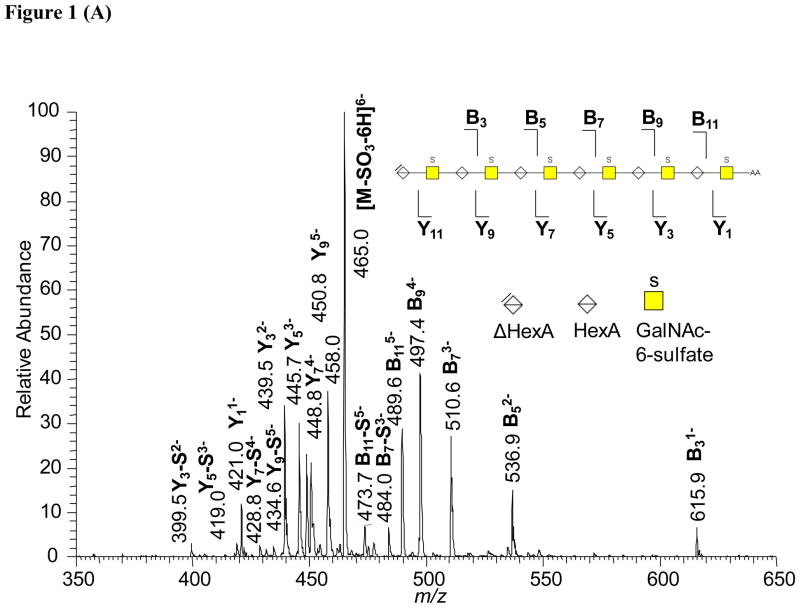
CS chains were subjected to limited digestion using chondroitinase ABC, after which the oligosaccharide products were reductively aminated using 2AA [31, 32]. The resultant 2AA labeled oligosaccharides were fractionated using HILIC and used for tandem mass spectrometric studies. Figure 1A shows the negative ion ESI tandem mass spectrum of CSC Δdp12–2AA acquired by selecting the [M-6H]6− ion. Typical of CS oligosaccharides, a series of B- and Y-type ions was observed, corresponding to cleavage of every HexA-GalNAc bond. An ion corresponding to [M-SO3-6H]6− was observed, the abundance of which is highest for the CSC isomer relative to CSA and CSB, respectively, as has been observed using smaller oligosaccharides [32, 43]. Ions produced from loss of sulfate from some B- and Y-type ions were observed in relatively low abundances.
Figure 1.
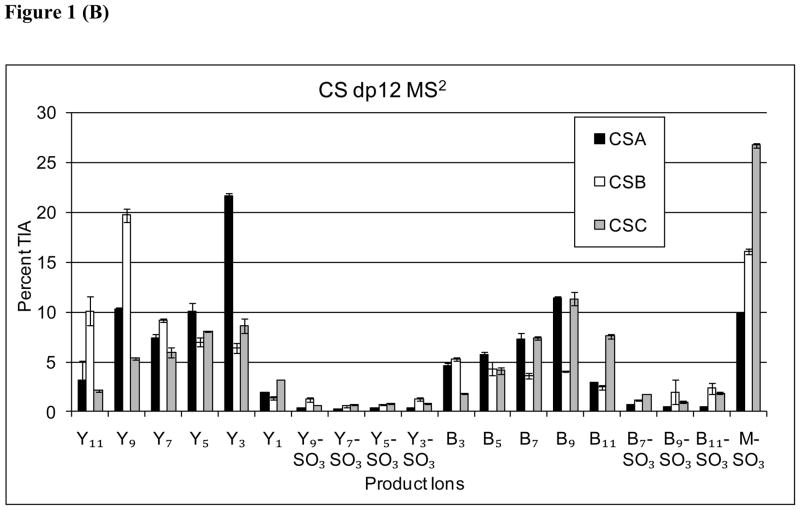
(A) Representative tandem mass spectrum of 2AA labeled CS: CSC dp12-2AA. The ion at m/z 458 is an internal fragment ion commonly observed for CS oligosaccharides. The inset diagrams the product ions observed. The Y11 is observed as a low abundance ion at m/z 451.8 (not labeled). Loss of SO3 is abbreviated as “S”. (B) Comparison of product ion abundances from CAD tandem MS of Δdp 12-2AA from CSA, CSB, and CSC, respectively. TIA = total ion abundance.
Oligosaccharides derived from CSA, CSB, and CSC produced the same product ions but in distinct abundance patterns. Figure 1B compares the product ion abundances for dp12 for CSA, CSB and CSC. The results showed the Y3 ion was most abundant for CSA dp12, and therefore diagnostic for this CS isomer. The abundances of Y9 and Y11 were diagnostic of CSB. Those of the [M-SO3-6H]6− and B11 ions were diagnostic of CSC. These results are consistent with studies of dp4-dp8 CS oligosaccharides [30, 41, 42]. The abundances of individual product ions are likely to reflect the CS oligosaccharide structure in the vicinity of the cleaved bond. Thus, in order to increase the amount of structural information produced, multistage MS was used as a means of degrading the CS oligosaccharides in the gas phase.
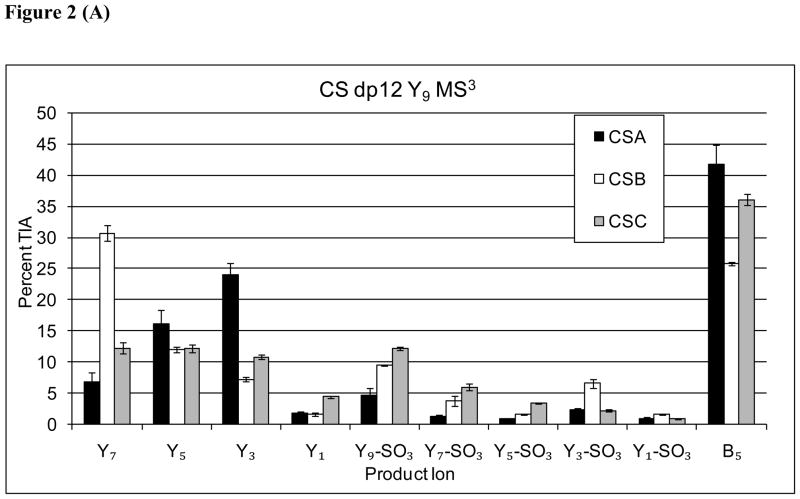
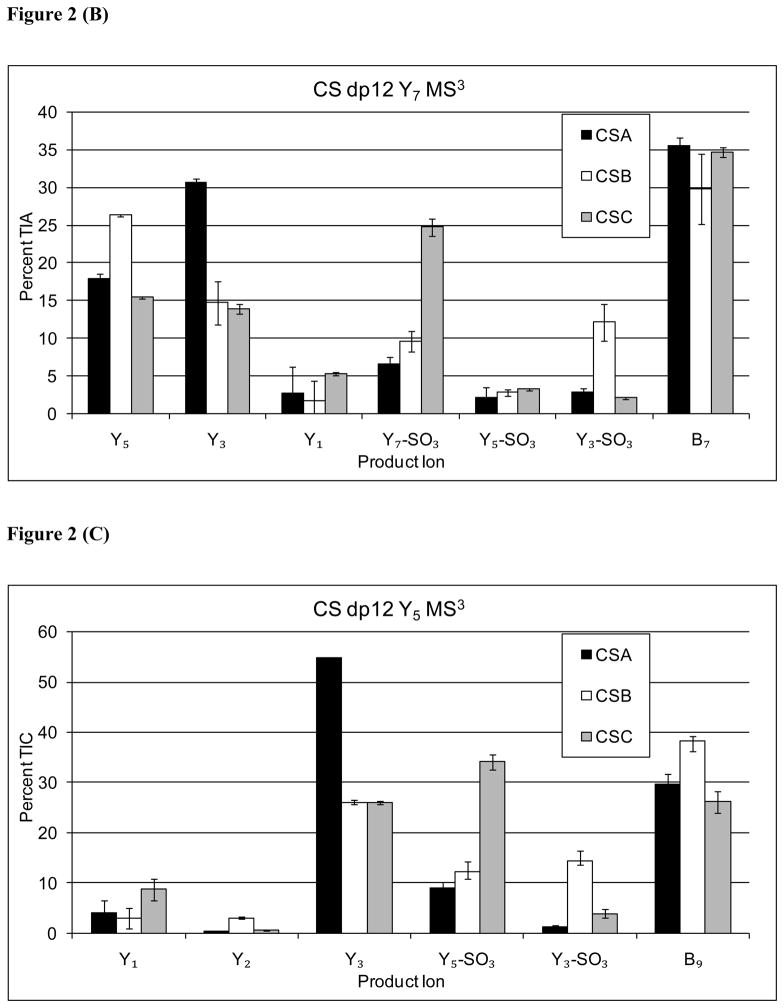
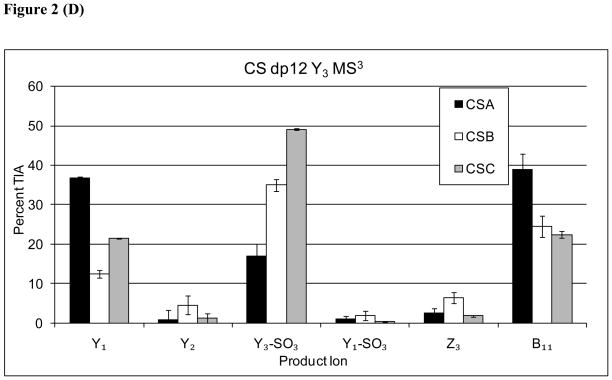
A series of MS3 dissociation experiments were conducted on the Y32−, Y53−, Y74−, and Y95− ions observed in the MS2 stage for dp 12 [M-6H]6− precursor ion for CSA, CSB and CSC. All measurements were performed in triplicate. The product ion abundances for each Y ion are shown in Figure 2. The MS3 product ion patterns of Y9 (2A), Y7 (2B), and Y5 (2C) all show that the abundance of Y3 is diagnostic for the CSA isomer. Thus, the information on the CSA isomers produced from MS3 of Yn ions was the same as that observed in the MS2 product ion pattern. When MS3 product ion was diagnostic was acquired on the Y3 ion (2D), the resultant Y1for CSA. This observation is consistent with the abundance of this ion correlating with the sulfation position at the reductively aminated GalNAc residue.
Figure 2.
(A) Comparison of Y-type MS3 product ion abundances for Δdp12 [M-6H]6− (A) Y95−→, (B) Y74−→, (C) Y53−→, (D) Y32−→.
For MS3 dissociation of Y9, the Y7 product ion was most abundant for the CSB isomer (2A). Similarly, MS3 of Y7 (2B) showed Y5 to be diagnostic for CSB. For MS3 of Y5 (2C), however, the analogous pattern was not observed, possibly due to the high abundance of Y3 for the CSA isomer. Thus, it appears that additional information on the presence of CSB-like repeats was generated from MS3 of the Y9 and Y7 ions. In addition, MS3 of all Yn ions showed a Y3-SO3 ion diagnostic for CSB. The results are consistent with improved coverage of CSB-like disaccharide repeats, reflecting the epimeric state of the HexA residue adjacent to the cleaved glycosidic bond.
For MS3 of all Yn ions, the abundances of ion produced by loss of SO3 from the MS3 precursor were diagnostic for CSC. A similar series of data were acquired for CSA, CSB, and CSC dp 10 as shown in Supplementary Figs. 1 and 2 and dp14 in Supplementary Figure 3 and 4. The ion abundance trends are analogous to those observed for dp12, and support the same conclusions.
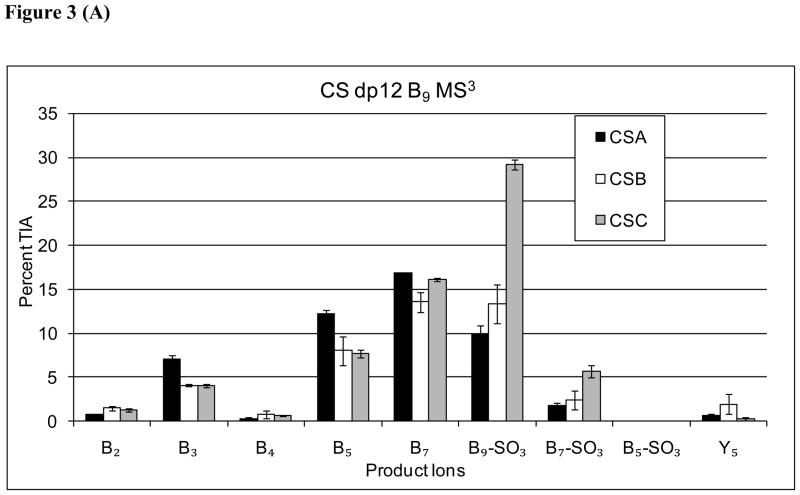
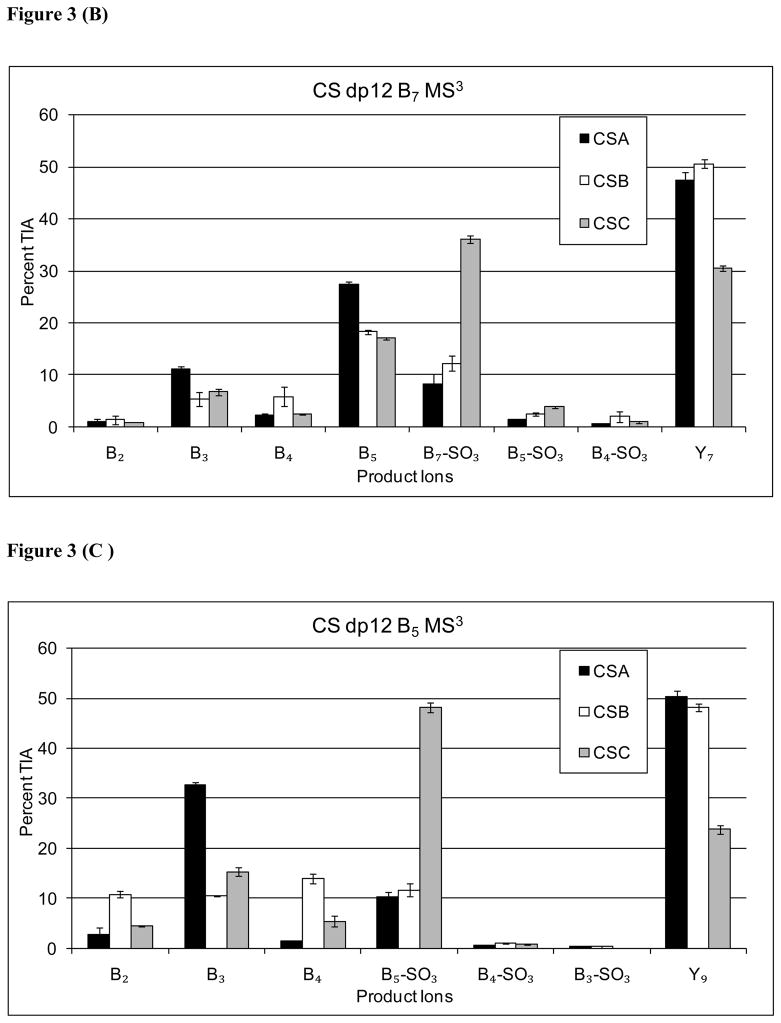
The product ion abundances resulting from MS3 for B52−, B73− and B94− ions for CS dp 12 are shown in Figure 3. The data showed that the MS3 B3, and B5 product ion abundances to be diagnostic for CSA, although the abundance differences were moderate. Ions produced from loss of SO3 from the MS3 precursor ion were observed to be diagnostic for CSC. The only ion in the MS3 profiles of Bn→ ions diagnostic for CSB was B4, although the low abundance made this ion of limited practical value.
Figure 3.
Comparison of B-type MS3 product ion abundances for Δdp12 [M-6H]6− (A) B94−→, (B) B73−→, (C) B52−→.
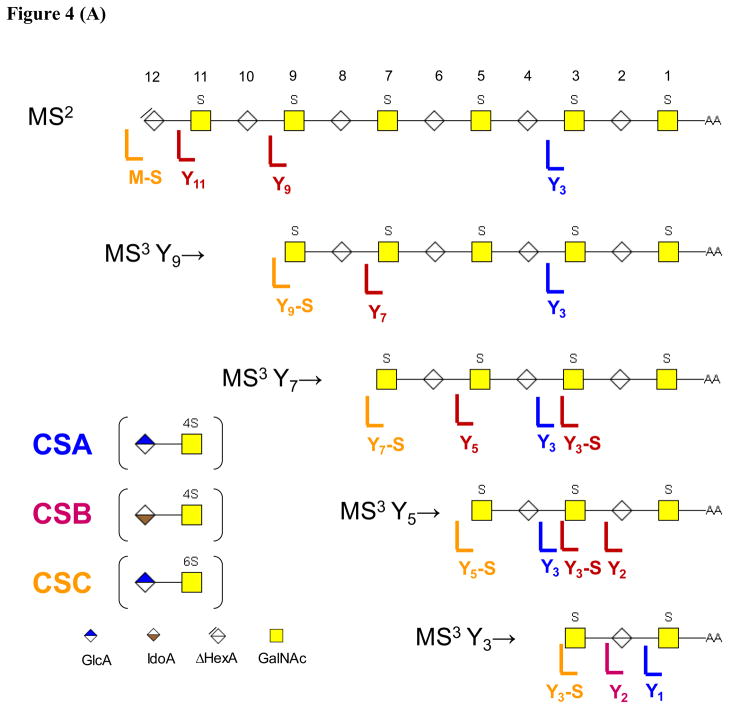
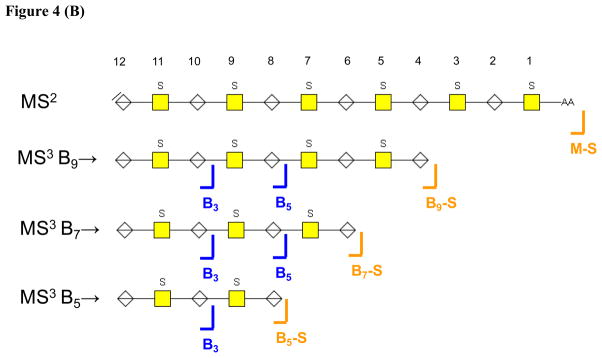
The product ion patterns diagrammed in Figure 4 were observed for CS/DS Δ-oligosaccharides dp10 (Supplementary data Figures 1, 2), dp 12 (Figures 1, 2, 3) and dp14 (Supplementary Figures 3,4). A summary of the results for MS3 of Y-type product ions is shown in Figure 4A. The diagnostic ion for CSA is Y3 for all CS oligomers tested, indicating that it is possible to produce information on the presence of CSA-like repeats corresponding to residues #3 and #4 in Figure 4A. For CSB, information is produced at the non-reducing end of the precursor ion oligosaccharide. This pattern is consistent with the conclusion that the abundances of such ions is diagnostic for the epimerization of the adjacent HexA residue, #10 in the MS2 stage, #8 in the MS3 Y9→ stage and #6 in the MS3 Y7 stage. In addition, the Y3- SO3 ion was diagnostic for the epimerization state of #4 in the MS3 Y7→ and Y5→ stages. Theabundance of the Y2 ion appeared to be diagnostic for the epimerization state of #2 in the MS3 Y5→ and Y3→ stages. Thus, there is evidence that MS3 dissociation of Yn ions produces information on the epimerization state of every uronic acid residue in the oligosaccharides. For CSC, diagnostic ions result from loss of SO3 from the precursor selected for each MS3 stage. It is not clear which sulfate group on the chains dissociates preferentially to produce this pattern. In summary, there is clear value in performing MS3 stages on Yn ions, in particularly for determining patterns of CSB-like repeats.
Figure 4.
Summary of diagnostic product ions for (A) Y-type MS3 product ions and (B) B-type MS3 product ions. For this figure, SO3 loss is abbreviated as S.
As shown in Figure 4B, MS3 dissociation of Bn ions produced B3 and B5 ions the abundances of which were diagnostic for CSA repeats. It is likely that these ions were diagnostic for the position of sulfation at positions #9 and #7, respectively. Losses of SO3 from the MS3 precursor ions were again diagnostic for CSC, but it was not possible to surmise the position of the sulfate group lost. In summary, the amount of structural information produced presence of CSA-like repeats in the oligosaccharides was increased by MS3 of Bn ions.
Conclusions
The importance of determining patterns of CSB-like repeats in CS/DS is highlighted by the recent findings that DS epimerase enzyme activity levels are elevated in cancerous tissue [7, 44, 45]. In the presence of high levels of DSepiI and DS4ST1, extended repeats of IdoA-GalNAc4S result in the CS/DS chains [7–9]. In the presence of lower levels of these enzymes, interspersed repeats of GlcA-GalNAc and IdoA-GalNAc result. The presence of interspersed versus extended patterns of CSB-like repeats has considerable biological relevance, due to the strong potential influence on protein binding interactions. Thus, there is clear need for effective methods for analysis of such patterns.
In considering the tandem mass spectrometric options, CAD-based methods are compatible with tandem mass spectrometric glycomics analysis. The mass spectral acquisition may also be automated to facilitate generation of robust and reproducible data. The present work showed that the amount of information produced on CS/DS oligosaccharide fine structure was dramatically improved by the addition of an MS3 stage. The results were consistent with MS3 ion abundances indicative of the epimerization or sulfation states of individual residues.
In order to use tandem MS for CS/DS oligosaccharides, it is recommended that commercial CSA, CSB and CSC oligosaccharides be prepared and analyzed as standards on the same day as oligosaccharides from unknown samples. In addition, it is recommended that a mixture of all three standards be analyzed on each day of instrument operation as a test of instrument performance over time. It is recommended that all samples (standards and unknowns) be analyzed in random order. In this manner, the investigator will be assured that all instrumental conditions are set to achieve reproducible results.
Activated electron dissociation, particularly electron detachment dissociation, results in the formation of cross-ring cleavage pathways that directly differentiate uronic acid epimers [46–50]. The challenge to this work is to increase the dissociation efficiency to enable glycomics studies of CS/DS expression patterns. It is envisioned that practical analysis of CS/DS fine structure will entail a combination of approaches. Multistage MS using CAD will be useful for comparative studies of fine structure of unknown CS/DS samples relative to those of CSA, CSB and CSC reference samples, as described in the present work. Activated electron dissociation will be useful for providing absolute structural information on selected samples.
Supplementary Material
Acknowledgments
This work was funded by NIH grants P41RR10888, R01098950, and S10RR020946
Abbreviations
- CS
chondroitin sulfate
- CSPG
chondroitin sulfate proteoglycan
- DS
dermatan sulfate
- ESI
electrospray ionization
- GAG
glycosaminoglycan
- HILIC
hydrophilic interaction chromatography
- MS
mass spectrometry
Footnotes
Publisher's Disclaimer: This is a PDF file of an unedited manuscript that has been accepted for publication. As a service to our customers we are providing this early version of the manuscript. The manuscript will undergo copyediting, typesetting, and review of the resulting proof before it is published in its final citable form. Please note that during the production process errors may be discovered which could affect the content, and all legal disclaimers that apply to the journal pertain.
References
- 1.Lyon M, Deakin JA, Gallagher JT. The mode of action of heparan and dermatan sulfates in the regulation of hepatocyte growth factor/scatter factor. J Biol Chem. 2002;277:1040–1046. doi: 10.1074/jbc.M107506200. [DOI] [PubMed] [Google Scholar]
- 2.Penc SF, Pomahac B, Winkler T, Dorschner RA, Eriksson E, Herndon M, Gallo RL. Dermatan sulfate released after injury is a potent promoter of fibroblast growth factor-2 function. J Biol Chem. 1998;273:28116–28121. doi: 10.1074/jbc.273.43.28116. [DOI] [PubMed] [Google Scholar]
- 3.Trowbridge JM, Rudisill JA, Ron D, Gallo RL. Dermatan sulfate binds and potentiates activity of keratinocyte growth factor (FGF-7) J Biol Chem. 2002;277:42815–42820. doi: 10.1074/jbc.M204959200. [DOI] [PubMed] [Google Scholar]
- 4.Knudson CB, Knudson W. Cartilage proteoglycans. Semin Cell Dev Biol. 2001;12:69–78. doi: 10.1006/scdb.2000.0243. [DOI] [PubMed] [Google Scholar]
- 5.Fransson LA, Belting M, Jonsson M, Mani K, Moses J, Oldberg A. Biosynthesis of decorin and glypican. Matrix Biol. 2000;19:367–376. doi: 10.1016/s0945-053x(00)00083-4. [DOI] [PubMed] [Google Scholar]
- 6.Silbert JE. Biosynthesis of chondroitin sulfate. Chain termination. J Biol Chem. 1978;253:6888–6892. [PubMed] [Google Scholar]
- 7.Maccarana M, Olander B, Malmstrom J, Tiedemann K, Aebersold R, Lindahl U, Li JP, Malmstrom A. Biosynthesis of dermatan sulfate: chondroitin-glucuronate C5-epimerase is identical to SART2. J Biol Chem. 2006;281:11560–11568. doi: 10.1074/jbc.M513373200. [DOI] [PubMed] [Google Scholar]
- 8.Pacheco B, Malmstrom A, Maccarana M. Two dermatan sulfate epimerases form iduronic acid domains in dermatan sulfate. J Biol Chem. 2009;284:9788–9795. doi: 10.1074/jbc.M809339200. [DOI] [PMC free article] [PubMed] [Google Scholar]
- 9.Pacheco B, Maccarana M, Malmstrom A. Dermatan 4-O-sulfotransferase 1 is pivotal in the formation of iduronic acid blocks in dermatan sulfate. Glycobiology. 2009;19:1197–1203. doi: 10.1093/glycob/cwp110. [DOI] [PubMed] [Google Scholar]
- 10.Bradbury EJ, Moon LD, Popat RJ, King VR, Bennett GS, Patel PN, Fawcett JW, McMahon SB. Chondroitinase ABC promotes functional recovery after spinal cord injury. Nature. 2002;416:636–640. doi: 10.1038/416636a. [DOI] [PubMed] [Google Scholar]
- 11.Properzi F, Carulli D, Asher RA, Muir E, Camargo LM, van Kuppevelt TH, ten Dam GB, Furukawa Y, Mikami T, Sugahara K, Toida T, Geller HM, Fawcett JW. Chondroitin 6-sulphate synthesis is up-regulated in injured CNS, induced by injury-related cytokines and enhanced in axon-growth inhibitory glia. Eur J Neurosci. 2005;21:378–390. doi: 10.1111/j.1460-9568.2005.03876.x. [DOI] [PubMed] [Google Scholar]
- 12.Bao X, Nishimura S, Mikami T, Yamada S, Itoh N, Sugahara K. Chondroitin sulfate/dermatan sulfate hybrid chains from embryonic pig brain, which contain a higher proportion of L-iduronic acid than those from adult pig brain, exhibit neuritogenic and growth factor binding activities. J Biol Chem. 2004;279:9765–9776. doi: 10.1074/jbc.M310877200. [DOI] [PubMed] [Google Scholar]
- 13.Mitsunaga C, Mikami T, Mizumoto S, Fukuda J, Sugahara K. Chondroitin Sulfate/Dermatan Sulfate Hybrid Chains in the Development of Cerebellum: SPATIOTEMPORAL REGULATION OF THE EXPRESSION OF CRITICAL DISULFATED DISACCHARIDES BY SPECIFIC SULFOTRANSFERASES. J Biol Chem. 2006;281:18942–18952. doi: 10.1074/jbc.M510870200. [DOI] [PubMed] [Google Scholar]
- 14.Zaia J, Costello CE. Compositional analysis of glycosaminoglycans by electrospray mass spectrometry. Anal Chem. 2001;73:233–239. doi: 10.1021/ac000777a. [DOI] [PubMed] [Google Scholar]
- 15.Chai W, Beeson JG, Lawson AM. The structural motif in chondroitin sulfate for adhesion of Plasmodium falciparum-infected erythrocytes comprises disaccharide units of 4-O-sulfated and non-sulfated N-acetylgalactosamine linked to glucuronic acid. J Biol Chem. 2002;277:22438–22446. doi: 10.1074/jbc.M111401200. [DOI] [PubMed] [Google Scholar]
- 16.Yang HO, Gunay NS, Toida T, Kuberan B, Yu G, Kim YS, Linhardt RJ. Preparation and structural determination of dermatan sulfate-derived oligosaccharides. Glycobiology. 2000;10:1033–1039. doi: 10.1093/glycob/10.10.1033. [DOI] [PubMed] [Google Scholar]
- 17.Takagaki K, Munakata H, Kakizaki I, Majima M, Endo M. Enzymatic reconstruction of dermatan sulfate. Biochem Biophys Res Commun. 2000;270:588–593. doi: 10.1006/bbrc.2000.2452. [DOI] [PubMed] [Google Scholar]
- 18.Staples GO, Shi X, Zaia J. Extended NS domains reside at the non-reducing end of heparan sulfate chains. J Biol Chem. 2010;285:18336–18343. doi: 10.1074/jbc.M110.101592. [DOI] [PMC free article] [PubMed] [Google Scholar]
- 19.Shi X, Zaia J. Organ-specific heparan sulfate structural phenotypes. J Biol Chem. 2009;284:11806–11814. doi: 10.1074/jbc.M809637200. [DOI] [PMC free article] [PubMed] [Google Scholar]
- 20.Henriksen J, Ringborg LH, Roepstorrf P. On-line size-exclusion chromatography/mass spectrometry of low molecular mass heparin. J Mass Spectrom. 2004;39:1305–1312. doi: 10.1002/jms.723. [DOI] [PubMed] [Google Scholar]
- 21.Estrella RP, Whitelock JM, Packer NH, Karlsson NG. Graphitized Carbon LC-MS Characterization of the Chondroitin Sulfate Oligosaccharides of Aggrecan. Anal Chem. 2007;79:3597–3606. doi: 10.1021/ac0622227. [DOI] [PubMed] [Google Scholar]
- 22.Karlsson NG, Schulz BL, Packer NH, Whitelock JM. Use of graphitised carbon negative ion LC-MS to analyse enzymatically digested glycosaminoglycans. J Chromatogr B Analyt Technol Biomed Life Sci. 2005;824:139–147. doi: 10.1016/j.jchromb.2005.07.014. [DOI] [PubMed] [Google Scholar]
- 23.Karlsson NG, Wilson NL, Wirth HJ, Dawes P, Joshi H, Packer NH. Negative ion graphitised carbon nano-liquid chromatography/mass spectrometry increases sensitivity for glycoprotein oligosaccharide analysis. Rapid Commun Mass Spectrom. 2004;18:2282–2292. doi: 10.1002/rcm.1626. [DOI] [PubMed] [Google Scholar]
- 24.Kuberan B, Lech M, Zhang L, Wu ZL, Beeler DL, Rosenberg R. Analysis of Heparan Sulfate Oligosaccharides with Ion Pair-Reverse Phase Capillary High Performance Liquid Chromatography-Microelectrospray Ionization Time-of-Flight Mass Spectrometry. J Am Chem Soc. 2002;124:8707–8718. doi: 10.1021/ja0178867. [DOI] [PubMed] [Google Scholar]
- 25.Thanawiroon C, Rice KG, Toida T, Linhardt RJ. Liquid chromatography/mass spectrometry sequencing approach for highly sulfated heparin-derived oligosaccharides. J Biol Chem. 2004;279:2608–2615. doi: 10.1074/jbc.M304772200. [DOI] [PubMed] [Google Scholar]
- 26.Thanawiroon C, Linhardt RJ. Separation of a complex mixture of heparin-derived oligosaccharides using reversed-phase high-performance liquid chromatography. J Chromatogr A. 2003;1014:215–223. doi: 10.1016/s0021-9673(03)00779-9. [DOI] [PubMed] [Google Scholar]
- 27.Henriksen J, Roepstorff P, Ringborg LH. Ion-pairing reversed-phased chromatography/mass spectrometry of heparin. Carbohydr Res. 2006;341:382–387. doi: 10.1016/j.carres.2005.11.030. [DOI] [PubMed] [Google Scholar]
- 28.Bielik AM, Zaia J. Historical overview of glycoanalysis. Methods Mol Biol. 2010;600:9–30. doi: 10.1007/978-1-60761-454-8_2. [DOI] [PubMed] [Google Scholar]
- 29.Bielik AM, Zaia J. Extraction of chondroitin/dermatan sulfate glycosaminoglycans from connective tissue for mass spectrometric analysis. Methods Mol Biol. 2010;600:215–225. doi: 10.1007/978-1-60761-454-8_15. [DOI] [PubMed] [Google Scholar]
- 30.Hitchcock A, Yates KE, Costello C, Zaia J. Comparative Glycomics of Connective Tissue Glycosaminoglycans Proteomics. 2008;8:1384–1397. doi: 10.1002/pmic.200700787. [DOI] [PMC free article] [PubMed] [Google Scholar]
- 31.Hitchcock AM, Yates KE, Shortkroff S, Costello CE, Zaia J. Optimized extraction of glycosaminoglycans from normal and osteoarthritic cartilage for glycomics profiling. Glycobiology. 2006;17:25–35. doi: 10.1093/glycob/cwl046. [DOI] [PMC free article] [PubMed] [Google Scholar]
- 32.Hitchcock AM, Costello CE, Zaia J. Glycoform quantification of chondroitin/dermatan sulfate using an LC/MS/MS platform. Biochemistry. 2006;45:2350–2361. doi: 10.1021/bi052100t. [DOI] [PMC free article] [PubMed] [Google Scholar]
- 33.Zamfir A, Seidler DG, Schonherr E, Kresse H, Peter-Katalini J. On-line sheathless capillary electrophoresis/nanoelectrospray ionization-tandem mass spectrometry for the analysis of glycosaminoglycan oligosaccharides. Electrophoresis. 2004;25:2010–2016. doi: 10.1002/elps.200405925. [DOI] [PubMed] [Google Scholar]
- 34.Zamfir A, Peter-Katalini J. Capillary electrophoresis-mass spectrometry for glycoscreening in biomedical research. Electrophoresis. 2004;25:1949–1963. doi: 10.1002/elps.200405825. [DOI] [PubMed] [Google Scholar]
- 35.Zamfir A, Seidler DG, Kresse H, Peter-Katalini J. Structural investigation of chondroitin/dermatan sulfate oligosaccharides from human skin fibroblast decorin. Glycobiology. 2003 doi: 10.1093/glycob/cwg086. [DOI] [PubMed] [Google Scholar]
- 36.Saad OM, Leary JA. Heparin sequencing using enzymatic digestion and ESI-MSn with HOST: a heparin/HS oligosaccharide sequencing tool. Anal Chem. 2005;77:5902–5911. doi: 10.1021/ac050793d. [DOI] [PubMed] [Google Scholar]
- 37.Saad OM, Leary JA. Compositional analysis and quantification of heparin and heparan sulfate by electrospray ionization ion trap mass spectrometry. Anal Chem. 2003;75:2985–2995. doi: 10.1021/ac0340455. [DOI] [PubMed] [Google Scholar]
- 38.Desaire H, Sirich TL, Leary JA. Evidence of block and randomly sequenced chondroitin polysaccharides: sequential enzymatic digestion and quantification using ion trap tandem mass spectrometry. Anal Chem. 2001;73:3513–3520. doi: 10.1021/ac010385j. [DOI] [PubMed] [Google Scholar]
- 39.Behr JR, Matsumoto Y, White FM, Sasisekharan R. Quantification of isomers from a mixture of twelve heparin and heparan sulfate disaccharides using tandem mass spectrometry. Rapid Commun Mass Spectrom. 2005;19:2553–2562. doi: 10.1002/rcm.2079. [DOI] [PubMed] [Google Scholar]
- 40.Mormann M, Zamfir AD, Seidler DG, Kresse H, Peter-Katalinic J. Analysis of oversulfation in a chondroitin sulfate oligosaccharide fraction from bovine aorta by nanoelectrospray ionization quadrupole time-of-flight and Fourier-transform ion cyclotron resonance mass spectrometry. J Am Soc Mass Spectrom. 2007;18:179–187. doi: 10.1016/j.jasms.2006.09.016. [DOI] [PubMed] [Google Scholar]
- 41.Miller MJC, Costello CE, Malmström A, Zaia J. A tandem mass spectrometric approach to determination of chondroitin/dermatan sulfate oligosaccharide glycoforms. Glycobiology. 2006;16:502–513. doi: 10.1093/glycob/cwj093. [DOI] [PMC free article] [PubMed] [Google Scholar]
- 42.McClellan JM, Costello CE, O’Connor PB, Zaia J. Influence of charge state on product ion mass spectra and the determination of 4S/6S sulfation sequence of chondroitin sulfate oligosaccharides. Anal Chem. 2002;74:3760–3771. doi: 10.1021/ac025506+. [DOI] [PubMed] [Google Scholar]
- 43.Domon B, Costello CE. A systematic nomenclature for carbohydrate fragmentations in FAB-MS/MS spectra of glycoconjugates. Glycoconjugate J. 1988;5:397–409. [Google Scholar]
- 44.Trowbridge JM, Gallo RL. Dermatan sulfate: new functions from an old glycosaminoglycan. Glycobiology. 2002;12:117R–125R. doi: 10.1093/glycob/cwf066. [DOI] [PubMed] [Google Scholar]
- 45.Sugahara K, Mikami T. Chondroitin/dermatan sulfate in the central nervous system. Curr Opin Struct Biol. 2007;17:536–545. doi: 10.1016/j.sbi.2007.08.015. [DOI] [PubMed] [Google Scholar]
- 46.Wolff JJ, Leach FE, Laremore TN, Kaplan DA, Easterling ML, Linhardt RJ, Amster IJ. Negative Electron Transfer Dissociation of Glycosaminoglycans. Anal Chem. 2010 doi: 10.1021/ac100554a. [DOI] [PMC free article] [PubMed] [Google Scholar]
- 47.Wolff JJ, Laremore TN, Aslam H, Linhardt RJ, Amster IJ. Electron-induced dissociation of glycosaminoglycan tetrasaccharides. J Am Soc Mass Spectrom. 2008;19:1449–1458. doi: 10.1016/j.jasms.2008.06.024. [DOI] [PMC free article] [PubMed] [Google Scholar]
- 48.Leach FE, Wolff JJ, Laremore TN, Linhardt RJ, Amster IJ. Evaluation of the Experimental Parameters Which Control Electron Detachment Dissociation, and Their Effect on the Fragmentation Efficiency of Glycosaminoglycan Carbohydrates. Int J Mass Spectrom. 2008;276:110–115. doi: 10.1016/j.ijms.2008.05.017. [DOI] [PMC free article] [PubMed] [Google Scholar]
- 49.Wolff JJ, Chi L, Linhardt RJ, Amster IJ. Distinguishing glucuronic from iduronic acid in glycosaminoglycan tetrasaccharides by using electron detachment dissociation. Anal Chem. 2007;79:2015–2022. doi: 10.1021/ac061636x. [DOI] [PMC free article] [PubMed] [Google Scholar]
- 50.Wolff JJ, Amster IJ, Chi L, Linhardt RJ. Electron detachment dissociation of glycosaminoglycan tetrasaccharides. J Am Soc Mass Spectrom. 2007;18:234–244. doi: 10.1016/j.jasms.2006.09.020. [DOI] [PMC free article] [PubMed] [Google Scholar]
Associated Data
This section collects any data citations, data availability statements, or supplementary materials included in this article.


